Hydrocarbons as ore fluids
Affiliations | Corresponding Author | Cite as | Funding informationKeywords: hydrocarbons, fluid, hydrothermal, transport, deposition, mechanism
- Share this article


Article views:6,417Cumulative count of HTML views and PDF downloads.
- Download Citation
- Rights & Permissions
top
Abstract
Figures and Tables
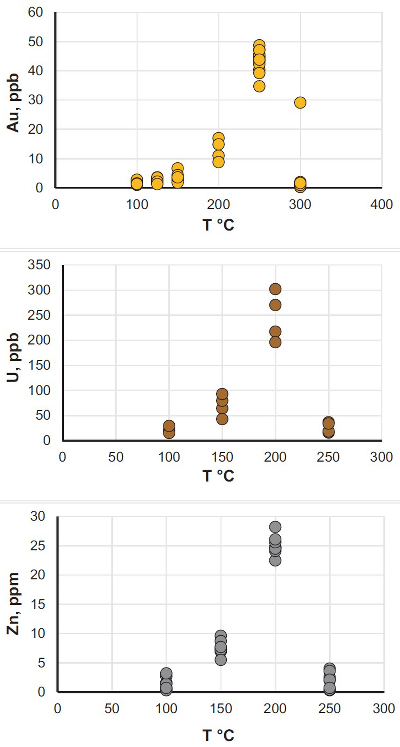 Figure 1 Solubility of metallic gold, zinc, and uranium oxide determined in a variety of crude oils during isothermal solubility experiments. | 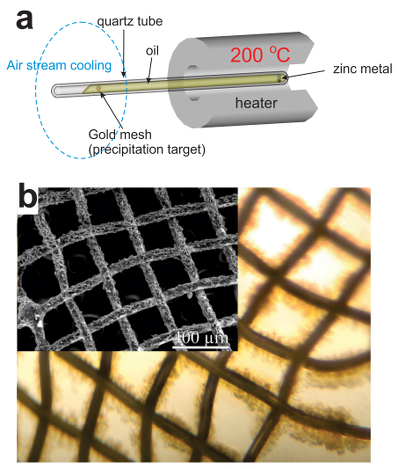 Figure 2 (a) A sketch of the experimental setup for qualitative determination of the ability of natural oils to transport metals at elevated temperatures. (b) A photo and a back scattered electron image of the precipitate discovered at the precipitation target in the experiments with Zn. | 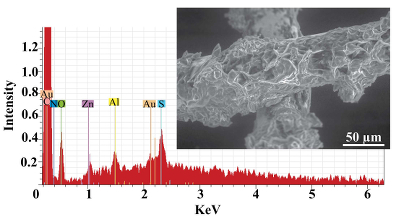 Figure 3 Results of an energy dispersive spectroscopic (EDS) analysis of precipitates obtained from the transport experiments with Zn. | 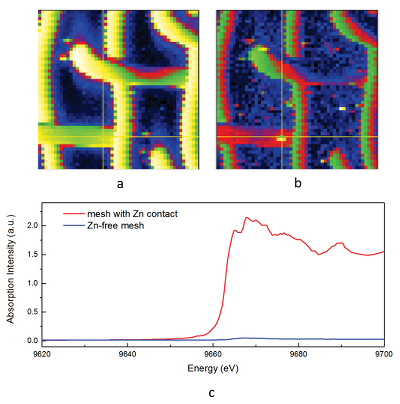 Figure 4 Synchrotron-based micro X-ray fluorescence (XRF) elemental maps showing the spatial distributions of (a) Au and (b) Zn, on a logarithmic scale of intensity (hot colours indicate higher intensity); Zn K edge X-ray absorption near edge structure (XANES) spectra (c) of Zn-bearing and Zn-free samples (the spectrum of the former was taken from the marker in (b)). |
| Figure 1 | Figure 2 | Figure 3 | Figure 4 |
Supplementary Figures and Tables
 Table S-1 Natural crude oils used in the experiments. |  Figure S-1 A sketch of the experimental setup to determine the solubility in natural oils used in experiments with (a) Au and Zn and (b) uranium oxide. |  Table S-2 Solubility of metallic gold (±5 %). |  Table S-3 Solubility of uranium oxide: uraninite/ pitchblende (±3 %). |  Table S-4 Solubility of metallic zinc (±5 %). |
| Table S-1 | Figure S-1 | Table S-2 | Table S-3 | Table S-4 |
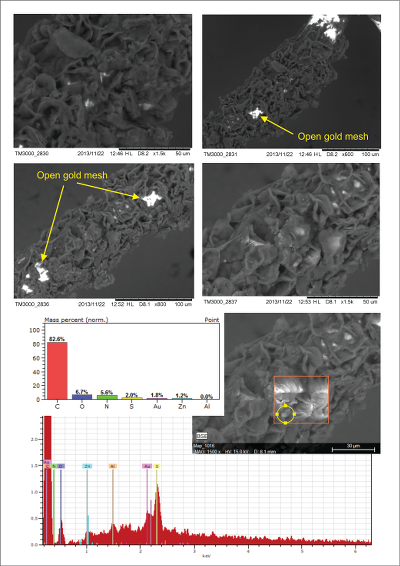 Figure S-2 Examples of back scattered electron images and energy dispersive spectroscopic (EDS) analysis of deposits found on the precipitation targets in non-isothermal experiments. | 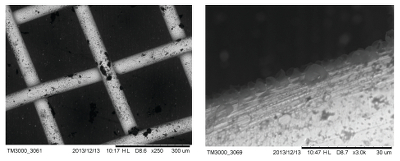 Figure S-3 Examples of back scattered electron images of gold grids from blank experiments (no Zn source). | 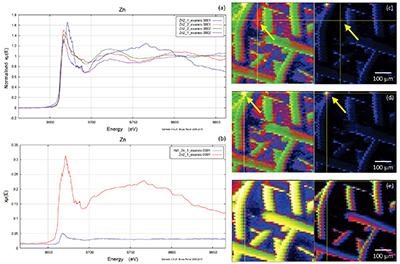 Figure S-4 Group a: (a) Zn K-edge XANES spectra of Zn precipitates, (b) comparison with the background Zn from gold meshes (blue), (c) position of Zn hot spot 1 indicated by an arrow (the left map is plotted on a log scale and the right map on a normal scale; the following maps are plotted in the same manner), (d) position of Zn hot spot 2 indicated by an arrow, (e) Au distribution of the gold mesh. | 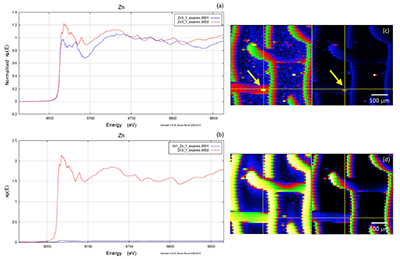 Figure S-5 Group b: (a) Zn K-edge XANES spectra of Zn precipitates, (b) comparison with background Zn (blue), (c) position of Zn hot spot 1 indicated by an arrow, (d) Au distribution of the gold mesh. | 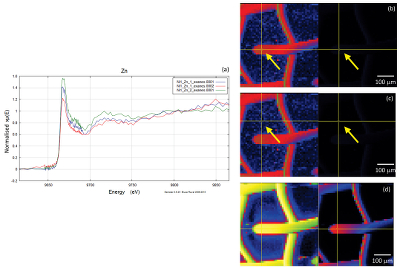 Figure S-6 Group c: (a) Zn K-edge XANES spectra showing the background Zn, (b) position of Zn spot 1 indicated by an arrow, and Zn intensity on a normal scale (right) showing the essential absence of Zn, (c) position of Zn spot 2 indicated by an arrow, (d) Au distribution of the gold grid. |
| Figure S-2 | Figure S-3 | Figure S-4 | Figure S-5 | Figure S-6 |
top
Introduction
A spatial association between hydrocarbons and metallic ores has been reported for a wide variety of deposits, notably the unconformity-type, sandstone-hosted, and quartz-pebble conglomerate U deposits, including the Witwatersrand Au-U deposits (e.g., Mossman et al., 1993
Mossman, D., Nagy, B., Davis, D. (1993) Hydrothermal alteration of organic matter in uranium ores, Elliot Lake, Canada: Implications for selected organic-rich deposits. Geochimica et Cosmochimica Acta 57, 3251–3259.
; Robb and Meyer, 1995Robb, L.J., Meyer, F.M. (1995) The Witwatersrand Basin, South Africa: Geological framework and mineralization processes. Ore Geology Reviews 10, 67–94.
), sedimentary copper deposits (Durieux and Brown, 2007Durieux, C.G., Brown, A.C. (2007) Geological context, mineralization, and timing of the Juramento sediment-hosted stratiform copper–silver deposit, Salta district, northwestern Argentina. Mineralium Deposita 42, 879–899.
), the Carlin gold deposits (Arehart, 1996Arehart, G. (1996) Characteristics and origin of sediment-hosted disseminated gold deposits: A review. Ore Geology Reviews 11, 383–403.
), and Mississippi Valley-type lead-zinc deposits (Anderson and Macqueen, 1982Anderson, G., Macqueen, R. (1982) Ore deposit models-6. Mississippi Valley-type lead-zinc deposits. Geoscience Canada, 108–117.
). Genetic models dealing with ore formation in these systems, however, either attribute the role of the hydrocarbons to that of an immobile trap, in which redox sensitive elements, such as gold and uranium, deposit from aqueous fluids due to reduction and the insolubility of the reduced species (e.g.,Parnell, 1988Parnell, J. (1988) Metal enrichments in solid bitumens : A review. Mineralium Deposita 199, 191–199.
; Anderson, 1991Anderson, G.M. (1991) Organic maturation and ore precipitation in Southeast Missouri. Economic Geology 86, 909–926.
; Cuney, 2009Cuney, M. (2009) The extreme diversity of uranium deposits. Mineralium Deposita 44, 3–9.
), or do not suggest any involvement of organic matter in ore formation. In any case, the role of the main scavenging and transporting agent in these models is attributed to hydrothermal solutions. However, considering the appreciable mobility of hydrocarbons (e.g., Hunt, 1984Hunt, J.M. (1984) Generation and migration of light hydrocarbons. Science 226, 1265–1270.
), their close, and, commonly overlapping, spatial occurrence with ore bodies, and their ability to carry dissolved metals (Lewan, 1984Lewan, M. (1984) Factors controlling the proportionality of vanadium to nickel in crude oils. Geochimica et Cosmochimica Acta 48, 2231–2238.
; Watkinson, 2007Watkinson, P. (2007) Deposition from Crude Oils in Heat Exchangers. Heat Transfer Engineering 28, 177–184.
; Khuhawar et al., 2012Khuhawar, M.Y., Mirza, M.A., Jahangir, T.M. (2012) Determination of Metal Ions in Crude Oils. In: Abdul-Raouf, M.E.-S. (Ed.) Crude Oil Emulsions - Composition Stability and Characterization. InTech, Croatia, 1–25, doi: 10.5772/36945.
), it is tempting to propose that hydrocarbons can play an important role as ore fluids. This hypothesis is now being discussed in the literature (Williams-Jones and Migdisov, 2007Williams-Jones, A.E., Migdisov, A.A. (2007) The solubility of gold in crude oil: implications for ore genesis. In: Andrew, C.J., Borg, G. (Eds.) Digging Deeper, Proceedings of the Ninth Biennial SGA Meeting. Irish Association for Economic Geology, Dublin, 765–768.
) as some indirect evidence has been found in natural systems. For example, it has been suggested that hydrocarbons may have contributed to the transport of gold in the Carlin-type deposits in Nevada (Emsbo and Koenig, 2007Emsbo, P., Koenig, A.E. (2007) Transport of Au in petroleum: evidence from the northern Carlin trend, Nevada. In: Andrew, C.J., Borg, G. (Eds.) Digging Deeper, Proceedings of the Ninth Biennial SGA Meeting. Irish Association for Economic Geology, Dublin, 695–698.
) and to the mobilisation of metals in MVT deposits (Banks, 2014Banks, D.A. (2014) Transport of Metals by Hydrocarbons in MVT Deposits. Acta Geologica Sinica 88, 145–146.
). These findings are in agreement with an earlier report that shows gold can substitute Ni in porphyrin-like structures, which are abundant in natural oils (Manning and Gize, 1993Manning93, M. (1984) Factors controlling the proportionality of vanadium to nickel in crude oils. Geochimica et Cosmochimica Acta 48, 2231–2238.
). It has also been proposed that uranium and titanium in the Witwatersrand deposits were mobilised and concentrated by liquid hydrocarbons (Fuchs et al., 2015Fuchs, S., Schumann, D., Williams-Jones, A.E., Vali, H. (2015) The growth and concentration of uranium and titanium minerals in hydrocarbons of the Carbon Leader Reef, Witwatersrand Supergroup, South Africa. Chemical Geology 393–394, 55–66.
). These studies, however, have assumed that at elevated temperatures, liquid hydrocarbons are able to scavenge metals of interest from their host rocks, transport them in appreciable concentrations, and deposit them in amounts that are economically exploitable. These assumptions remain to be tested. Further development of this hypothesis and its incorporation in models describing ore-forming systems therefore requires an indisputable demonstration of the ability of hydrocarbons to scavenge and transport metals. The purpose of this paper is to report results of experiments that provide this demonstration.top
Testing the Hypothesis
In order to evaluate the ability of liquid hydrocarbons to mobilise and transport metals available in host rocks, we performed a set of batch experiments aimed at determining the isothermal bulk solubility (100–300 °C) of selected metals in a variety of natural crude oils. Oil types and their properties determined before the experiments are reported in the Supplementary Information (Table S-1). Zinc, U and Au were selected for study based on observations of natural systems suggesting that hydrocarbons in some cases may be involved in the transport and concentration of these metals (Emsbo and Koenig, 2007
Emsbo, P., Koenig, A.E. (2007) Transport of Au in petroleum: evidence from the northern Carlin trend, Nevada. In: Andrew, C.J., Borg, G. (Eds.) Digging Deeper, Proceedings of the Ninth Biennial SGA Meeting. Irish Association for Economic Geology, Dublin, 695–698.
; Banks, 2014Banks, D.A. (2014) Transport of Metals by Hydrocarbons in MVT Deposits. Acta Geologica Sinica 88, 145–146.
; Fuchs et al., 2015Fuchs, S., Schumann, D., Williams-Jones, A.E., Vali, H. (2015) The growth and concentration of uranium and titanium minerals in hydrocarbons of the Carbon Leader Reef, Witwatersrand Supergroup, South Africa. Chemical Geology 393–394, 55–66.
). The experiments were performed in titanium autoclaves to which 30 ml of oil were added; metals (wire) or U oxide were placed in the autoclaves in quartz holders. The autoclaves were sealed, and heated to the experimental temperature. After saturation, the autoclaves were quenched, opened, and the holders containing the solids were removed. Samples of the quenched oils were collected and analysed for the metals of interest using NAA methods. The remaining oil was then ashed and the metals from the ash and potential precipitates were dissolved in aqua regia (U, Au) or concentrated hydrochloric acid (Zn). These solutions were analysed using ICP-MS and NAA methods. The solubility of metallic gold, zinc and uranium oxide thus determined for temperatures from 100 to 250 °C, or in the case of gold, 300 °C, is illustrated in Figure 1 (raw solubility data are reported in the Supplementary Information, Tables S-2 to Tables S-4).
Figure 1 Solubility of metallic gold, zinc, and uranium oxide determined in a variety of crude oils during isothermal solubility experiments.
The oils used in our experiments are characterised by significantly different properties and compositions (Supplementary Information, Table S-1). For example, the concentrations of sulphur range from 0.01 to 3.24 wt. % and the API (60 °F) is in the range of 25.4 to 50.6. Surprisingly, the solubility of the metals showed very little dependence on the oil density and sulphur content, and was very similar for the different oils at each temperature investigated. In view of this, we consider that metal solubility in crude oils is controlled by sulphur-unrelated organo-metallic species, such as carboxylates, amides, or porphyrins (Lewan, 1984
Lewan, M. (1984) Factors controlling the proportionality of vanadium to nickel in crude oils. Geochimica et Cosmochimica Acta 48, 2231–2238.
; Giordano, 1985Giordano, T.H. (1985) A preliminary evaluation of organic ligands and metal-organic complexing in Mississippi Valley-type ore solutions. Economic Geology 80, 96–106.
; Mckenna et al., 2009Mckenna, A.M., Purcell, J.M., Rodgers, R.P., Marshall, A.G. (2009) Identification of Vanadyl porphyrins in a heavy crude oil and raw asphaltene by Atmospheric pressure photoionization Fourier transform ion cyclotron resonance (ft-icr) mass spectrometry. Energy and Fuels 23, 2122–2128.
). Thus, in Figure 1, we do not distinguish between different types of oils to emphasise the similarity of the solubility determined for each of them. As shown in this figure, the bulk solubility of the metals increases systematically with increasing temperature, reaching a peak at 200 °C (250 °C in the case of gold), and at higher temperature drops to levels similar to that determined at 100 °C. We suspect that this effect is caused by thermal degradation of hydrocarbons and destruction of the species responsible for metal transport in this medium.It is important to note that the range of concentrations obtained in these experiments at T < 250 °C is within or approaches the range of concentrations which are typically considered sufficient for aqueous fluids to form ore bodies. For example, the concentration of Zn in aqueous solutions responsible for the formation of Mississippi Valley-type deposits is thought to be a few tens of ppm (saturation with sphalerite) (Leach et al., 2006
Leach, D., Macquar, J.-C., Lagneau, V., Leventhal, J., Emsbo, P., Premo, W. (2006) Precipitation of lead–zinc ores in the Mississippi Valley-type deposit at Trèves, Cévennes region of southern France. Geofluids 6, 24–44.
), i.e. similar to that in our experiments with crude oil at 200 °C. The same is true for the giant unconformity-type uranium deposits in Australia and Canada, which are interpreted to have formed from solutions containing between 200 ppb and 60 ppm of U (Richard et al., 2011Richard, A., Rozsypal, C., Mercadier, J., Banks, D.A., Cuney, M., Boiron, M.-C., Cathelineau, M. (2011) Giant uranium deposits formed from exceptionally uranium-rich acidic brines. Nature Geoscience 5, 142–146.
); our measured concentrations reached up to 300 ppb. Finally, hydrothermal solutions responsible for the formation of epithermal gold deposits have been shown, by analogy with geothermal fluids, to contain only a few tens of ppb of gold (Williams-Jones et al., 2009Williams-Jones, A.E., Bowell, R.J., Migdisov, A.A. (2009) Gold in Solution. Elements 5, 281–287.
), which is within the range of the solubility of gold in crude oils determined in this study. It should be noted, however, that the solubility peak determined in our experiments is located at temperatures above the “oil window”, the upper limit of which is typically between 120–170 °C (Philippi, 1965Philippi, G.T. (1965) On the depth, time and mechanism of petroleum generation. Geochimica et Cosmochimica Acta 29, 1021–1049.
). These observations suggest that transport of metals by hydrocarbons is most efficient in the range of temperatures at which oils begin to undergo thermal degradation, producing gaseous hydrocarbons and bitumen (Schenk et al., 1997Schenk, H.J., Di Primio, R., Horsfield, B. (1997) The conversion of oil into gas in petroleum reservoirs. Part 1: Comparative kinetic investigation of gas generation from crude oils of lacustrine, marine and fluviodeltaic origin by programmed-temperature closed-system pyrolysis. Organic Geochemistry 26, 467–481.
). This may explain the occurrence of metalliferous pyrobitumen in natural systems, which has been used to make the case that metals can be transported by hydrocarbons (Emsbo and Koenig, 2007Emsbo, P., Koenig, A.E. (2007) Transport of Au in petroleum: evidence from the northern Carlin trend, Nevada. In: Andrew, C.J., Borg, G. (Eds.) Digging Deeper, Proceedings of the Ninth Biennial SGA Meeting. Irish Association for Economic Geology, Dublin, 695–698.
; Banks, 2014Banks, D.A. (2014) Transport of Metals by Hydrocarbons in MVT Deposits. Acta Geologica Sinica 88, 145–146.
; Fuchs et al., 2015Fuchs, S., Schumann, D., Williams-Jones, A.E., Vali, H. (2015) The growth and concentration of uranium and titanium minerals in hydrocarbons of the Carbon Leader Reef, Witwatersrand Supergroup, South Africa. Chemical Geology 393–394, 55–66.
). It also may explain the absence of ore deposits around large oil fields, which are generally at temperatures too low for efficient metal scavenging by the oils. Our data demonstrate that liquid hydrocarbons can potentially play an important role in ore formation by scavenging disseminated metals and delivering them to geochemical barriers, where they can be deposited in economic concentrations.A plausible depositional mechanism that can be inferred from the data reported in Figure 1 is a temperature-driven process in which liquid hydrocarbons scavenge metals at elevated temperature, become saturated with these metals and deposit them when temperature decreases. In order to verify this hypothesis, we performed a benchtop-scale transport experiment, in which we modelled the above temperature gradient driven mechanism for the transport and concentration of Zn (the metal demonstrating the highest solubility in the isothermal series) by the Statoil #3 type of oils (see Supplementary Information, Table S-1). The latter oil was selected because it possesses average/representative properties (API, sulphur) among those oils available in the required volumes in our collection. The experiments were performed in a set of 25–30 cm long sealed quartz tubes (1 cm diameter) filled by oil. One end of the tubes contained samples of metallic Zn and was heated to 200 °C; the other end contained precipitation targets (gold grids), which were cooled with a stream of air and maintained at room temperature (Fig. 2). This experimental design ensured convection of oil within the tube, causing dissolution of the metals in the heated part and their precipitation at the cooler end. Oils were exposed to this temperature gradient for 5 to 10 days. Thereafter the precipitation targets were removed and the precipitates were collected and characterised using optical microscopy, SEM, ICP-MS, and synchrotron-based X-ray absorption spectroscopy (XAS). In parallel to the above experiments, blank experiments, which did not contain samples of Zn metal, were performed.

Figure 2 (a) A sketch of the experimental setup for qualitative determination of the ability of natural oils to transport metals at elevated temperatures. (b) A photo and a back scattered electron image of the precipitate discovered at the precipitation target in the experiments with Zn.
As expected, we did not detect any significant precipitation in the blank experiments. In contrast, as shown in Figure 2, all the experiments with metallic Zn produced precipitates. The composition of the phase analysed by EDS varied from 0.5 to 1.5 wt. % Zn, 5 to 8.5 wt. % N, and 6 to 10 wt. % O with the rest being carbon (Fig. 3). In order to obtain more accurate determinations of the concentrations of Zn in the precipitates, the sample shown in Figures 2 and 3 was digested in nitric acid and the resulting solution was analysed for Zn by ICP-MS methods. The concentration of Zn re-calculated for the digested solid was 0.20 wt. %, in reasonable agreement with the semi-quantitative results by EDS. Considering that the total mass of the above sample was 3472 µg, over a time of 5 days, 7 µg of Zn were transported by 15 ml of oil. A second precipitate sample was investigated using synchrotron-based micro X-ray fluorescence (XRF) at beamline 20-ID-B of the Advanced Photon Source (APS), Argonne National Laboratory (Argonne, IL, USA). The sample displayed a strong correlation in the spatial distribution of Zn and Au on the gold grid and its vicinity (Fig. 4a,b; Supplementary Information, Figs. S-4 to S-6). The presence of Zn precipitates was determined by the characteristic Zn K-edge absorption peak (Fig. 4c red curve). For comparison, absorption curves from a gold mesh without Zn precipitates yield an intensity that is two orders of magnitude lower. Considering that Zn was detected in only trace concentrations in the oil prior to the experiment, that blank experiments performed without a Zn source did not produce any precipitates, and the clear evidence of precipitation of a Zn-bearing phase(s) in the experiments with Zn, we conclude that the latter resulted from dissolution of metallic Zn in the hot oil and its deposition upon cooling. Although these results are largely qualitative, they provide a first order insight into the behaviour of metals in liquid hydrocarbons, i.e. liquid hydrocarbons have the potential to mobilise and concentrate metals.

Figure 3 Results of an energy dispersive spectroscopic (EDS) analysis of precipitates obtained from the transport experiments with Zn.

Figure 4 Synchrotron-based micro X-ray fluorescence (XRF) elemental maps showing the spatial distributions of (a) Au and (b) Zn, on a logarithmic scale of intensity (hot colours indicate higher intensity); Zn K edge X-ray absorption near edge structure (XANES) spectra (c) of Zn-bearing and Zn-free samples (the spectrum of the former was taken from the marker in (b)).
top
Conclusions
It should be stressed that the main purpose of this exploratory research was not to deliver a quantitative description of the solubility of metals in crude oils, but to test the hypothesis that liquid hydrocarbons can be powerful agents of metal re-distribution in the Earth’s crust and may provide a means for concentrating metals to the levels needed to form ore deposits. We believe that our experiments, albeit preliminary, have shown that liquid hydrocarbons have all the characteristics required to mobilise metals and act as ore fluids. It can be argued that overall liquid hydrocarbons are likely to be less important in this respect than aqueous fluids, if only because they are much less abundant than aqueous fluids. However, inasmuch as hydrocarbons are commonly found in close association with some types of ore deposits, it is reasonable to consider the possibility that for these deposits at least, liquid hydrocarbons may have contributed significantly to ore formation as an agent of metal transport. The findings of our study may therefore raise serious questions about the validity of currently accepted models for the formation of some ore deposit types.
top
Acknowledgements
The data reported in the paper are presented in the Supplementary Information. This research was made possible through grants from NSERC and FQRNT to AEW-J. This research used resources of the Advanced Photon Source, an Office of Science User Facility operated for the U.S. Department of Energy (DOE) Office of Science by Argonne National Laboratory, and was supported by the U.S. DOE under Contract No. DE-AC02-06CH11357, and the Canadian Light Source and its funding partners.
Editor: Simon Redfern
top
References
Anderson, G.M. (1991) Organic maturation and ore precipitation in Southeast Missouri. Economic Geology 86, 909–926.
 Show in context
 Genetic models dealing with ore formation in these systems, however, either attribute the role of the hydrocarbons to that of an immobile trap, in which redox sensitive elements, such as gold and uranium, deposit from aqueous fluids due to reduction and the insolubility of the reduced species (e.g., Parnell, 1988; Anderson, 1991; Cuney, 2009), or do not suggest any involvement of organic matter in ore formation.
View in article
Anderson, G., Macqueen, R. (1982) Ore deposit models-6. Mississippi Valley-type lead-zinc deposits. Geoscience Canada, 108–117.
 Show in context
 A spatial association between hydrocarbons and metallic ores has been reported for a wide variety of deposits, notably the unconformity-type, sandstone-hosted, and quartz-pebble conglomerate U deposits, including the Witwatersrand Au-U deposits (e.g., Mossman et al., 1993; Robb and Meyer, 1995), sedimentary copper deposits (Durieux and Brown, 2007), the Carlin gold deposits (Arehart, 1996), and Mississippi Valley-type lead-zinc deposits (Anderson and Macqueen, 1982).
View in article
Arehart, G. (1996) Characteristics and origin of sediment-hosted disseminated gold deposits: A review. Ore Geology Reviews 11, 383–403.
 Show in context
 A spatial association between hydrocarbons and metallic ores has been reported for a wide variety of deposits, notably the unconformity-type, sandstone-hosted, and quartz-pebble conglomerate U deposits, including the Witwatersrand Au-U deposits (e.g., Mossman et al., 1993; Robb and Meyer, 1995), sedimentary copper deposits (Durieux and Brown, 2007), the Carlin gold deposits (Arehart, 1996), and Mississippi Valley-type lead-zinc deposits (Anderson and Macqueen, 1982).
View in article
Banks, D.A. (2014) Transport of Metals by Hydrocarbons in MVT Deposits. Acta Geologica Sinica 88, 145–146.
 Show in context
 For example, it has been suggested that hydrocarbons may have contributed to the transport of gold in the Carlin-type deposits in Nevada (Emsbo and Koenig, 2007) and to the mobilisation of metals in MVT deposits (Banks, 2014).
View in article
Oil types and their properties determined before the experiments are reported in the Supplementary Information (Table S-1). Zinc, U and Au were selected for study based on observations of natural systems suggesting that hydrocarbons in some cases may be involved in the transport and concentration of these metals (Emsbo and Koenig, 2007; Banks, 2014; Fuchs et al., 2015).
View in article
This may explain the occurrence of metalliferous pyrobitumen in natural systems, which has been used to make the case that metals can be transported by hydrocarbons (Emsbo and Koenig, 2007; Banks, 2014; Fuchs et al., 2015).
View in article
Cuney, M. (2009) The extreme diversity of uranium deposits. Mineralium Deposita 44, 3–9.
 Show in context
 Genetic models dealing with ore formation in these systems, however, either attribute the role of the hydrocarbons to that of an immobile trap, in which redox sensitive elements, such as gold and uranium, deposit from aqueous fluids due to reduction and the insolubility of the reduced species (e.g., Parnell, 1988; Anderson, 1991; Cuney, 2009), or do not suggest any involvement of organic matter in ore formation.
View in article
Durieux, C.G., Brown, A.C. (2007) Geological context, mineralization, and timing of the Juramento sediment-hosted stratiform copper–silver deposit, Salta district, northwestern Argentina. Mineralium Deposita 42, 879–899.
 Show in context
 A spatial association between hydrocarbons and metallic ores has been reported for a wide variety of deposits, notably the unconformity-type, sandstone-hosted, and quartz-pebble conglomerate U deposits, including the Witwatersrand Au-U deposits (e.g., Mossman et al., 1993; Robb and Meyer, 1995), sedimentary copper deposits (Durieux and Brown, 2007), the Carlin gold deposits (Arehart, 1996), and Mississippi Valley-type lead-zinc deposits (Anderson and Macqueen, 1982).
View in article
Emsbo, P., Koenig, A.E. (2007) Transport of Au in petroleum: evidence from the northern Carlin trend, Nevada. In: Andrew, C.J., Borg, G. (Eds.) Digging Deeper, Proceedings of the Ninth Biennial SGA Meeting. Irish Association for Economic Geology, Dublin, 695–698.
 Show in context
 For example, it has been suggested that hydrocarbons may have contributed to the transport of gold in the Carlin-type deposits in Nevada (Emsbo and Koenig, 2007) and to the mobilisation of metals in MVT deposits (Banks, 2014).
View in article
Oil types and their properties determined before the experiments are reported in the Supplementary Information (Table S-1). Zinc, U and Au were selected for study based on observations of natural systems suggesting that hydrocarbons in some cases may be involved in the transport and concentration of these metals (Emsbo and Koenig, 2007; Banks, 2014; Fuchs et al., 2015).
View in article
This may explain the occurrence of metalliferous pyrobitumen in natural systems, which has been used to make the case that metals can be transported by hydrocarbons (Emsbo and Koenig, 2007; Banks, 2014; Fuchs et al., 2015).
View in article
Fuchs, S., Schumann, D., Williams-Jones, A.E., Vali, H. (2015) The growth and concentration of uranium and titanium minerals in hydrocarbons of the Carbon Leader Reef, Witwatersrand Supergroup, South Africa. Chemical Geology 393–394, 55–66.
 Show in context
 It has also been proposed that uranium and titanium in the Witwatersrand deposits were mobilised and concentrated by liquid hydrocarbons (Fuchs et al., 2015).
View in article
Oil types and their properties determined before the experiments are reported in the Supplementary Information (Table S-1). Zinc, U and Au were selected for study based on observations of natural systems suggesting that hydrocarbons in some cases may be involved in the transport and concentration of these metals (Emsbo and Koenig, 2007; Banks, 2014; Fuchs et al., 2015).
View in article
This may explain the occurrence of metalliferous pyrobitumen in natural systems, which has been used to make the case that metals can be transported by hydrocarbons (Emsbo and Koenig, 2007; Banks, 2014; Fuchs et al., 2015).
View in article
Giordano, T.H. (1985) A preliminary evaluation of organic ligands and metal-organic complexing in Mississippi Valley-type ore solutions. Economic Geology 80, 96–106.
 Show in context
 In view of this, we consider that metal solubility in crude oils is controlled by sulphur-unrelated organo-metallic species, such as carboxylates, amides, or porphyrins (Lewan, 1984; Giordano, 1985; Mckenna et al., 2009).
View in article
Hunt, J.M. (1984) Generation and migration of light hydrocarbons. Science 226, 1265–1270.
 Show in context
 However, considering the appreciable mobility of hydrocarbons (e.g., Hunt, 1984), their close, and, commonly overlapping, spatial occurrence with ore bodies, and their ability to carry dissolved metals (Lewan, 1984; Watkinson, 2007; Khuhawar et al., 2012), it is tempting to propose that hydrocarbons can play an important role as ore fluids.
View in article
Khuhawar, M.Y., Mirza, M.A., Jahangir, T.M. (2012) Determination of Metal Ions in Crude Oils. In: Abdul-Raouf, M.E.-S. (Ed.) Crude Oil Emulsions - Composition Stability and Characterization. InTech, Croatia, 1–25, doi: 10.5772/36945.
 Show in context
 However, considering the appreciable mobility of hydrocarbons (e.g., Hunt, 1984), their close, and, commonly overlapping, spatial occurrence with ore bodies, and their ability to carry dissolved metals (Lewan, 1984; Watkinson, 2007; Khuhawar et al., 2012), it is tempting to propose that hydrocarbons can play an important role as ore fluids.
View in article
Leach, D., Macquar, J.-C., Lagneau, V., Leventhal, J., Emsbo, P., Premo, W. (2006) Precipitation of lead–zinc ores in the Mississippi Valley-type deposit at Trèves, Cévennes region of southern France. Geofluids 6, 24–44.
 Show in context
 For example, the concentration of Zn in aqueous solutions responsible for the formation of Mississippi Valley-type deposits is thought to be a few tens of ppm (saturation with sphalerite) (Leach et al., 2006), i.e. similar to that in our experiments with crude oil at 200 °C.
View in article
Lewan, M. (1984) Factors controlling the proportionality of vanadium to nickel in crude oils. Geochimica et Cosmochimica Acta 48, 2231–2238.
 Show in context
 However, considering the appreciable mobility of hydrocarbons (e.g., Hunt, 1984), their close, and, commonly overlapping, spatial occurrence with ore bodies, and their ability to carry dissolved metals (Lewan, 1984; Watkinson, 2007; Khuhawar et al., 2012), it is tempting to propose that hydrocarbons can play an important role as ore fluids.
View in article
In view of this, we consider that metal solubility in crude oils is controlled by sulphur-unrelated organo-metallic species, such as carboxylates, amides, or porphyrins (Lewan, 1984; Giordano, 1985; Mckenna et al., 2009).
View in article
Manning, D., Gize, A. (1993) Chapter 25. The role of organic matter in ore transport processes. In: Engel, M., Macko, S.A. (Eds.), Organic Geochemistry. Topics in Geobiology, Volume 11. Springer, Boston, MA, 547–563.
 Show in context
 These findings are in agreement with an earlier report that shows gold can substitute Ni in porphyrin-like structures, which are abundant in natural oils (Manning and Gize, 1993).
View in article
Mckenna, A.M., Purcell, J.M., Rodgers, R.P., Marshall, A.G. (2009) Identification of Vanadyl porphyrins in a heavy crude oil and raw asphaltene by Atmospheric pressure photoionization Fourier transform ion cyclotron resonance (ft-icr) mass spectrometry. Energy and Fuels 23, 2122–2128.
 Show in context
 In view of this, we consider that metal solubility in crude oils is controlled by sulphur-unrelated organo-metallic species, such as carboxylates, amides, or porphyrins (Lewan, 1984; Giordano, 1985; Mckenna et al., 2009).
View in article
Mossman, D., Nagy, B., Davis, D. (1993) Hydrothermal alteration of organic matter in uranium ores, Elliot Lake, Canada: Implications for selected organic-rich deposits. Geochimica et Cosmochimica Acta 57, 3251–3259.
 Show in context
 A spatial association between hydrocarbons and metallic ores has been reported for a wide variety of deposits, notably the unconformity-type, sandstone-hosted, and quartz-pebble conglomerate U deposits, including the Witwatersrand Au-U deposits (e.g., Mossman et al., 1993; Robb and Meyer, 1995), sedimentary copper deposits (Durieux and Brown, 2007), the Carlin gold deposits (Arehart, 1996), and Mississippi Valley-type lead-zinc deposits (Anderson and Macqueen, 1982).
View in article
Parnell, J. (1988) Metal enrichments in solid bitumens : A review. Mineralium Deposita 199, 191–199.
 Show in context
 Genetic models dealing with ore formation in these systems, however, either attribute the role of the hydrocarbons to that of an immobile trap, in which redox sensitive elements, such as gold and uranium, deposit from aqueous fluids due to reduction and the insolubility of the reduced species (e.g., Parnell, 1988; Anderson, 1991; Cuney, 2009), or do not suggest any involvement of organic matter in ore formation.
View in article
Philippi, G.T. (1965) On the depth, time and mechanism of petroleum generation. Geochimica et Cosmochimica Acta 29, 1021–1049.
 Show in context
 It should be noted, however, that the solubility peak determined in our experiments is located at temperatures above the “oil window”, the upper limit of which is typically between 120–170 °C (Philippi, 1965)
View in article
Richard, A., Rozsypal, C., Mercadier, J., Banks, D.A., Cuney, M., Boiron, M.-C., Cathelineau, M. (2011) Giant uranium deposits formed from exceptionally uranium-rich acidic brines. Nature Geoscience 5, 142–146.
 Show in context
 The same is true for the giant unconformity-type uranium deposits in Australia and Canada, which are interpreted to have formed from solutions containing between 200 ppb and 60 ppm of U (Richard et al., 2011); our measured concentrations reached up to 300 ppb.
View in article
Robb, L.J., Meyer, F.M. (1995) The Witwatersrand Basin, South Africa: Geological framework and mineralization processes. Ore Geology Reviews 10, 67–94.
 Show in context
 A spatial association between hydrocarbons and metallic ores has been reported for a wide variety of deposits, notably the unconformity-type, sandstone-hosted, and quartz-pebble conglomerate U deposits, including the Witwatersrand Au-U deposits (e.g., Mossman et al., 1993; Robb and Meyer, 1995), sedimentary copper deposits (Durieux and Brown, 2007), the Carlin gold deposits (Arehart, 1996), and Mississippi Valley-type lead-zinc deposits (Anderson and Macqueen, 1982).
View in article
Schenk, H.J., Di Primio, R., Horsfield, B. (1997) The conversion of oil into gas in petroleum reservoirs. Part 1: Comparative kinetic investigation of gas generation from crude oils of lacustrine, marine and fluviodeltaic origin by programmed-temperature closed-system pyrolysis. Organic Geochemistry 26, 467–481.
 Show in context
 These observations suggest that transport of metals by hydrocarbons is most efficient in the range of temperatures at which oils begin to undergo thermal degradation, producing gaseous hydrocarbons and bitumen (Schenk et al., 1997).
View in article
Watkinson, P. (2007) Deposition from Crude Oils in Heat Exchangers. Heat Transfer Engineering 28, 177–184.
 Show in context
 However, considering the appreciable mobility of hydrocarbons (e.g., Hunt, 1984), their close, and, commonly overlapping, spatial occurrence with ore bodies, and their ability to carry dissolved metals (Lewan, 1984; Watkinson, 2007; Khuhawar et al., 2012), it is tempting to propose that hydrocarbons can play an important role as ore fluids.
View in article
Williams-Jones, A.E., Migdisov, A.A. (2007) The solubility of gold in crude oil: implications for ore genesis. In: Andrew, C.J., Borg, G. (Eds.) Digging Deeper, Proceedings of the Ninth Biennial SGA Meeting. Irish Association for Economic Geology, Dublin, 765–768.
 Show in context
 This hypothesis is now being discussed in the literature (Williams-Jones and Migdisov, 2007) as some indirect evidence has been found in natural systems.
View in article
Williams-Jones, A.E., Bowell, R.J., Migdisov, A.A. (2009) Gold in Solution. Elements 5, 281–287.
 Show in context
 Finally, hydrothermal solutions responsible for the formation of epithermal gold deposits have been shown, by analogy with geothermal fluids, to contain only a few tens of ppb of gold (Williams-Jones et al., 2009), which is within the range of the solubility of gold in crude oils determined in this study.
View in article
top
Supplementary Information
S-1. Natural Crude Oils Used in the Experiments
Table S-1 Natural crude oils used in the experiments.
| Oils | Location | API (60 ˚F) | S (wt. %) | N (ppm) | Zn (ppb) | Au (ppb) | U (ppb) | Ni (ppb) | V (ppb) |
| OMC 3178 | Gabon | 38.1 | 0.01 | 763 | 1061 ± 32 | 2.39 ± 0.55 | < 0.0001 | 14733 ± 263 | 168 ± 2.70 |
| OMC 6965 | Turkey | N/A | N/A | N/A | 161 ± 91 | 1.52 ± 0.19 | < 0.0001 | 10547 ± 424 | 13137 ± 210 |
| OMC 7223 | UK | 33.1 | 0.49 | 1042 | 132 ± 43 | 1.00 ± 0.07 | < 0.0001 | 1101 ± 15.9 | 1570 ± 7.45 |
| OMC 13583 | Oman | 41.8 | 0.32 | 321 | 525 ± 136 | 0.88 ± 0.11 | < 0.0001 | 902 ± 33.9 | 374 ± 10.3 |
| OMC 14501 | Oman | 28.8 | 2.48 | 1471 | 196 ± 120 | 0.64 ± 0.01 | < 0.0001 | 3997 ± 67.0 | 3661 ± 33.1 |
| Shell #1 | N/A | 28.1 | 3.24 | 52.1 | < 0.1 | 2.34 ± 0.18 | 0.012 ± 0.004 | 3.33 ± 0.009 | 0.44 ± 0.09 |
| Shell #2 | N/A | 39.5 | 0.13 | 109 | < 0.1 | 0.29 ± 0.11 | 0.011 ± 0.014 | 4.97 ± 1.19 | 84.2 ± 12.2 |
| Statoil #1 | N/A | 50.6 | 0.12 | 180 | 246 ± 25 | 0.17 ± 0.01 | 0.032 ± 0.005 | 85.0 ± 4.27 | 358 ± 11.8 |
| Statoil #2 | N/A | 25.4 | 0.52 | 870 | 5977 ± 374 | < 0.01 | 0.037 ± 0.001 | 2069 ± 67.1 | 8811 ± 189 |
| Statoil #3 | N/A | 29.6 | 0.3 | 500 | 240 ± 6.64 | < 0.01 | 0.035 ± 0.001 | 897 ± 3.59 | 234 ± 11.2 |
| Statoil #4 | N/A | 35.9 | 0.14 | 540 | 296 ± 125 | < 0.01 | 0.021 ± 0.004 | 988 ± 3.69 | 616 ± 5.46 |
S-2. Methods
Experimental technique employed to determine isothermal solubility of metals in crude oils
Experiments with metallic gold and zinc were performed in Ti light weight autoclaves. Zinc or gold wire (Alfa Aesar, 99.95 %, metal basis) was placed at one end of an open quartz tube (quartz holder) which, in turn, was placed at the bottom of the autoclave. 30 ml of a crude oil were thereafter added to the autoclave, the autoclave was sealed and placed in an oven (Fisher Isotemp Forced Draft oven). It remained in the oven at an experimental temperature until the metal re-equilibrated with the oil. The time required to saturate the oils with respect to the solids was determined using time series experiments and was approximately 5 to 7 days for all the oils used in the experiments. A sketch illustrating the experimental setup is shown in Figure S-1. After equilibration, the autoclaves were quenched in cold water and opened, and holders containing the metals were removed. Quenched liquid oil was evacuated from the autoclaves and sampled, and the metal of interest was analysed using Neutron Activation Analysis (NAA, Universite de Montreal, Montreal, Canada). Heating the oil typically resulted in the formation of dense organic precipitates that were deposited at the bottom and on the walls of the autoclaves, and could not be removed with liquid oil. These precipitates were ashed at 400–450 °C directly in the autoclave. The ashes were treated with 5–10 ml of concentrated HCl (Fisher Scientific, trace metals grade) in the case of experiments with Zn, or aqua regia (HCl + HNO3; Fisher Scientific, trace metals grade) in the experiments with Au. Acid solutions that resulted from this washing were removed from the autoclaves and analysed for the metal of interest using NAA methods. Total concentrations presented in the tables below were calculated assuming that the metals found in precipitates in the solutions at the experimental temperature were deposited during quenching. The amounts of gold found in the precipitates were comparable to those found in the quenched liquid, whereas the zinc mostly remained in the quenched liquid oil.

Figure S-1 A sketch of the experimental setup to determine the solubility in natural oils used in experiments with (a) Au and Zn and (b) uranium oxide.
Experiments with uranium oxide were performed in sealed quartz tubes, which were, in turn, placed in titanium autoclaves (Fig. S-1b). A crystal of uranium oxide was placed in a quartz tube together with 5–7 ml of the crude oil of interest. The heating and quenching procedures were identical to those for the experiments with Au and Zn. After quenching, the quartz tubes were removed from the autoclaves and opened, and the holders containing uranium oxide were retrieved. All the oil in the quartz tube was then ashed at 450–500 °C, and the resulting ash was treated with 5 ml of aqua regia to leach out the metal. Concentrations of U in aqua regia were analysed using the ICP-MS method (Activation Laboratories and McGill University); final concentrations of U in crude oil were re-calculated from the amounts of metal found in the washing solutions.
Determination of Zn concentrations from the gold mesh precipitates
Zinc concentrations of precipitates on the gold mesh were processed in PYREX™ reusable culture tubes which were first cleaned using OptimaTM grade 16 N HNO3 for 12 hours, washed with Mili-Q® water for two hours, and then dried in an oven at 150 ˚C. The Au grid containing Zn precipitates was then placed in clean culture tubes containing 5 g of OptimaTM grade 16 N HNO3 to digest the precipitates. The resulting solution was analysed using inductively coupled plasma mass spectrometry (iCap-Q Thermo ScientificTM Quadrupole ICP-MS). The weight of the Au grid before and after sample digestion was recorded (microgram scale).
Analysis of the metal concentrations in crude oils
Crude oils were processed in PYREX™ reusable culture tubes with quartz wool stoppers, which prior to processing were cleaned with HNO3 for 24 hr, washed with Mili-Q® water for two hr, and then dried in an oven for one hr at 150 ˚C. Three mL aliquots of oil were placed into three separate culture tubes, which were capped with quartz wool, preventing any loss of ash. The capped culture tubes were then dry-ashed at 550 ˚C in a muffle furnace for 12 hr. Once ashed, 4 mL of 75 % OptimaTM grade HNO3 were placed in each culture tube to oxidise the ash and leach the metals. The resulting solution was analysed using inductively coupled plasma mass spectrometry (iCap-Q Thermo ScientificTM Quadrupole ICP-MS). Reproducibility of the data was calculated based on the triplicates.
S-3. Isothermal Solubility in Crude Oils Determined in the Experiments
Table S-2 Solubility of metallic gold (±5 %).
| Sample | T (°C) | Au (ppb) |
| Shell#1 | 100 | 2.63 |
| Shell#1 | 100 | 1.83 |
| Shell#2 | 100 | 2.53 |
| Shell#2 | 100 | 1.83 |
| Shell#2 | 100 | 2.77 |
| Statoil #1 | 100 | 1.03 |
| Statoil #4 | 100 | 1.5 |
| Statoil #2 | 100 | 1.1 |
| Statoil #3 | 100 | 1.33 |
| Shell#1 | 125 | 1.47 |
| Shell#1 | 125 | 3.6 |
| Shell#1 | 125 | 2.37 |
| Shell#2 | 125 | 1.87 |
| Shell#2 | 125 | 3.17 |
| Shell#2 | 125 | 2.73 |
| OMC 13583 | 125 | 3.5 |
| Shell#1 | 125 | 2.1 |
| Shell#2 | 125 | 1.27 |
| Shell#2 | 150 | 6.67 |
| Shell#1 | 150 | 4.33 |
| Statoil #3 | 150 | 2.97 |
| Statoil #4 | 150 | 2.83 |
| Statoil #2 | 150 | 1.77 |
| Statoil #1 | 150 | 3.6 |
| Shell#2 | 200 | 11 |
| Shell#1 | 200 | 17 |
| Statoil #1 | 200 | 14.87 |
| Statoil #3 | 200 | 8.8 |
| OMC 9956 | 250 | 40.4 |
| OMC 14501 | 250 | 47.27 |
| OMC 6965 | 250 | 44.67 |
| OMC 3178 | 250 | 44.73 |
| OMC 13583 | 250 | 48.7 |
| OMC 7223 | 250 | 45.6 |
| Shell#1 | 250 | 47.03 |
| Shell#2 | 250 | 43.27 |
| Statoil #3 | 250 | 42.2 |
| Statoil #4 | 250 | 34.7 |
| Statoil #2 | 250 | 39.2 |
| Statoil #1 | 250 | 43.8 |
| OMC 14501 | 300 | 1.97 |
| OMC 6965 | 300 | 0.33 |
| OMC 3178 | 300 | 0.6 |
| OMC 13583 | 300 | 29.13 |
| OMC 7223 | 300 | 0.3 |
| Shell#1 | 300 | 1 |
| Shell#2 | 300 | 1.63 |
Table S-3 Solubility of uranium oxide: uraninite/ pitchblende (±3 %).
| Sample | T (°C) | U (ppb) |
| Statoil #2 | 100 | 21.1 |
| Statoil #3 | 100 | 19.2 |
| Statoil #1 | 100 | 15.1 |
| Statoil #4 | 100 | 29.1 |
| Statoil #2 | 150 | 63.9 |
| Statoil #3 | 150 | 42.8 |
| Statoil #1 | 150 | 79.6 |
| Statoil #4 | 150 | 92.9 |
| Statoil #2 | 200 | 302 |
| Statoil #3 | 200 | 217.1 |
| Statoil #4 | 200 | 196 |
| Statoil #2 | 200 | 270 |
| Statoil #2 | 250 | 36.5 |
| Statoil #3 | 250 | 16.1 |
| Statoil #1 | 250 | 18.2 |
| Statoil #4 | 250 | 33.8 |
Table S-4 Solubility of metallic zinc (±5 %).
| Sample | T (°C) | Zn (ppm) |
| OMC 14501 | 100 | 2.7 |
| OMC 6965 | 100 | 0.7 |
| OMC 3178 | 100 | 1.6 |
| OMC 13583 | 100 | 0.3 |
| OMC 7223 | 100 | 1.4 |
| Shell#1 | 100 | 3.2 |
| Shell#2 | 100 | 0.7 |
| OMC 14501 | 150 | 7.5 |
| OMC 6965 | 150 | 6.9 |
| OMC 3178 | 150 | 9.6 |
| OMC 13583 | 150 | 8.7 |
| OMC 7223 | 150 | 7.2 |
| Shell#1 | 150 | 7.7 |
| Shell#2 | 150 | 5.5 |
| OMC 14501 | 200 | 22.5 |
| OMC 6965 | 200 | 24.7 |
| OMC 3178 | 200 | 24.7 |
| OMC 13583 | 200 | 24.1 |
| OMC 7223 | 200 | 24.5 |
| Shell#1 | 200 | 25.6 |
| Shell#2 | 200 | 26.1 |
| OMC 14501 | 250 | 0.3 |
| OMC 6965 | 250 | 4 |
| OMC 3178 | 250 | 3.6 |
| OMC 13583 | 250 | 2 |
| OMC 7223 | 250 | 0.4 |
| Shell#1 | 250 | 2.1 |
| Shell#2 | 250 | 0.7 |
S-4. Analysis of Precipitates Found in Transport Experiments in Quartz Tubes

Figure S-2 Examples of back scattered electron images and energy dispersive spectroscopic (EDS) analysis of deposits found on the precipitation targets in non-isothermal experiments.

Figure S-3 Examples of back scattered electron images of gold grids from blank experiments (no Zn source).
Zn analysis using synchrotron-based micro X-ray fluorescence (XRF) and X-ray absorption near edge structure (XANES) spectroscopy
Synchrotron X-ray measurements were conducted at the beamline (20-ID-C) of the Advanced Photon Source (APS), Argonne National Laboratory (Argonne, IL, USA). The incident beam was monochromatised using a Si(111) fixed-exit, double-crystal monochromator. XANES spectra of Zn were collected in an X-ray fluorescence configuration. Energy calibration was obtained using a Zn metal foil (first derivative peak defined to be 9659 eV). The samples were gold grids taken directly from oil experiments and mounted with kapton tapes on the beamline sample stage. The software Athena was used for XANES analysis, and X-ray elemental mapping was processed by software 2-D Scan Plot v3.
A micro-XRF scan of 500 µm × 500 µm with a beam energy of 11930 eV (above Au LIII-edge) yielded the distributions of Au and Zn, including the location of the gold mesh network, and the position of precipitated Zn. Figures S-4, S-5 and S-6 show the results of five mapping scans, where groups a and b are for Zn on the gold network and group c for a Zn-free sample. Within the maps from groups a and b, certain Zn hotspots on the network and from its vicinity (located by the arrows) were investigated by Zn K edge absorption spectroscopy. Evidence for the presence of Zn was obtained by comparing the intensities of absorption curves near the Zn K-edge region from the Zn-bearing samples in group a or b (intensity I1) and those without Zn in group c (intensity I0), the latter of which serves as the background noise of Zn. For example, Figure S-6b,c shows the intensity of Zn and compares this to the intensity of Zn shown in Figure S-5c. The latter value has an average signal-to-noise ratio (I1/I0) of ~ 102, which convincingly reveals the presence of Zn (Fig. S-5c).

Figure S-4 Group a: (a) Zn K-edge XANES spectra of Zn precipitates, (b) comparison with the background Zn from gold meshes (blue), (c) position of Zn hot spot 1 indicated by an arrow (the left map is plotted on a log scale and the right map on a normal scale; the following maps are plotted in the same manner), (d) position of Zn hot spot 2 indicated by an arrow, (e) Au distribution of the gold mesh.

Figure S-5 Group b: (a) Zn K-edge XANES spectra of Zn precipitates, (b) comparison with background Zn (blue), (c) position of Zn hot spot 1 indicated by an arrow, (d) Au distribution of the gold mesh.

Figure S-6 Group c: (a) Zn K-edge XANES spectra showing the background Zn, (b) position of Zn spot 1 indicated by an arrow, and Zn intensity on a normal scale (right) showing the essential absence of Zn, (c) position of Zn spot 2 indicated by an arrow, (d) Au distribution of the gold grid.
Figures and Tables
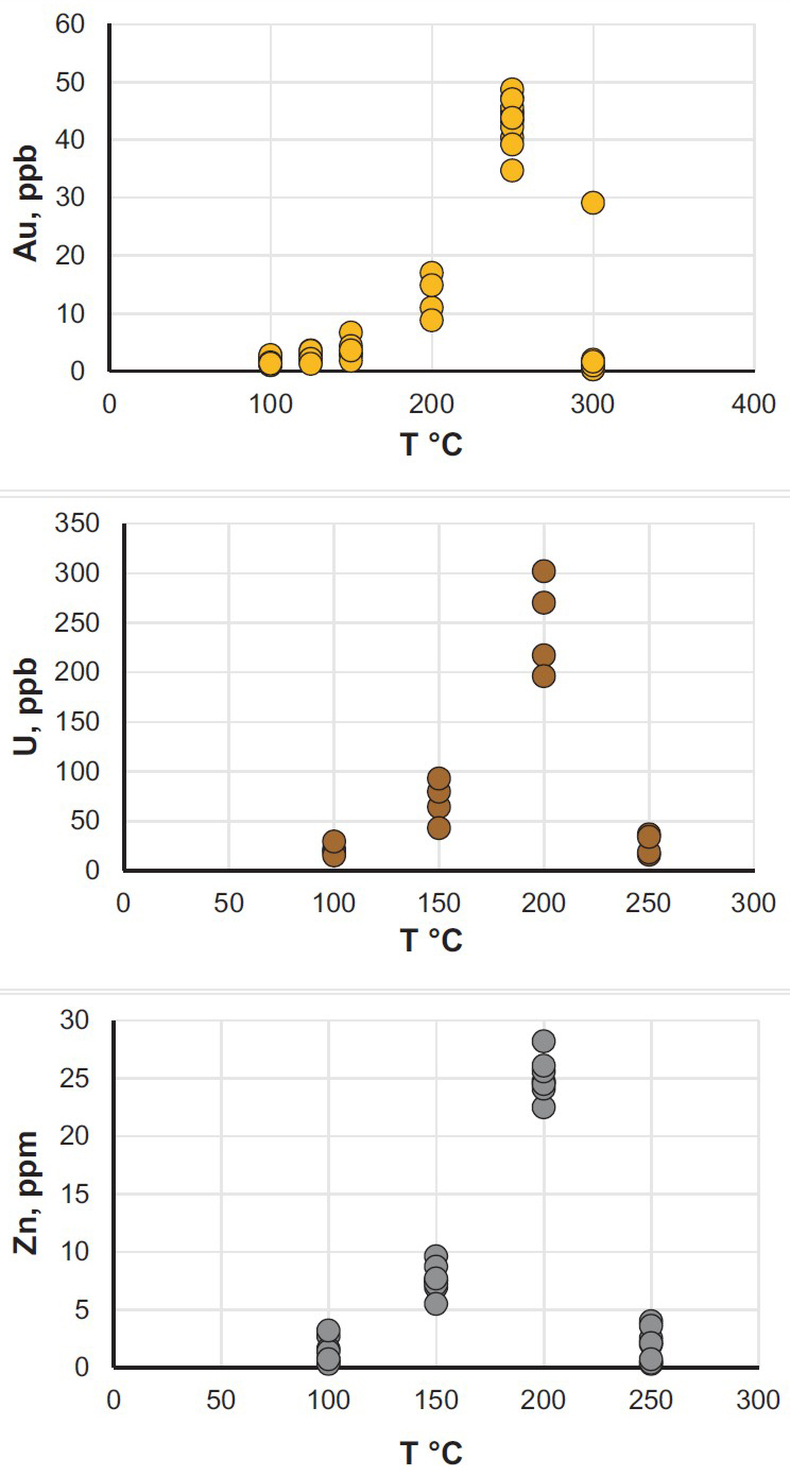
Figure 1 Solubility of metallic gold, zinc, and uranium oxide determined in a variety of crude oils during isothermal solubility experiments.
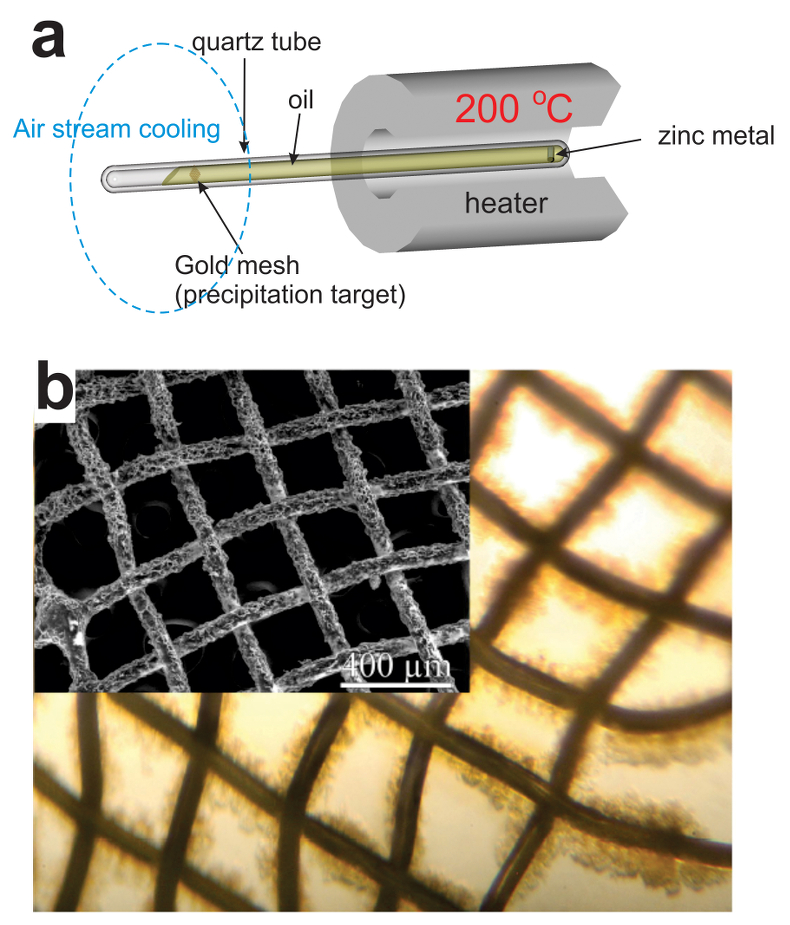
Figure 2 (a) A sketch of the experimental setup for qualitative determination of the ability of natural oils to transport metals at elevated temperatures. (b) A photo and a back scattered electron image of the precipitate discovered at the precipitation target in the experiments with Zn.
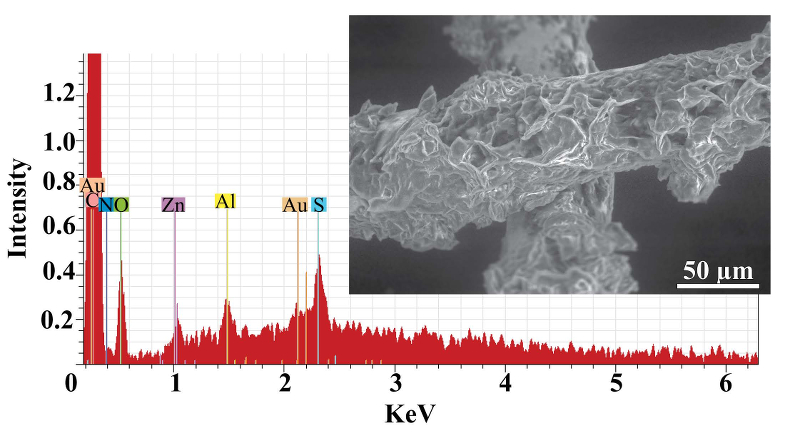
Figure 3 Results of an energy dispersive spectroscopic (EDS) analysis of precipitates obtained from the transport experiments with Zn.
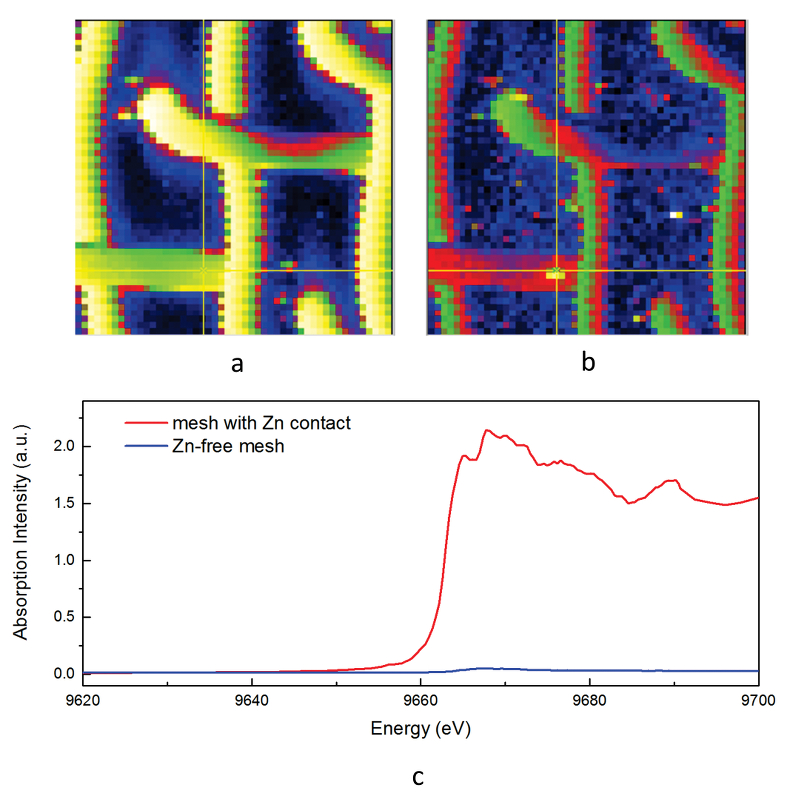
Figure 4 Synchrotron-based micro X-ray fluorescence (XRF) elemental maps showing the spatial distributions of (a) Au and (b) Zn, on a logarithmic scale of intensity (hot colours indicate higher intensity); Zn K edge X-ray absorption near edge structure (XANES) spectra (c) of Zn-bearing and Zn-free samples (the spectrum of the former was taken from the marker in (b)).
Back to article
Supplementary Figures and Tables
Table S-1 Natural crude oils used in the experiments.
| Oils | Location | API (60 ˚F) | S (wt. %) | N (ppm) | Zn (ppb) | Au (ppb) | U (ppb) | Ni (ppb) | V (ppb) |
| OMC 3178 | Gabon | 38.1 | 0.01 | 763 | 1061 ± 32 | 2.39 ± 0.55 | < 0.0001 | 14733 ± 263 | 168 ± 2.70 |
| OMC 6965 | Turkey | N/A | N/A | N/A | 161 ± 91 | 1.52 ± 0.19 | < 0.0001 | 10547 ± 424 | 13137 ± 210 |
| OMC 7223 | UK | 33.1 | 0.49 | 1042 | 132 ± 43 | 1.00 ± 0.07 | < 0.0001 | 1101 ± 15.9 | 1570 ± 7.45 |
| OMC 13583 | Oman | 41.8 | 0.32 | 321 | 525 ± 136 | 0.88 ± 0.11 | < 0.0001 | 902 ± 33.9 | 374 ± 10.3 |
| OMC 14501 | Oman | 28.8 | 2.48 | 1471 | 196 ± 120 | 0.64 ± 0.01 | < 0.0001 | 3997 ± 67.0 | 3661 ± 33.1 |
| Shell #1 | N/A | 28.1 | 3.24 | 52.1 | < 0.1 | 2.34 ± 0.18 | 0.012 ± 0.004 | 3.33 ± 0.009 | 0.44 ± 0.09 |
| Shell #2 | N/A | 39.5 | 0.13 | 109 | < 0.1 | 0.29 ± 0.11 | 0.011 ± 0.014 | 4.97 ± 1.19 | 84.2 ± 12.2 |
| Statoil #1 | N/A | 50.6 | 0.12 | 180 | 246 ± 25 | 0.17 ± 0.01 | 0.032 ± 0.005 | 85.0 ± 4.27 | 358 ± 11.8 |
| Statoil #2 | N/A | 25.4 | 0.52 | 870 | 5977 ± 374 | < 0.01 | 0.037 ± 0.001 | 2069 ± 67.1 | 8811 ± 189 |
| Statoil #3 | N/A | 29.6 | 0.3 | 500 | 240 ± 6.64 | < 0.01 | 0.035 ± 0.001 | 897 ± 3.59 | 234 ± 11.2 |
| Statoil #4 | N/A | 35.9 | 0.14 | 540 | 296 ± 125 | < 0.01 | 0.021 ± 0.004 | 988 ± 3.69 | 616 ± 5.46 |

Figure S-1 A sketch of the experimental setup to determine the solubility in natural oils used in experiments with (a) Au and Zn and (b) uranium oxide.
Table S-2 Solubility of metallic gold (±5 %).
| Sample | T (°C) | Au (ppb) |
| Shell#1 | 100 | 2.63 |
| Shell#1 | 100 | 1.83 |
| Shell#2 | 100 | 2.53 |
| Shell#2 | 100 | 1.83 |
| Shell#2 | 100 | 2.77 |
| Statoil #1 | 100 | 1.03 |
| Statoil #4 | 100 | 1.5 |
| Statoil #2 | 100 | 1.1 |
| Statoil #3 | 100 | 1.33 |
| Shell#1 | 125 | 1.47 |
| Shell#1 | 125 | 3.6 |
| Shell#1 | 125 | 2.37 |
| Shell#2 | 125 | 1.87 |
| Shell#2 | 125 | 3.17 |
| Shell#2 | 125 | 2.73 |
| OMC 13583 | 125 | 3.5 |
| Shell#1 | 125 | 2.1 |
| Shell#2 | 125 | 1.27 |
| Shell#2 | 150 | 6.67 |
| Shell#1 | 150 | 4.33 |
| Statoil #3 | 150 | 2.97 |
| Statoil #4 | 150 | 2.83 |
| Statoil #2 | 150 | 1.77 |
| Statoil #1 | 150 | 3.6 |
| Shell#2 | 200 | 11 |
| Shell#1 | 200 | 17 |
| Statoil #1 | 200 | 14.87 |
| Statoil #3 | 200 | 8.8 |
| OMC 9956 | 250 | 40.4 |
| OMC 14501 | 250 | 47.27 |
| OMC 6965 | 250 | 44.67 |
| OMC 3178 | 250 | 44.73 |
| OMC 13583 | 250 | 48.7 |
| OMC 7223 | 250 | 45.6 |
| Shell#1 | 250 | 47.03 |
| Shell#2 | 250 | 43.27 |
| Statoil #3 | 250 | 42.2 |
| Statoil #4 | 250 | 34.7 |
| Statoil #2 | 250 | 39.2 |
| Statoil #1 | 250 | 43.8 |
| OMC 14501 | 300 | 1.97 |
| OMC 6965 | 300 | 0.33 |
| OMC 3178 | 300 | 0.6 |
| OMC 13583 | 300 | 29.13 |
| OMC 7223 | 300 | 0.3 |
| Shell#1 | 300 | 1 |
| Shell#2 | 300 | 1.63 |
Table S-3 Solubility of uranium oxide: uraninite/ pitchblende (±3 %).
| Sample | T (°C) | U (ppb) |
| Statoil #2 | 100 | 21.1 |
| Statoil #3 | 100 | 19.2 |
| Statoil #1 | 100 | 15.1 |
| Statoil #4 | 100 | 29.1 |
| Statoil #2 | 150 | 63.9 |
| Statoil #3 | 150 | 42.8 |
| Statoil #1 | 150 | 79.6 |
| Statoil #4 | 150 | 92.9 |
| Statoil #2 | 200 | 302 |
| Statoil #3 | 200 | 217.1 |
| Statoil #4 | 200 | 196 |
| Statoil #2 | 200 | 270 |
| Statoil #2 | 250 | 36.5 |
| Statoil #3 | 250 | 16.1 |
| Statoil #1 | 250 | 18.2 |
| Statoil #4 | 250 | 33.8 |
Table S-4 Solubility of metallic zinc (±5 %).
| Sample | T (°C) | Zn (ppm) |
| OMC 14501 | 100 | 2.7 |
| OMC 6965 | 100 | 0.7 |
| OMC 3178 | 100 | 1.6 |
| OMC 13583 | 100 | 0.3 |
| OMC 7223 | 100 | 1.4 |
| Shell#1 | 100 | 3.2 |
| Shell#2 | 100 | 0.7 |
| OMC 14501 | 150 | 7.5 |
| OMC 6965 | 150 | 6.9 |
| OMC 3178 | 150 | 9.6 |
| OMC 13583 | 150 | 8.7 |
| OMC 7223 | 150 | 7.2 |
| Shell#1 | 150 | 7.7 |
| Shell#2 | 150 | 5.5 |
| OMC 14501 | 200 | 22.5 |
| OMC 6965 | 200 | 24.7 |
| OMC 3178 | 200 | 24.7 |
| OMC 13583 | 200 | 24.1 |
| OMC 7223 | 200 | 24.5 |
| Shell#1 | 200 | 25.6 |
| Shell#2 | 200 | 26.1 |
| OMC 14501 | 250 | 0.3 |
| OMC 6965 | 250 | 4 |
| OMC 3178 | 250 | 3.6 |
| OMC 13583 | 250 | 2 |
| OMC 7223 | 250 | 0.4 |
| Shell#1 | 250 | 2.1 |
| Shell#2 | 250 | 0.7 |
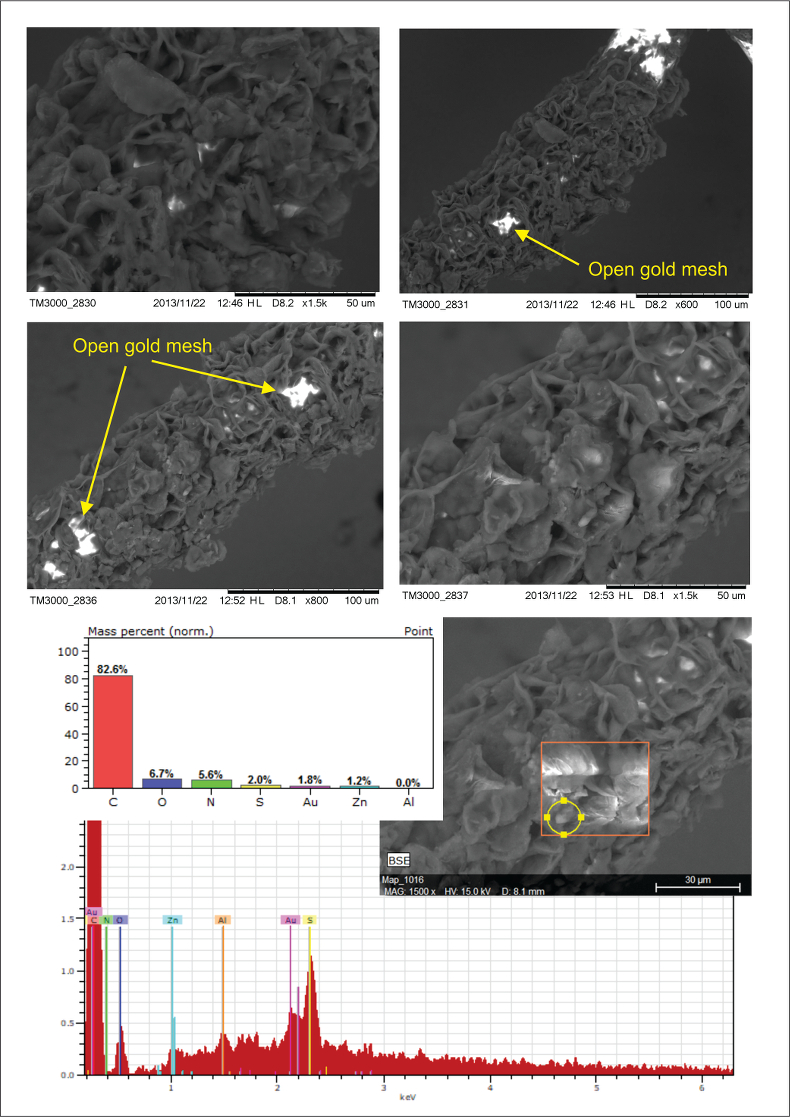
Figure S-2 Examples of back scattered electron images and energy dispersive spectroscopic (EDS) analysis of deposits found on the precipitation targets in non-isothermal experiments.
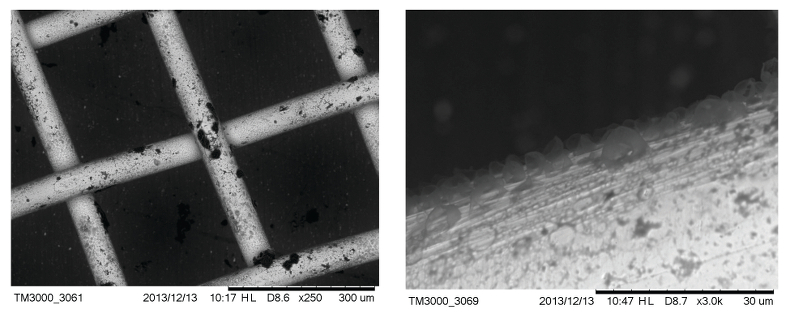
Figure S-3 Examples of back scattered electron images of gold grids from blank experiments (no Zn source).
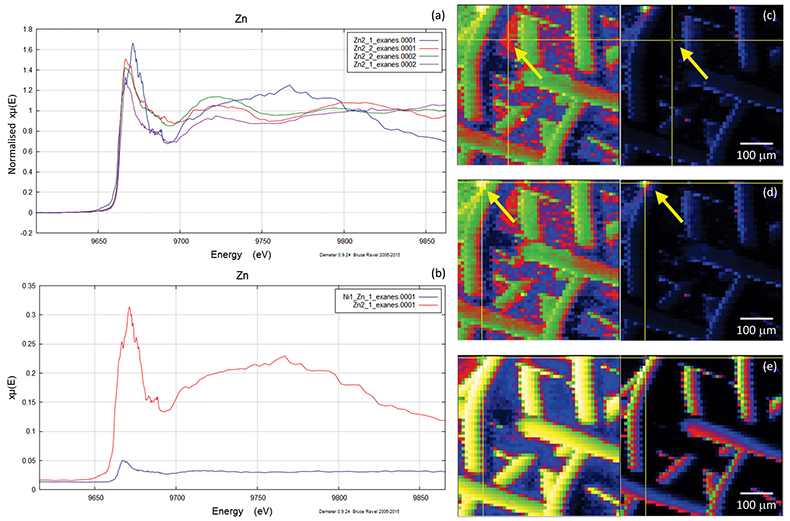
Figure S-4 Group a: (a) Zn K-edge XANES spectra of Zn precipitates, (b) comparison with the background Zn from gold meshes (blue), (c) position of Zn hot spot 1 indicated by an arrow (the left map is plotted on a log scale and the right map on a normal scale; the following maps are plotted in the same manner), (d) position of Zn hot spot 2 indicated by an arrow, (e) Au distribution of the gold mesh.
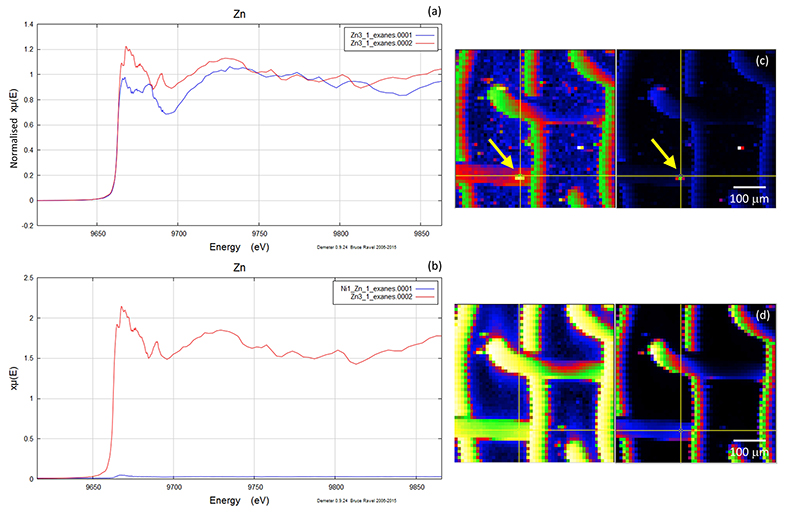
Figure S-5 Group b: (a) Zn K-edge XANES spectra of Zn precipitates, (b) comparison with background Zn (blue), (c) position of Zn hot spot 1 indicated by an arrow, (d) Au distribution of the gold mesh.
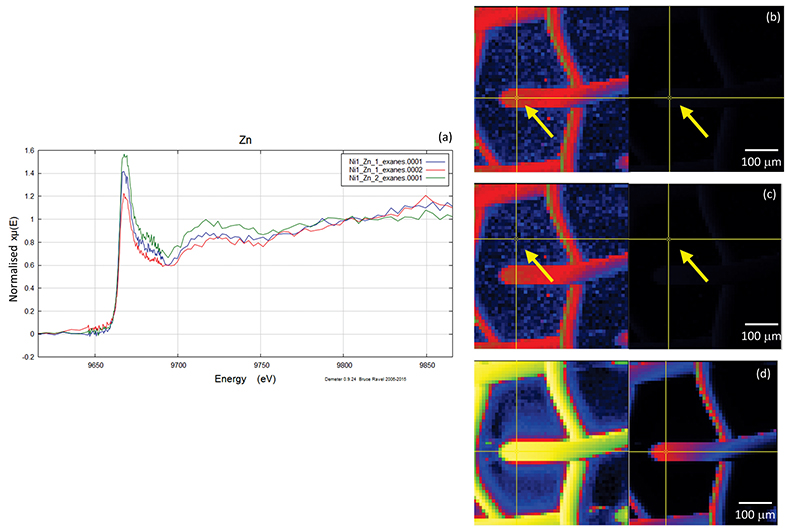
Figure S-6 Group c: (a) Zn K-edge XANES spectra showing the background Zn, (b) position of Zn spot 1 indicated by an arrow, and Zn intensity on a normal scale (right) showing the essential absence of Zn, (c) position of Zn spot 2 indicated by an arrow, (d) Au distribution of the gold grid.


