A geochemical link between plume head and tail volcanism
Affiliations | Corresponding Author | Cite as | Funding informationKeywords: mantle plume, continental flood basalt, Deccan Traps, Reunion, isotope geochemistry, geodynamics
- Share this article


Article views:5,880Cumulative count of HTML views and PDF downloads.
- Download Citation
- Rights & Permissions
top
Abstract
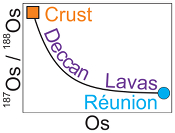
Figures and Tables
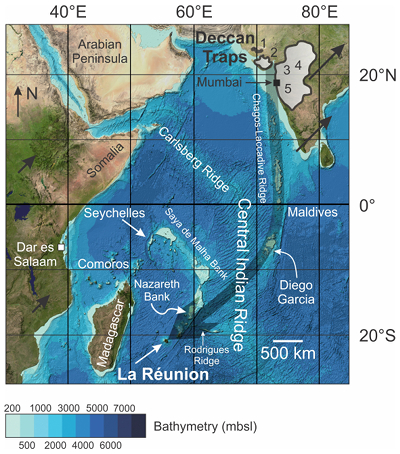 Figure 1 Satellite bathymetry map of the western Indian Ocean basin. Approximate aerial extent of Deccan Traps lava flows are shown by the gray fields on the Indian subcontinent. Numbers in the shaded region correspond to sampling regions: 1 – Kutch (samples 1-5), 2 – Saurashtra (samples 6-46), 3 – Pavagadh, Kalsubai, Amba Dongar and surrounds (samples 48-54, 63-78), 4 – Dhule and surrounds (samples 55-62), 5 – Mumbai, Western Ghats and coastal Maharashtra (samples 79-115, MMF7). Approximate trace of the Réunion hotspot is shown by the transparent black arrow, approximate plate motion vectors are shown by solid black arrows over land areas and are proportional to plate motions. Base map reproduced from the GEBCO world map 2014, www.gebco.net. | 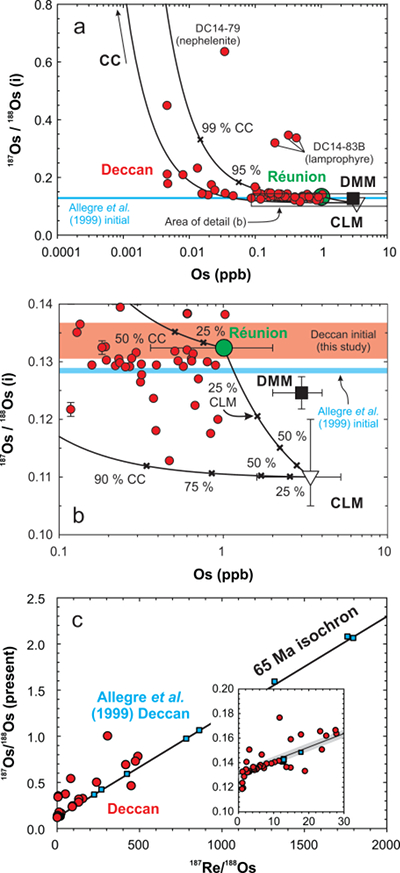 Figure 2 (a) 187Os/188Os versus [Os] for Deccan lavas (red circles), with inferred compositions of the Réunion primary magma (green circle) (Peters et al., 2016), crust (CC: continental crust) and lithosphere (DMM: depleted mid-ocean ridge basalt mantle, CLM: continental lithospheric mantle) and mixing lines. Initial 187Os/188Os reported in literature data (Allegre et al., 1999) shown as blue. (b) Small scale view of (a) showing end member compositions and uncertainties with initial 187Os/188Os calculated in this study (transparent red box with range indicated by bidirectional arrow) and in Allegre et al. (1999) (blue box with outline). (c) Rhenium-osmium isotopes for Deccan lavas in this study (red circles) and from Allegre et al. (1999) (blue squares), with inset for low Re samples. For reference, a 65 Ma isochron with initial 187Os/188Os = 0.1336 ± 0.0031, as determined from our samples, is shown. Uncertainty on the isochron is thinner than line thickness in panel (c) and is represented by the shaded region in the inset. A 65 Ma isochron corresponding to the initial 187Os/188Os determined by Allegre et al. (1999) is approximately equivalent to a line following the lower bound of the shaded region, given the precision noted in that study. Model end members are given in Table S-4. | 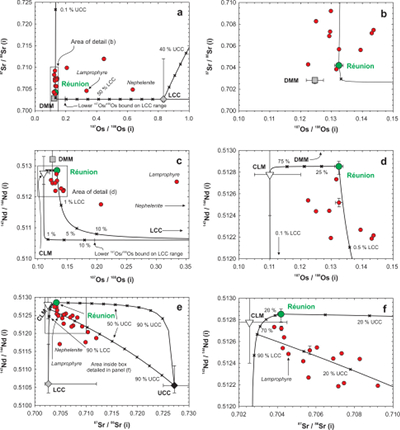 Figure 3 (a,b) Strontium-osmium, (c,d) Nd-Os and (e,f) Sr-Nd isotopic variations for Deccan basalts plotted with a Réunion end member, crustal (LCC: lower continental crust, UCC: upper continental crust) and lithospheric assimilants as in Figure 2. Small ‘x’ marks denote 10 % mass intervals of mixing unless otherwise marked. In (e,f), a secondary mixing curve between a 20 % Réunion-80 % lower continental crust end member and an upper continental crust end member is shown to illustrate the effects of two stage crustal assimilation. For clarity, not all possible mixing arrays or end member compositions are shown in every panel. Model end members are given in Table S-4. |
| Figure 1 | Figure 2 | Figure 3 |
Supplementary Figures and Tables
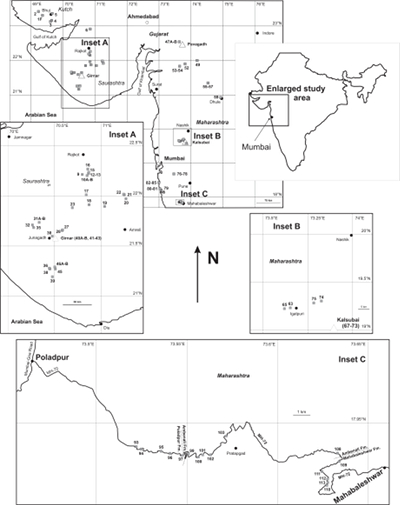 Figure S-1 Map of northwestern India showing sampling locations included expanded views of sample locations with major geographic indicators (roads, mountain tops – Insets A to C). | 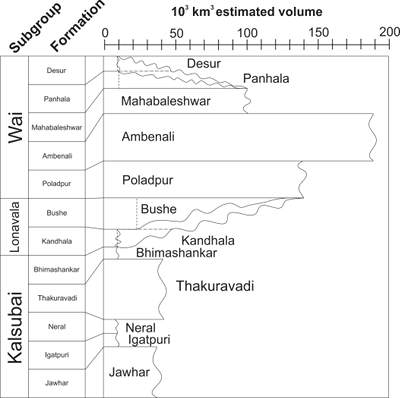 Figure S-2 Chemostratigraphic subgroups and formations of the Deccan Traps volcanic province (Cox and Hawkesworth, 1985) with relative unit thicknesses (Jay and Widdowson, 2008) represented along the vertical axis (total eruptive thickness of ca. 3 km) and relative unit volumes (Richards et al., 2015) along the horizontal axis of the right-most panel. Dashed lines represent minimum volume estimates (DiMuro et al., 2014) and diagonal wavy lines represent range of possible total volumes up to the volume of the next upward formation with a well constrained estimated volume. | 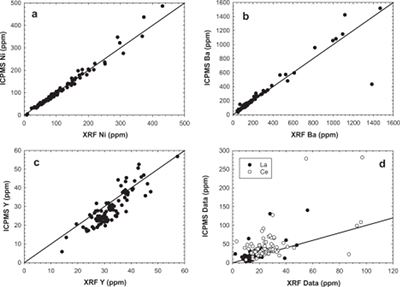 Figure S-3 Comparison of trace element abundances obtained from XRF (x-axis) and ICPMS (y-axis) plotted with unity lines. Elements are selected to represent several types of relationships: (a) Ni, which shows a robust correlation near unity; (b) Ba, which shows a robust relationship slightly offset from unity; (c) Y, which shows a moderately robust relationship offset from unity; and (d) La and Ce, which show a poor relationship offset from unity. Only rare earth elements and U, Th and Pb, the latter three of which are often below detection limits, fall into the last category. We use only the higher precision and accurate ICPMS REE, U, Th and Pb data in our discussion. | 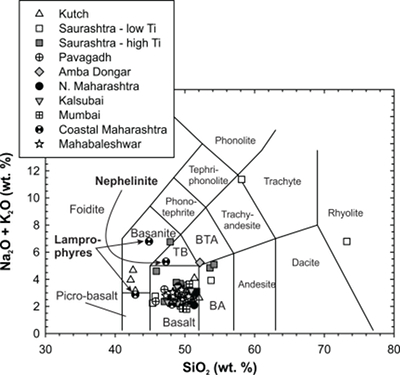 Figure S-4 Total alkali versus silica plot for new bulk rock major element data for Deccan lavas. | 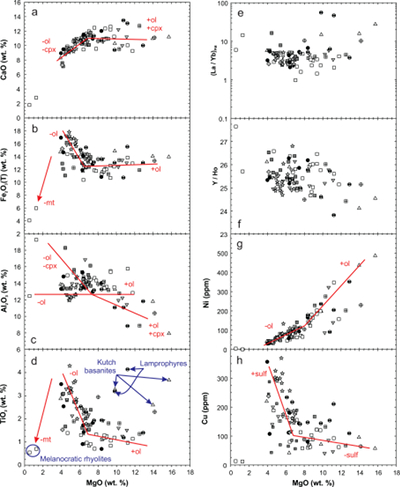 Figure S-5 MgO versus major and minor elements for new whole rock geochemical data with approximate fractionation pathways relative to an assumed melt composition. Symbols as in Figure S-4. |
| Figure S-1 | Figure S-2 | Figure S-3 | Figure S-4 | Figure S-5 |
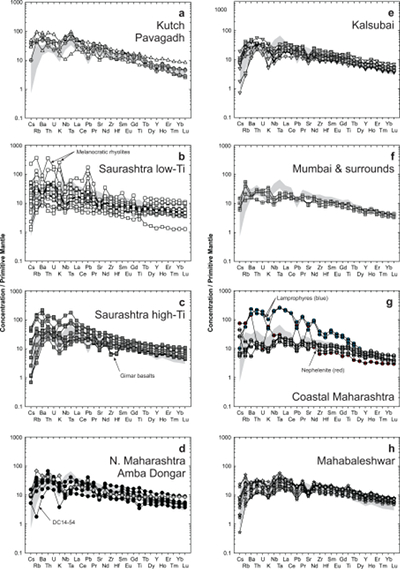 Figure S-6 Trace element variation diagrams for Deccan lavas, normalised to primitive mantle (McDonough and Sun, 1995). Gray field represent range of Réunion lava compositions (Table S-3; Peters et al., 2016). Symbols as in Figure S-4. | 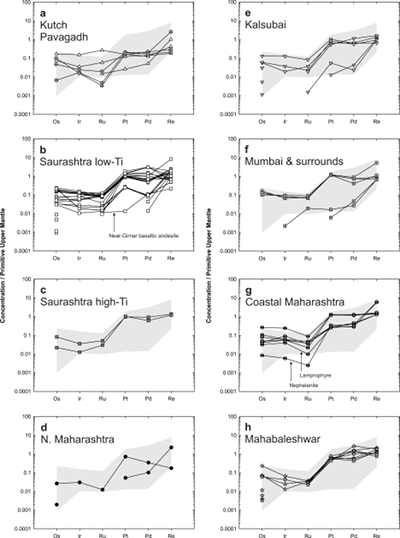 Figure S-7 Primitive upper mantle (PUM) (Becker et al., 2006) normalised highly siderophile element patterns for Deccan lavas. Range of compositions for Saurashtra low Ti basalts (b) shown as gray region in other panels. Nearly all samples show evidence for sulphide fractionation of HSE evidenced by elevated (Pt + Pd + Re) / (Os + Ir + Ru), as evidenced by Figure S-10. Symbols as in Figure S-4. | 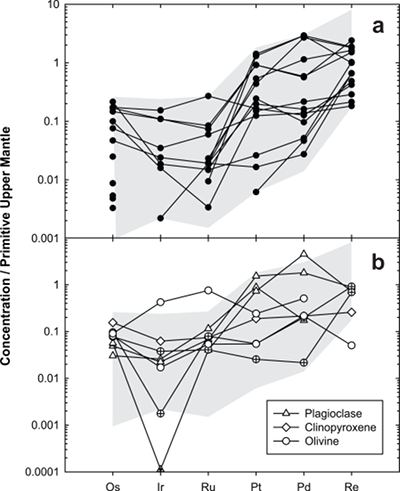 Figure S-8 (a) PUM-normalised (Becker et al., 2006) HSE patterns for host lavas and (b) mineral separates. Crossed symbols in (b) are recycled powders from crushing in a WC crusher. Gray fields represent range of all measured Deccan samples. | 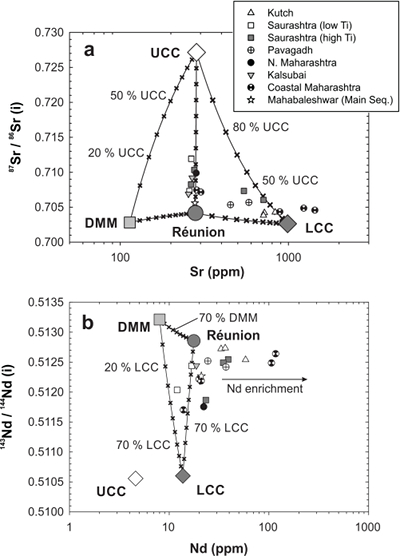 Figure S-9 (a) Plots of 87Sr/86Sr versus Sr abundance and (b) 143Nd/144Nd versus Nd abundance. Similar to Figure 2a and Figure 3, inferred compositions of Réunion primary magmas are shown by dark circles. Mantle and crustal reservoirs that may act as assimilants to ascending Deccan primary magmas are shown by other large symbols. Small x symbols demarcate 10 % intervals of mixing. In (b), a number of alkalic and ultra-alkalic rocks show enrichment in Nd that moves them away from the Réunion-LCC join; no known crustal or upper mantle reservoir has Nd greater than about 20 ppm. Data sources are listed in Table S-4. | 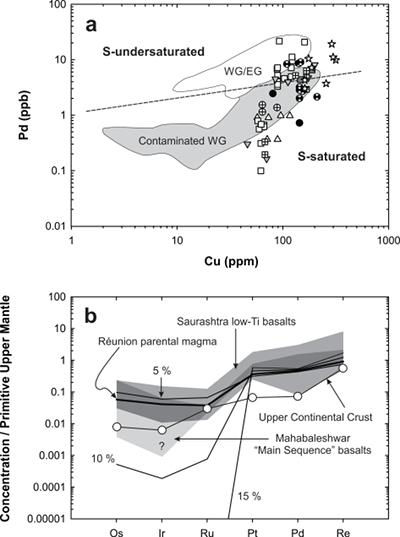 Figure S-10 (a) Plot of Pd versus Cu to discriminate S-undersaturated and S-saturated lavas (Keays and Lightfoot, 2007). Although many Deccan lava samples lie above the qualitative line denoting the boundary between the S-saturated and S-undersaturated fields, most overlap the field of S-saturated (“contaminated”) West Greenland (WG) lavas (Keays and Lightfoot, 2007) which we take to imply that these lavas are also S-saturated. WG/EG: S-undersaturated (“uncontaminated) West and East Greenland lavas (Keays and Lightfoot, 2007). Symbols as in Figure S-4. (b) Assimilation-fractional crystallisation model for a hypothesised Deccan parental magma, equal to the calculated Réunion parental HSE composition of Peters et al. (2016), using partition coefficients of Jamais et al. (2008) and Day (2013) and an upper continental crust HSE composition of Peucker-Ehrenbrink and Jahn (2001). Shown for comparison are composition ranges of Mahabaleshwar main sequence basalts (light gray), Saurashtra low Ti basalts (medium gray) and the field in which these ranges overlap (dark gray). Question mark denotes unknown minimum Ir composition after several analyses for which measured Ir contents were less than the Ir contents of associated total analytical blanks. |
| Figure S-6 | Figure S-7 | Figure S-8 | Figure S-9 | Figure S-10 |
 Table S-1 Unspiked Sr-Nd digestion and column procedure. |  Table S-2 Tabulated HSE blank concentrations and percent blank contributions to samples. |  Table S-3 Geochemical and isotopic data (Table S-3 is available for download as an Excel file below). |  Table S-4 Modelling parameters. |  Table S-5 Data used for initial 187Os/188Os calculation filtered from Table S-3 (second tab in the Excel version of Table S-5, available for download below). |
| Table S-1 | Table S-2 | Table S-3 | Table S-4 | Table S-5 |
top
Letter
The origins of terrestrial intraplate “hotspot” volcanism remain controversial. One common model suggests that hotspots are derived from thermo-chemically buoyant mantle plumes that rise from the deep mantle, initiating short-lived, high volume ‘flood basalt’ volcanism that likely had collateral tectonic and environmental consequences (Richards et al., 1989
Richards, M.A., Duncan R.A., Courtillot, V.E. (1989) Flood basalts and hot-spot tracks: Plume heads and tails. Science 246, 103–107.
; Hill, 1991Hill, R.I. (1991) Starting plumes and continental break-up. Earth and Planetary Science Letters 104, 398–416.
; Self et al., 2008Self, S., Blake, S., Sharma, K., Widdowson M., Sephton, S. (2008) Sulfur and chlorine in late Cretaceous Deccan magmas and eruptive gas release. Science 319, 1654–1657.
). Other models posit that hotspot magmatism is initiated by shallow melting in response to tectonic processes (e.g., Foulger et al., 2015Foulger, G.R., Christiansen, R.L., Anderson, D.L. (2015) The Yellowstone ‘hot spot’ track results from migrating Basin Range extension. In: Foulger, G.R., Lustrino, M., King, S.D. (Eds.) The interdisciplinary Earth: A volume in honor of Don L. Anderson. Special Papers (Geological Society of America). No. 514. Geological Society of America, Boulder, CO, 215–238.
). Three arguments currently favour a plume origin for intraplate magmatism. First, the formation of a continuous, age-progressive and roughly linear volcanic track independent of plate tectonic activity likely requires an active mantle source, such as a plume. Second, seismic tomography suggests deep, low-shear-velocity upwelling beneath some intraplate volcanic centres (French and Romanowicz, 2015French, S.W, Romanowicz, B. (2015) Broad plumes rooted at the base of the Earth’s mantle beneath major hotspots. Nature 525, 95–99.
). Third, the isotopic signatures of many modern hotspots are distinct from those of the mantle underlying continents and mid-ocean ridges and remain relatively consistent through time, suggesting that they have isolated, deep mantle source reservoirs that continually replenish shallow magma reservoirs (Hofmann, 1997Hofmann, A.W. (1997) Mantle geochemistry: the message from oceanic volcanism. Nature 385, 219.
).One of the best studied examples of plume head and tail relationships along a linear, age-progressive volcanic track is the Deccan-Réunion hotspot. There, a volumetrically massive continental flood basalt (CFB) province, the Deccan Traps, is linked by aseismic, submarine ridges to ocean island basalts (OIB) that actively erupt on the island of La Réunion (Fig. 1). A genetic link between Deccan CFB and Réunion OIB, and for other similar hotspot tracks, has often been implicitly assumed by mantle plume theory and is demanded by recent geodynamical models (Glišović and Forte, 2017
Glišović, P., Forte, A.M. (2017) On the deep-mantle origin of the Deccan Traps. Science 355, 613–616.
). Such assumptions, however, are at odds with expected physical consequences of ancient mantle plumes; for example, modern heat flow measurements do not record increased thermal output beneath the Deccan Traps, where an ancient mantle plume might be expected to have thinned the continental crust and lithosphere and increased heat transfer from the mantle to the surface (Roy and Rao, 2000Roy, S., Rao, R.U.M. (2000) Heat flow in the Indian shield. Journal of Geophysical Research 105, 25587–25604.
).
Figure 1 Satellite bathymetry map of the western Indian Ocean basin. Approximate aerial extent of Deccan Traps lava flows are shown by the gray fields on the Indian subcontinent. Numbers in the shaded region correspond to sampling regions: 1 – Kutch (samples 1-5), 2 – Saurashtra (samples 6-46), 3 – Pavagadh, Kalsubai, Amba Dongar and surrounds (samples 48-54, 63-78), 4 – Dhule and surrounds (samples 55-62), 5 – Mumbai, Western Ghats and coastal Maharashtra (samples 79-115, MMF7). Approximate trace of the Réunion hotspot is shown by the transparent black arrow, approximate plate motion vectors are shown by solid black arrows over land areas and are proportional to plate motions. Base map reproduced from the GEBCO world map 2014, www.gebco.net.
In cases like these, geochemistry is a potentially diagnostic tool for linking CFB and OIB magmatism. If flood basalts and later ‘plume tail’ magmas are found to originate from compositionally distinct sources, it would provide no definitive evidence for a long lived mantle plume; however, if they share a common geochemical source that is distinct from the modern accessible mantle, then the persistence of such signatures in the mantle would strongly implicate the existence of a mantle plume. Decades of geochemical research utilising lithophile isotope systems have resulted in dubious associations between plume heads and tails. For example, Sr-Nd isotopic compositions of Deccan basalts deflect away from a Réunion end member (e.g., Fig. 2 of Peng et al., 1994
Peng, Z.X., Mahoney, J., Hooper, P., Harris, C., Beane, J. (1994) A role for lower continental crust in flood basalt genesis? Isotopic and incompatible element study of the lower six formation of the western Deccan Traps. Geochimica et Cosmochimica Acta 58, 267–288.
), which may be a consequence of extensive assimilation of lithospheric or crustal material into CFB magmas. This effect has also been observed for other hotspot systems (Gibson et al., 1995Gibson, S.A., Thompson, R.N., Dickin, A.P., Leonardos, O.H. (1995) High-Ti and low-Ti mafic potassic magmas: Key to plume-lithosphere interactions and continental flood-basalt genesis. Earth and Planetary Science Letters 136, 149–165.
; Peate, 1997Peate, D.W. (1997) The Paraná-Etendeka Province. In: Mahoney, J.J., Coffin, M.F. (Eds.) Large igneous provinces: Continental, oceanic, and planetary flood volcanism. Geophysical Monograph 100. American Geophysical Union, Washington, D.C., 217–245.
; Dale et al. 2009Dale, C.W., Pearson, D.G., Starkey, N.A., Stuart, F.M., Ellam, R.M., Larsen, L.M., Fitton, J.G., Macpherson, C.G. (2009) Osmium isotopes in Baffin Island and West Greenland picrites: Implications for the 187Os/188Os composition of the convecting mantle and the nature of high 3He/4He mantle. Earth and Planetary Science Letters 278, 267–277.
; Day, 2016Day, J.M.D. (2016) Evidence against an ancient non-chondritic mantle source for North Atlantic Igneous Province lavas. Chemical Geology 440, 91–100.
), meaning that it may be an inevitable consequence of magma ascent through lithosphere and crust, effectively masking primary magmatic signatures.The siderophile 187Re-187Os isotope system (t1/2 ≈ 42 Gyr) (Shirey and Walker, 1998
Shirey S.B., Walker, R.J. (1998) The Re–Os isotope system in cosmochemistry and high-temperature geochemistry. Annual Review of Earth and Planetary Sciences 26, 423–500.
) provides an opportunity to resolve a geochemical link between plume head and tail volcanism. Rhenium is relatively incompatible while Os is highly compatible, leading to high Re/Os and long term radiogenic 187Os/188Os signatures in crust (>1; Peucker-Ehrenbrink and Jahn, 2001Peucker-Ehrenbrink, B., Jahn, B.-M. (2001) Rhenium-osmium isotope systematics and platinum-group element concentrations: loess and the upper continental crust: Geochemistry, Geophysics, Geosystems 2, doi: 10.1029/2001GC000172.
), while the primitive mantle preserves lower Re/Os and less radiogenic 187Os/188Os signatures (~0.1296) relative to chondrites (0.126–0.128; Meisel et al., 1996Meisel, T., Walker, R.J., Morgan, J.W. (1996) The osmium isotopic composition of the Earth’s primitive upper mantle. Nature 383, 517–520.
; Day et al., 2016Day, J.M.D., Brandon, A.D., Walker, R.J. (2016) Highly siderophile elements in Earth, Mars, the Moon, and asteroids. Reviews in Mineralogy and Geochemistry 81, 161–238.
). In contrast, long lived lithophile isotope systems (e.g., Rb-Sr, Sm-Nd, Lu-Hf, U/Th-Pb) involve exclusively incompatible elements that are enriched in lithospheric melts and crustal materials relative to mantle-derived magmas. This explains why the Sr-Nd-Pb isotopic characteristics of flood basalts can be dominated by contributions from lithospheric melt and partially melted crust (e.g., Peng et al., 1994Peng, Z.X., Mahoney, J., Hooper, P., Harris, C., Beane, J. (1994) A role for lower continental crust in flood basalt genesis? Isotopic and incompatible element study of the lower six formation of the western Deccan Traps. Geochimica et Cosmochimica Acta 58, 267–288.
; Gibson et al., 1995Gibson, S.A., Thompson, R.N., Dickin, A.P., Leonardos, O.H. (1995) High-Ti and low-Ti mafic potassic magmas: Key to plume-lithosphere interactions and continental flood-basalt genesis. Earth and Planetary Science Letters 136, 149–165.
). Mantle Os isotopic signatures, however, may persist through variable extents of differentiation or assimilation of lithosphere or crust, making 187Os/188Os a diagnostic tool for examining geochemical links between plume head and tail magmatism. Notwithstanding, previous examination of the 187Os/188Os composition of Deccan CFB lavas (Allegre et al., 1999Allegre, C.J., Birck, J.L., Campas, F., Courtillot, V. (1999) Age of the Deccan traps using 187Re-187Os systematics. Earth and Planetary Science Letters 170, 197–204.
) indicated a near-chondritic initial composition (reported as 0.12843 ± 0.00047). This result is irreconcilable with the highly consistent and more radiogenic 187Os/188Os signature of Réunion igneous rocks (Schiano et al., 2012Schiano, P., David, K., Vlastelic, I., Gannoun, A., Klein, M., Nauret F., Bonnand, P. (2012) Osmium isotope systematics of historical lavas from Piton de la Fournaise (Réunion Island, Indian Ocean). Contributions to Mineralogy and Petrology 164, 805–820.
; Peters et al., 2016Peters, B.J., Day, J.M.D., Taylor, L.A. (2016) Early mantle heterogeneities in the Réunion hotspot source inferred from highly siderophile elements in cumulate xenoliths. Earth and Planetary Science Letters 448, 150–160.
) (0.1324 ± 0.0014; Fig. 2a), suggesting that there is not a geochemical link in the Deccan-Réunion system and fundamentally challenging physical models of plume head and tail magmatism. Here, we re-evaluate this important relationship using new Sr-Nd-Os isotope data for Deccan Traps lavas.Many early surveys of the Deccan Traps focused primarily on the relationship between mantle sources of Deccan lavas and depleted upper mantle domains since relatively high concentrations of Sr and Nd in Indian continental crust likely obscured isotopic signatures of deep sources (e.g., Peng et al., 1994
Peng, Z.X., Mahoney, J., Hooper, P., Harris, C., Beane, J. (1994) A role for lower continental crust in flood basalt genesis? Isotopic and incompatible element study of the lower six formation of the western Deccan Traps. Geochimica et Cosmochimica Acta 58, 267–288.
). We examined >60 samples of Deccan CFB and related rocks that represent a broad stratigraphic and compositional range (MgO = 0.5–15.7 wt. %; Supplementary Information). Most of the high MgO samples are dykes and flows from the northwestern regions of Saurashtra and Kutch, however such geochemically primitive samples are also found in samples from in and around Mumbai and in the Pavagadh volcanic complex. In contrast, high Ti (TiO2 > 1.5 wt. %) samples from Saurashtra and samples from the Deccan “main sequence” near Mahabaleshwar tend to have more evolved compositions (MgO commonly <8 wt. %). Age-corrected 187Os/188Os ratios for Deccan lavas range from 0.1128 to 0.6713 (Fig. 2a) and span a large range of Os concentrations. No sample has a geochemical composition similar to potassic lavas likely representing small degree partial melts of continental lithospheric mantle (CLM, represented by nephelenite sample DC14-79 and lamprophyre sample DC14-83B). However, several samples display age-corrected 187Os/188Os less than 0.128, strongly implying that some samples experienced interaction with lithospheric materials. Some other samples show crustal 187Os/188Os signatures that may have overprinted their original 187Os/188Os compositions. In contrast, the most primitive samples have Os concentrations lower than the average depleted mantle. The majority of the measured samples preserve a 187Os/188Os signature very close to that of Réunion (Fig. 2a).While a previous study of Os isotopes in the Deccan Traps claimed isochronous behaviour (Allegre et al., 1999
Allegre, C.J., Birck, J.L., Campas, F., Courtillot, V. (1999) Age of the Deccan traps using 187Re-187Os systematics. Earth and Planetary Science Letters 170, 197–204.
), our samples do not show a statistically significant isochron (MSWD > 102) and do not support a near-chondritic initial 187Os/188Os (Fig. 2b). This is likely due to regional variations in magma differentiation and assimilation of lithospheric and crustal materials, meaning that careful filtering of samples is required to identify samples that are strongly affected by these processes. We exclude samples that may have experienced significant fractional crystallisation (MgO < 6 wt. % or >14 wt. %; e.g., Fig. S-6) and altered samples with LOI > 2.5 %, extreme Re/Os (>100) or 187Os/188Os (<0.125 or >1) compositions (Table S-5), which would imply extensive fractional crystallisation or lithospheric/crustal assimilation. The choice of filter ranges has a direct impact on the calculated 187Os/188Os and its precision, but our rejection criteria are relatively inclusive. A York-type regression of our filtered data yields an isochron initial 187Os/188Os of 0.1336 ± 0.0031 (n = 21), identical, within uncertainties, to the Réunion end member (0.1324 ± 0.0014) (Peters et al., 2016Peters, B.J., Day, J.M.D., Taylor, L.A. (2016) Early mantle heterogeneities in the Réunion hotspot source inferred from highly siderophile elements in cumulate xenoliths. Earth and Planetary Science Letters 448, 150–160.
).
Figure 2 (a) 187Os/188Os versus [Os] for Deccan lavas (red circles), with inferred compositions of the Réunion primary magma (green circle) (Peters et al., 2016
Peters, B.J., Day, J.M.D., Taylor, L.A. (2016) Early mantle heterogeneities in the Réunion hotspot source inferred from highly siderophile elements in cumulate xenoliths. Earth and Planetary Science Letters 448, 150–160.
), crust (CC: continental crust) and lithosphere (DMM: depleted mid-ocean ridge basalt mantle, CLM: continental lithospheric mantle) and mixing lines. Initial 187Os/188Os reported in literature data (Allegre et al., 1999Allegre, C.J., Birck, J.L., Campas, F., Courtillot, V. (1999) Age of the Deccan traps using 187Re-187Os systematics. Earth and Planetary Science Letters 170, 197–204.
) shown as blue. (b) Small scale view of (a) showing end member compositions and uncertainties with initial 187Os/188Os calculated in this study (transparent red box with range indicated by bidirectional arrow) and in Allegre et al. (1999)Allegre, C.J., Birck, J.L., Campas, F., Courtillot, V. (1999) Age of the Deccan traps using 187Re-187Os systematics. Earth and Planetary Science Letters 170, 197–204.
(blue box with outline). (c) Rhenium-osmium isotopes for Deccan lavas in this study (red circles) and from Allegre et al. (1999)Allegre, C.J., Birck, J.L., Campas, F., Courtillot, V. (1999) Age of the Deccan traps using 187Re-187Os systematics. Earth and Planetary Science Letters 170, 197–204.
(blue squares), with inset for low Re samples. For reference, a 65 Ma isochron with initial 187Os/188Os = 0.1336 ± 0.0031, as determined from our samples, is shown. Uncertainty on the isochron is thinner than line thickness in panel (c) and is represented by the shaded region in the inset. A 65 Ma isochron corresponding to the initial 187Os/188Os determined by Allegre et al. (1999)Allegre, C.J., Birck, J.L., Campas, F., Courtillot, V. (1999) Age of the Deccan traps using 187Re-187Os systematics. Earth and Planetary Science Letters 170, 197–204.
is approximately equivalent to a line following the lower bound of the shaded region, given the precision noted in that study. Model end members are given in Table S-4.Since Deccan lavas have universally assimilated some amount of continental crust, constructing an isochron requires projecting a best fit line through low 187Re/188Os space, in which there are few data. This characteristic is an unavoidable consequence of working with CFB and results in somewhat limited precision. Regional complexities of crustal assimilation may be overcome by attempting to calculate initial 187Os/188Os for sample groups based on geography, but for our data this does not yield a more precise result. Our 187Re/188Os data range is 1 to 490 (average = 64), while published data range from 13 to 1800 (average = 633). The more limited amount of assimilation experienced by our samples leads us to reject a chondritic Os isotope composition for the Deccan primary magma; instead, our data demonstrate that the initial 187Os/188Os for the Deccan CFB is identical, within uncertainty, to that of Réunion, and distinct from CLM, depleted mantle or the estimate of Allegre et al. (1999)
Allegre, C.J., Birck, J.L., Campas, F., Courtillot, V. (1999) Age of the Deccan traps using 187Re-187Os systematics. Earth and Planetary Science Letters 170, 197–204.
.A persistent Réunion-like Sr-Nd isotope signal is also present in our Deccan samples. Age-corrected 87Sr/86Sr ratios range from 0.70383 to 0.71195 and are negatively correlated with age-corrected 143Nd/144Nd ratios (Fig. 3a), which range from ε143NdCHUR(65 Ma) = -16.6 to +3.6. These results extend to compositions among the most geochemically primitive of published Deccan Sr-Nd isotope data (e.g., Melluso et al., 2006
Melluso, L., Mahoney, J.J., Dallai, L. (2006) Mantle sources and crustal input as recorded in high-Mg Deccan Traps basalts of Gujarat (India). Lithos 89, 259–274.
; Sheth and Melluso, 2008Sheth, H., Melluso, L. (2008) The Mount Pavagadh volcanic suite, Deccan Traps: geochemical stratigraphy and magmatic evolution. Journal of Asian Earth Sciences 32, 5–21.
). Relatively depleted Sr-Nd isotope signatures, with values approaching those of Réunion OIB, are most common in samples from Kutch. These samples also possess incompatible element abundances like those in OIB (Fig. S-6a) and the most primitive highly siderophile element (HSE) patterns (Fig. S-7a). To test the quantitative geochemical relationship between Deccan and Réunion Sr-Nd-Os isotopic signatures, we establish Réunion end members according to Peters et al. (2016)Peters, B.J., Day, J.M.D., Taylor, L.A. (2016) Early mantle heterogeneities in the Réunion hotspot source inferred from highly siderophile elements in cumulate xenoliths. Earth and Planetary Science Letters 448, 150–160.
(Os) and from published Réunion geochemistry data (Sr-Nd; Table S-4). Because the range in isotopic compositions of Réunion OIB is more limited than any other OIB, uncertainty in the end member composition is relatively low. We establish crust end members from published data on regional (Sr-Nd) and global (Os), crustal rocks (Peucat et al., 1989Peucat, J.J., Vidal, P., Bernard-Griffiths J., Condie, K.C. (1989) Sr, Nd, and Pb isotopic systematics in the Archean low- to high-grade transition zone of southern India: syn-accretion vs. post-accretion granulites. Journal of Geology 97, 537–550.
, 2013Peucat, J.-J., Jayananda, M., Chardon, D., Capdevila, R., Fanning, C.M., Paquette, J.-L. (2013) The lower crust of the Dharwar Craton, Southern Indian: Patchwork of Archean granulitic domains. Precambrian Research 227, 4–28.
; Asmerom and Walker, 1998Asmerom, Y., Walker, R.J. (1998) Pb and Os isotopic constraints on the composition and rheology of the lower crust. Geology 26, 359–362.
; Ray et al., 2008Ray, R., Shukla, A.D., Sheth, H.C., Ray, J.S., Duraiswami, R.A., Vanderkluysen, L., Rautela, C.S., Mallik, J. (2008) Highly heterogeneous Precambrian basement under the central Deccan Traps, India: Direct evidence from xenoliths in dykes. Gondwana Research 13, 375–385.
) and mantle lithospheric end members from published global data (Snow and Reisberg, 1995Snow, J.E., Reisberg, L. (1995) Os isotopic systematics of the MORB mantle: results from altered abyssal peridotites: Earth and Planetary Science Letters 133, 411–421.
; McBride et al., 1996McBride, J.S., Lambert, D.D., Greig, A., Nicholls, I.A. (1996) Multistage evolution of Australian subcontinental mantle: Re-Os isotopic constraints from Victorian mantle xenoliths. Geology 24, 631–634.
; Roy-Barman et al., 1998Roy-Barman, M., Wasserburg, G.J., Papanastassiou D.A., Chaussidon, M. (1998) Osmium isotopic compositions and Re-Os concentrations in sulfide globules from basaltic glasses. Earth and Planetary Science Letters 154, 331–347.
; Aulbach et al., 2016Aulbach, S., Mungall, J.E., Pearson, D.G. (2016) Distribution and processing of highly siderophile elements in cratonic mantle lithosphere. Reviews in Mineralogy and Geochemistry 81, 239–304.
). Using these end members, we explain Sr-Nd-Os isotopic co-variations by assimilation of crustal reservoirs into a Réunion-like primary magma (Fig. 3).
Figure 3 (a,b) Strontium-osmium, (c,d) Nd-Os and (e,f) Sr-Nd isotopic variations for Deccan basalts plotted with a Réunion end member, crustal (LCC: lower continental crust, UCC: upper continental crust) and lithospheric assimilants as in Figure 2. Small ‘x’ marks denote 10 % mass intervals of mixing unless otherwise marked. In (e,f), a secondary mixing curve between a 20 % Réunion-80 % lower continental crust end member and an upper continental crust end member is shown to illustrate the effects of two stage crustal assimilation. For clarity, not all possible mixing arrays or end member compositions are shown in every panel. Model end members are given in Table S-4.
Co-variations of Sr and Nd with Os isotopes (Fig. 3a-d) imply a limited role for crustal assimilation because, as revealed by Figure 2a, the mixing relationship is dominated by the strong enrichment of Os in mantle-derived magmas relative to the crust. In contrast, Sr-Nd isotope co-variations (Fig. 3e,f) reveal a much stronger influence of crustal materials because both elements are more abundant in the crust. The cause of scatter in the Sr-Os and Nd-Os isotope arrays relative to the mixing curves in Figure 3 is likely a consequence of several factors. First, Sr, Nd and their respective parent elements are lithophile, while Re and Os are siderophile, meaning that assimilant domains have distinct compositions of each element that may affect each of these arrays differently. For example, some samples in the Nd-Os isotopic array (Fig. 3c,d) may have witnessed assimilation of high REE potassic melts (Gibson et al., 1995
Gibson, S.A., Thompson, R.N., Dickin, A.P., Leonardos, O.H. (1995) High-Ti and low-Ti mafic potassic magmas: Key to plume-lithosphere interactions and continental flood-basalt genesis. Earth and Planetary Science Letters 136, 149–165.
), which may be represented by nephelinite sample DC14-79, causing some scatter to the right of the Réunion-lower continental crust join. Second, the different isotope systems we use may preserve analogous records of the same processes, but regional differences in differentiation processes mean that each individual datum corresponds to a mixing line not explicitly shown on the figures. Finally, the 187Re-187Os system, which is sensitive to sulphide fractionation, may be most sensitive to early melt differentiation, when immiscible sulphide liquids are isolated during olivine fractionation. In contrast, 87Rb-87Sr and 147Sm-143Nd, which are hosted by silicates such as plagioclase and clinopyroxene, may be most sensitive to later differentiation involving these phases. As a result, the data arrays shown in Figure 3a-d may not be as well-represented by simple mixing compared to data in Figure 2a and Figure 3e,f.The negative correlation between age-corrected 87Sr/86Sr and 143Nd/144Nd (Fig. 3e,f) matches a two stage assimilation scenario, in which a Réunion-like parental magma first assimilates a relatively large proportion of lower continental crust (estimated as 50–90 % of the Sr-Nd mass) followed by smaller amounts of upper continental crust (0-50 % by mass). Alternatively, assimilation may be single stage and involve crust with a composition intermediate to our chosen end members. For all combinations of Sr-Nd-Os isotopes, data arrays of Deccan lavas can be explained by a Réunion-like mantle source that has assimilated lower and/or upper continental crust with no required role from lithosphere or a primitive mantle-like source (Meisel et al., 1996
Meisel, T., Walker, R.J., Morgan, J.W. (1996) The osmium isotopic composition of the Earth’s primitive upper mantle. Nature 383, 517–520.
).We also find that measured HSE variations in Deccan basalts can be quantitatively related to a Réunion parental magma (Supplementary Information). Accounting for localised ‘nugget’ effects, differentiation of a Réunion-like parental magma that has undergone sulphide saturation can produce HSE abundances similar to those measured in the most evolved lavas of the Maharashtra “main sequence” and Saurashtra low Ti lavas. These findings do not require contributions from a source similar to the modern Comoros hotspot, as suggested by Glišović and Forte (2017)
Glišović, P., Forte, A.M. (2017) On the deep-mantle origin of the Deccan Traps. Science 355, 613–616.
, however they cannot definitively exclude such contributions. Additional geochemical data for the ancient Comoros hotspot may be needed to evaluate this hypothesis.A geochemical link between canonical plume head and plume tail volcanism demonstrates that mantle plumes and their mantle sources can remain physically resilient through tens of millions of years of Earth’s history. Similar geochemical links may also exist for intraplate volcanism displaying physiographic ties between ‘head’ and ‘tail’ provinces, such as the Iceland or Tristan da Cunha hotspots. These hotspots, as well as the Réunion hotspot, lie above the edge of the African large low-shear-velocity province (LLSVP), which may serve as the lower mantle source to many plumes (Zhao et al., 2015
Zhao, C., Garnero, E.J., McNamara, A.K., Schmerr N., Carlson, R.W. (2015) Seismic evidence for a chemically distinct thermochemical reservoir in Earth’s deep mantle beneath Hawaii. Earth and Planetary Science Letters 426, 143–153.
). If this is the case, the African LLSVP must actively transport material with primordial compositions to Earth’s surface (Peters et al., 2016Peters, B.J., Day, J.M.D., Taylor, L.A. (2016) Early mantle heterogeneities in the Réunion hotspot source inferred from highly siderophile elements in cumulate xenoliths. Earth and Planetary Science Letters 448, 150–160.
). If the LLSVP serves as the source for Réunion primary magmas, this is consistent with the notion that LLSVP’s are not only presently stable (Zhao et al., 2015Zhao, C., Garnero, E.J., McNamara, A.K., Schmerr N., Carlson, R.W. (2015) Seismic evidence for a chemically distinct thermochemical reservoir in Earth’s deep mantle beneath Hawaii. Earth and Planetary Science Letters 426, 143–153.
), but that they have remained stable through at least the Cenozoic. The temporal geochemical homogeneity in the Réunion plume source strongly implies that there are regions of the mantle capable of preserving signatures of their provenance since very early in Earth’s history, remaining exempt from processes that otherwise act to keep the mantle well-mixed.top
Acknowledgements
We acknowledge the support of A. Basu Sarbadhikari in the field effort and H. Sheth for providing sample MMF7. Field work was supported by the National Geographic Society (NGS 8330-07) to JMDD. General support was provided from NSF EAR grants 1116089 and 1447130 to JMDD and the Devendra and Aruna Lal Fellowship to BJP. These sources of funding are gratefully acknowledged. The authors declare no conflicts of interest.
Editor: Helen Williams
top
References
Allegre, C.J., Birck, J.L., Campas, F., Courtillot, V. (1999) Age of the Deccan traps using 187Re-187Os systematics. Earth and Planetary Science Letters 170, 197–204.
 Show in context
 Notwithstanding, previous examination of the 187Os/188Os composition of Deccan CFB lavas (Allegre et al., 1999) indicated a near-chondritic initial composition (reported as 0.12843 ± 0.00047).
View in article
While a previous study of Os isotopes in the Deccan Traps claimed isochronous behaviour (Allegre et al., 1999), our samples do not show a statistically significant isochron (MSWD > 102) and do not support a near-chondritic initial 187Os/188Os (Fig. 2b).
View in article
Figure 2 [...] Initial 187Os/188Os reported in literature data (Allegre et al., 1999) shown as blue. (b) Small scale view of (a) showing end member compositions and uncertainties with initial 187Os/188Os calculated in this study (transparent red box with range indicated by bidirectional arrow) and in Allegre et al. (1999) (blue box with outline). (c) Rhenium-osmium isotopes for Deccan lavas in this study (red circles) and from Allegre et al. (1999) (blue squares), with inset for low Re samples.
View in article
Figure 2 [...] A 65 Ma isochron corresponding to the initial 187Os/188Os determined by Allegre et al. (1999) is approximately equivalent to a line following the lower bound of the shaded region, given the precision noted in that study.
View in article
The more limited amount of assimilation experienced by our samples leads us to reject a chondritic Os isotope composition for the Deccan primary magma; instead, our data demonstrate that the initial 187Os/188Os for the Deccan CFB is identical, within uncertainty, to that of Réunion, and distinct from CLM, depleted mantle or the estimate of Allegre et al. (1999).
View in article
Asmerom, Y., Walker, R.J. (1998) Pb and Os isotopic constraints on the composition and rheology of the lower crust. Geology 26, 359–362.
 Show in context
 We establish crust end members from published data on regional (Sr-Nd) and global (Os), crustal rocks (Peucat et al., 1989, 2013; Asmerom and Walker, 1998; Ray et al., 2008) and mantle lithospheric end members from published global data (Snow and Reisberg, 1995; McBride et al., 1996; Roy-Barman et al., 1998; Aulbach et al., 2016).
View in article
Aulbach, S., Mungall, J.E., Pearson, D.G. (2016) Distribution and processing of highly siderophile elements in cratonic mantle lithosphere. Reviews in Mineralogy and Geochemistry 81, 239–304.
 Show in context
 We establish crust end members from published data on regional (Sr-Nd) and global (Os), crustal rocks (Peucat et al., 1989, 2013; Asmerom and Walker, 1998; Ray et al., 2008) and mantle lithospheric end members from published global data (Snow and Reisberg, 1995; McBride et al., 1996; Roy-Barman et al., 1998; Aulbach et al., 2016).
View in article
Dale, C.W., Pearson, D.G., Starkey, N.A., Stuart, F.M., Ellam, R.M., Larsen, L.M., Fitton, J.G., Macpherson, C.G. (2009) Osmium isotopes in Baffin Island and West Greenland picrites: Implications for the 187Os/188Os composition of the convecting mantle and the nature of high 3He/4He mantle. Earth and Planetary Science Letters 278, 267–277.
 Show in context
 This effect has also been observed for other hotspot systems (Gibson et al., 1995; Peate, 1997; Dale et al. 2009; Day, 2016), meaning that it may be an inevitable consequence of magma ascent through lithosphere and crust, effectively masking primary magmatic signatures.
View in article
Day, J.M.D. (2016) Evidence against an ancient non-chondritic mantle source for North Atlantic Igneous Province lavas. Chemical Geology 440, 91–100.
 Show in context
 This effect has also been observed for other hotspot systems (Gibson et al., 1995; Peate, 1997; Dale et al. 2009; Day, 2016), meaning that it may be an inevitable consequence of magma ascent through lithosphere and crust, effectively masking primary magmatic signatures.
View in article
Day, J.M.D., Brandon, A.D., Walker, R.J. (2016) Highly siderophile elements in Earth, Mars, the Moon, and asteroids. Reviews in Mineralogy and Geochemistry 81, 161–238.
 Show in context
 Rhenium is relatively incompatible while Os is highly compatible, leading to high Re/Os and long term radiogenic 187Os/188Os signatures in crust (>1; Peucker-Ehrenbrink and Jahn, 2001), while the primitive mantle preserves lower Re/Os and less radiogenic 187Os/188Os signatures (~0.1296) relative to chondrites (0.126–0.128; Meisel et al., 1996; Day et al., 2016).
View in article
Foulger, G.R., Christiansen, R.L., Anderson, D.L. (2015) The Yellowstone ‘hot spot’ track results from migrating Basin Range extension. In: Foulger, G.R., Lustrino, M., King, S.D. (Eds.) The interdisciplinary Earth: A volume in honor of Don L. Anderson. Special Papers (Geological Society of America). No. 514. Geological Society of America, Boulder, CO, 215–238.
 Show in context
 Other models posit that hotspot magmatism is initiated by shallow melting in response to tectonic processes (e.g., Foulger et al., 2015).
View in article
French, S.W, Romanowicz, B. (2015) Broad plumes rooted at the base of the Earth’s mantle beneath major hotspots. Nature 525, 95–99.
 Show in context
 Second, seismic tomography suggests deep, low-shear-velocity upwelling beneath some intraplate volcanic centres (French and Romanowicz, 2015).
View in article
Gibson, S.A., Thompson, R.N., Dickin, A.P., Leonardos, O.H. (1995) High-Ti and low-Ti mafic potassic magmas: Key to plume-lithosphere interactions and continental flood-basalt genesis. Earth and Planetary Science Letters 136, 149–165.
 Show in context
 This effect has also been observed for other hotspot systems (Gibson et al., 1995; Peate, 1997; Dale et al. 2009; Day, 2016), meaning that it may be an inevitable consequence of magma ascent through lithosphere and crust, effectively masking primary magmatic signatures.
View in article
This explains why the Sr-Nd-Pb isotopic characteristics of flood basalts can be dominated by contributions from lithospheric melt and partially melted crust (e.g., Peng et al., 1994; Gibson et al., 1995).
View in article
For example, some samples in the Nd-Os isotopic array (Fig. 3c,d) may have witnessed assimilation of high REE potassic melts (Gibson et al., 1995), which may be represented by nephelinite sample DC14-79, causing some scatter to the right of the Réunion-lower continental crust join.
View in article
Glišović, P., Forte, A.M. (2017) On the deep-mantle origin of the Deccan Traps. Science 355, 613–616.
 Show in context
 A genetic link between Deccan CFB and Réunion OIB, and for other similar hotspot tracks, has often been implicitly assumed by mantle plume theory and is demanded by recent geodynamical models (Glišović and Forte, 2017).
View in article
These findings do not require contributions from a source similar to the modern Comoros hotspot, as suggested by Glišović and Forte (2017), however they cannot definitively exclude such contributions.
View in article
Hill, R.I. (1991) Starting plumes and continental break-up. Earth and Planetary Science Letters 104, 398–416.
 Show in context
 One common model suggests that hotspots are derived from thermo-chemically buoyant mantle plumes that rise from the deep mantle, initiating short-lived, high volume ‘flood basalt’ volcanism that likely had collateral tectonic and environmental consequences (Richards et al., 1989; Hill, 1991; Self et al., 2008).
View in article
Hofmann, A.W. (1997) Mantle geochemistry: the message from oceanic volcanism. Nature 385, 219.
 Show in context
 Third, the isotopic signatures of many modern hotspots are distinct from those of the mantle underlying continents and mid-ocean ridges and remain consistent through time, suggesting that they have isolated, deep mantle source reservoirs that continually replenish shallow magma reservoirs (Hofmann, 1997).
View in article
McBride, J.S., Lambert, D.D., Greig, A., Nicholls, I.A. (1996) Multistage evolution of Australian subcontinental mantle: Re-Os isotopic constraints from Victorian mantle xenoliths. Geology 24, 631–634.
 Show in context
 We establish crust end members from published data on regional (Sr-Nd) and global (Os), crustal rocks (Peucat et al., 1989, 2013; Asmerom and Walker, 1998; Ray et al., 2008) and mantle lithospheric end members from published global data (Snow and Reisberg, 1995; McBride et al., 1996; Roy-Barman et al., 1998; Aulbach et al., 2016).
View in article
Meisel, T., Walker, R.J., Morgan, J.W. (1996) The osmium isotopic composition of the Earth’s primitive upper mantle. Nature 383, 517–520.
 Show in context
 Rhenium is relatively incompatible while Os is highly compatible, leading to high Re/Os and long term radiogenic 187Os/188Os signatures in crust (>1; Peucker-Ehrenbrink and Jahn, 2001), while the primitive mantle preserves lower Re/Os and less radiogenic 187Os/188Os signatures (~0.1296) relative to chondrites (0.126–0.128; Meisel et al., 1996; Day et al., 2016).
View in article
For all combinations of Sr-Nd-Os isotopes, data arrays of Deccan lavas can be explained by a Réunion-like mantle source that has assimilated lower and/or upper continental crust with no required role from lithosphere or a primitive mantle-like source (Meisel et al., 1996).
View in article
Melluso, L., Mahoney, J.J., Dallai, L. (2006) Mantle sources and crustal input as recorded in high-Mg Deccan Traps basalts of Gujarat (India). Lithos 89, 259–274.
 Show in context
 These results extend to compositions among the most geochemically primitive of published Deccan Sr-Nd isotope data (e.g., Melluso et al., 2006; Sheth and Melluso, 2008).
View in article
Peate, D.W. (1997) The Paraná-Etendeka Province. In: Mahoney, J.J., Coffin, M.F. (Eds.) Large igneous provinces: Continental, oceanic, and planetary flood volcanism. Geophysical Monograph 100. American Geophysical Union, Washington, D.C., 217–245.
 Show in context
 This effect has also been observed for other hotspot systems (Gibson et al., 1995; Peate, 1997; Dale et al. 2009; Day, 2016), meaning that it may be an inevitable consequence of magma ascent through lithosphere and crust, effectively masking primary magmatic signatures.
View in article
Peng, Z.X., Mahoney, J., Hooper, P., Harris, C., Beane, J. (1994) A role for lower continental crust in flood basalt genesis? Isotopic and incompatible element study of the lower six formation of the western Deccan Traps. Geochimica et Cosmochimica Acta 58, 267–288.
 Show in context
 For example, Sr-Nd isotopic compositions of Deccan basalts deflect away from a Réunion end member (e.g., Fig. 2 of Peng et al., 1994), which may be a consequence of extensive assimilation of lithospheric or crustal material into CFB magmas.
View in article
This explains why the Sr-Nd-Pb isotopic characteristics of flood basalts can be dominated by contributions from lithospheric melt and partially melted crust (e.g., Peng et al., 1994; Gibson et al., 1995).
View in article
Many early surveys of the Deccan Traps focused primarily on the relationship between mantle sources of Deccan lavas and depleted upper mantle domains since relatively high concentrations of Sr and Nd in Indian continental crust likely obscured isotopic signatures of deep sources (e.g., Peng et al., 1994)
View in article
Peters, B.J., Day, J.M.D., Taylor, L.A. (2016) Early mantle heterogeneities in the Réunion hotspot source inferred from highly siderophile elements in cumulate xenoliths. Earth and Planetary Science Letters 448, 150–160.
 Show in context
 This result is irreconcilable with the highly consistent and more radiogenic 187Os/188Os signature of Réunion igneous rocks (Schiano et al., 2012; Peters et al., 2016) (0.1324 ± 0.0014; Fig. 2a), suggesting that there is not a geochemical link in the Deccan-Réunion system and fundamentally challenging physical models of plume head and tail magmatism.
View in article
A York-type regression of our filtered data yields an isochron initial 187Os/188Os of 0.1336 ± 0.0031 (n = 21), identical, within uncertainties, to the Réunion end member (0.1324 ± 0.0014) (Peters et al., 2016).
View in article
Figure 2 (a) 187Os/188Os versus [Os] for Deccan lavas (red circles), with inferred compositions of the Réunion primary magma (green circle) (Peters et al., 2016), crust (CC: continental crust) and lithosphere (DMM: depleted mid-ocean ridge basalt mantle, CLM: continental lithospheric mantle) and mixing lines.
View in article
To test the quantitative geochemical relationship between Deccan and Réunion Sr-Nd-Os isotopic signatures, we establish Réunion end members according to Peters et al. (2016) (Os) and from published Réunion geochemistry data (Sr-Nd; Table S-4).
View in article
If this is the case, the African LLSVP must actively transport material with primordial compositions to Earth’s surface (Peters et al., 2016).
View in article
Peucat, J.J., Vidal, P., Bernard-Griffiths J., Condie, K.C. (1989) Sr, Nd, and Pb isotopic systematics in the Archean low- to high-grade transition zone of southern India: syn-accretion vs. post-accretion granulites. Journal of Geology 97, 537–550.
 Show in context
 We establish crust end members from published data on regional (Sr-Nd) and global (Os), crustal rocks (Peucat et al., 1989, 2013; Asmerom and Walker, 1998; Ray et al., 2008) and mantle lithospheric end members from published global data (Snow and Reisberg, 1995; McBride et al., 1996; Roy-Barman et al., 1998; Aulbach et al., 2016).
View in article
Peucat, J.-J., Jayananda, M., Chardon, D., Capdevila, R., Fanning, C.M., Paquette, J.-L. (2013) The lower crust of the Dharwar Craton, Southern Indian: Patchwork of Archean granulitic domains. Precambrian Research 227, 4–28.
 Show in context
 We establish crust end members from published data on regional (Sr-Nd) and global (Os), crustal rocks (Peucat et al., 1989, 2013; Asmerom and Walker, 1998; Ray et al., 2008) and mantle lithospheric end members from published global data (Snow and Reisberg, 1995; McBride et al., 1996; Roy-Barman et al., 1998; Aulbach et al., 2016).
View in article
Peucker-Ehrenbrink, B., Jahn, B.-M. (2001) Rhenium-osmium isotope systematics and platinum-group element concentrations: loess and the upper continental crust: Geochemistry, Geophysics, Geosystems 2, doi: 10.1029/2001GC000172.
 Show in context
 Rhenium is relatively incompatible while Os is highly compatible, leading to high Re/Os and long term radiogenic 187Os/188Os signatures in crust (>1; Peucker-Ehrenbrink and Jahn, 2001), while the primitive mantle preserves lower Re/Os and less radiogenic 187Os/188Os signatures (~0.1296) relative to chondrites (0.126–0.128; Meisel et al., 1996; Day et al., 2016).
View in article
Ray, R., Shukla, A.D., Sheth, H.C., Ray, J.S., Duraiswami, R.A., Vanderkluysen, L., Rautela, C.S., Mallik, J. (2008) Highly heterogeneous Precambrian basement under the central Deccan Traps, India: Direct evidence from xenoliths in dykes. Gondwana Research 13, 375–385.
 Show in context
 We establish crust end members from published data on regional (Sr-Nd) and global (Os), crustal rocks (Peucat et al., 1989, 2013; Asmerom and Walker, 1998; Ray et al., 2008) and mantle lithospheric end members from published global data (Snow and Reisberg, 1995; McBride et al., 1996; Roy-Barman et al., 1998; Aulbach et al., 2016).
View in article
Roy-Barman, M., Wasserburg, G.J., Papanastassiou D.A., Chaussidon, M. (1998) Osmium isotopic compositions and Re-Os concentrations in sulfide globules from basaltic glasses. Earth and Planetary Science Letters 154, 331–347.
 Show in context
 We establish crust end members from published data on regional (Sr-Nd) and global (Os), crustal rocks (Peucat et al., 1989, 2013; Asmerom and Walker, 1998; Ray et al., 2008) and mantle lithospheric end members from published global data (Snow and Reisberg, 1995; McBride et al., 1996; Roy-Barman et al., 1998; Aulbach et al., 2016).
View in article
Roy, S., Rao, R.U.M. (2000) Heat flow in the Indian shield. Journal of Geophysical Research 105, 25587–25604.
 Show in context
 Such assumptions, however, are at odds with expected physical consequences of ancient mantle plumes; for example, modern heat flow measurements do not record increased heat flow beneath the Deccan Traps, where an ancient mantle plume might be expected to have thinned the continental crust and lithosphere and increased heat transfer from the mantle to the surface (Roy and Rao, 2000).
View in article
Richards, M.A., Duncan R.A., Courtillot, V.E. (1989) Flood basalts and hot-spot tracks: Plume heads and tails. Science 246, 103–107.
 Show in context
 One common model suggests that hotspots are derived from thermo-chemically buoyant mantle plumes that rise from the deep mantle, initiating short-lived, high volume ‘flood basalt’ volcanism that likely had collateral tectonic and environmental consequences (Richards et al., 1989; Hill, 1991; Self et al., 2008).
View in article
Schiano, P., David, K., Vlastelic, I., Gannoun, A., Klein, M., Nauret F., Bonnand, P. (2012) Osmium isotope systematics of historical lavas from Piton de la Fournaise (Réunion Island, Indian Ocean). Contributions to Mineralogy and Petrology 164, 805–820.
 Show in context
 This result is irreconcilable with the highly consistent and more radiogenic 187Os/188Os signature of Réunion igneous rocks (Schiano et al., 2012; Peters et al., 2016) (0.1324 ± 0.0014; Fig. 2a), suggesting that there is not a geochemical link in the Deccan-Réunion system and fundamentally challenging physical models of plume head and tail magmatism.
View in article
Self, S., Blake, S., Sharma, K., Widdowson M., Sephton, S. (2008) Sulfur and chlorine in late Cretaceous Deccan magmas and eruptive gas release. Science 319, 1654–1657.
 Show in context
 One common model suggests that hotspots are derived from thermo-chemically buoyant mantle plumes that rise from the deep mantle, initiating short-lived, high volume ‘flood basalt’ volcanism that likely had collateral tectonic and environmental consequences (Richards et al., 1989; Hill, 1991; Self et al., 2008).
View in article
Sheth, H., Melluso, L. (2008) The Mount Pavagadh volcanic suite, Deccan Traps: geochemical stratigraphy and magmatic evolution. Journal of Asian Earth Sciences 32, 5–21.
 Show in context
 These results extend to compositions among the most geochemically primitive of published Deccan Sr-Nd isotope data (e.g., Melluso et al., 2006; Sheth and Melluso, 2008).
View in article
Shirey S.B., Walker, R.J. (1998) The Re–Os isotope system in cosmochemistry and high-temperature geochemistry. Annual Review of Earth and Planetary Sciences 26, 423–500.
 Show in context
 The siderophile 187Re-187Os isotope system (t1/2 ≈ 42 Ga) (Shirey and Walker, 1998) provides an opportunity to resolve a geochemical link between plume head and tail volcanism.
View in article
Snow, J.E., Reisberg, L. (1995) Os isotopic systematics of the MORB mantle: results from altered abyssal peridotites: Earth and Planetary Science Letters 133, 411–421.
 Show in context
 We establish crust end members from published data on regional (Sr-Nd) and global (Os), crustal rocks (Peucat et al., 1989, 2013; Asmerom and Walker, 1998; Ray et al., 2008) and mantle lithospheric end members from published global data (Snow and Reisberg, 1995; McBride et al., 1996; Roy-Barman et al., 1998; Aulbach et al., 2016).
View in article
Zhao, C., Garnero, E.J., McNamara, A.K., Schmerr N., Carlson, R.W. (2015) Seismic evidence for a chemically distinct thermochemical reservoir in Earth’s deep mantle beneath Hawaii. Earth and Planetary Science Letters 426, 143–153.
 Show in context
 These hotspots, as well as the Réunion hotspot, lie above the edge of the African large low-shear-velocity province (LLSVP), which may serve as the lower mantle source to many plumes (Zhao et al., 2015).
View in article
If the LLSVP serves as the source for Réunion primary magmas, this is consistent with the notion that LLSVP’s are not only presently stable (Zhao et al., 2015), but that they have remained stable through at least the Cenozoic.
View in article
top
Supplementary Information
Samples and Methods
Sampling Details
The primary goal of this study was to assess the elemental and isotopic characteristics of Deccan Traps continental flood basalts (CFB) and determine their relationship to Réunion ocean island basalts (OIB). Sampling was performed throughout the western extent of the Deccan Traps, from northern exposures in the Kutch region of Gujarat, to southern exposures near Mahabaleshwar in Maharashtra (Fig. S-1). These areas cover much of the chemostratigaphy of the Deccan Traps (Fig. S-2), with the exception of the uppermost Desur and Panhala Formations, and possibly also the lowermost Jawhar Formation. The availability of published maps identifying the surficial extent of chemostratigraphic units, particularly far from the “main sequence” lavas near Mahabaleshwar, is limited. Consequently, our sampling strategy was not governed by the availability of good sampling localities for specific formations. Sampling was most intensive in the Saurashtra region of Gujarat, for which there is limited published geochemical data despite the presence of lavas with comparatively primitive compositions (Melluso et al., 2006), and for which chemostratigraphy corresponding to other Deccan flows is weakly established. To avoid inadvertently sampling material not related to Deccan Traps volcanism, only areas where exposed volcanic rocks had bonafide Deccan provenance were sampled, based on literature. Samples were collected from key localities, including the mantle xenolith-bearing volcanic plugs near Bhuj, the Amba Dongar carbonatite and nephelenite and lamprophyre dykes near Murud, Maharashtra.
Many lava samples are aphanitic and display varying degrees of weathering. Altered rinds were removed from samples using facilities at IIT Bombay (overseen by K. Pande and staff members). For porphyritic samples, plagioclase, clinopyroxene and olivine crystals were separated from bulk rock crush for separate analyses. Samples were crushed and powdered at Scripps Institution of Oceanography. Samples were split using a diamond tipped saw, cut surfaces were sanded with carborundum paper and then cleaned thoroughly with distilled water, and dried. Sample fragments were then crushed using an alumina jaw crusher. Approximately 100 grams of coarse crush material was then processed in an SPEX alumina shatter box to produce a fine and homogeneous rock powder.

Figure S-1 Map of northwestern India showing sampling locations included expanded views of sample locations with major geographic indicators (roads, mountain tops – Insets A to C).

Figure S-2 Chemostratigraphic subgroups and formations of the Deccan Traps volcanic province (Cox and Hawkesworth, 1985) with relative unit thicknesses (Jay and Widdowson, 2008) represented along the vertical axis (total eruptive thickness of ca. 3 km) and relative unit volumes (Richards et al., 2015) along the horizontal axis of the right-most panel. Dashed lines represent minimum volume estimates (DiMuro et al., 2014) and diagonal wavy lines represent range of possible total volumes up to the volume of the next upward formation with a well constrained estimated volume.
Analytical Methods
Sixty-four samples were selected for major and trace element analyses. From this sample set, 45 were selected for Os isotope and HSE analyses and 20 were selected for Sr and Nd isotope analyses. In addition, olivine, clinopyroxene and plagioclase separates and olivine powders recycled from a separate campaign of He isotopic analyses representing nine samples were analysed for their HSE abundances. Except for XRF element analyses, all other digestions and analyses in this study were performed at the Scripps Isotope Geochemistry Laboratory (SIGL).
Major and trace element abundance analyses. Analysis of major and selected trace elements, FeO titrations and loss on ignition were performed by X-ray fluorescence (XRF) at Franklin and Marshall University using a PW 2404 PANalytical XRF vacuum spectrometer according to procedures detailed in Boyd and Mertzman (1987) and on the Franklin and Marshall XRF Laboratory website (http://www.fandm.edu/earth-environment/laboratory-facilities/xrf-and-xrd-lab). Trace element abundances were determined on ca. 100 mg of homogenised rock powder, as outlined previously (Day et al., 2014) using a ThermoScientific iCAPq-c quadrupole inductively coupled plasma mass spectrometer (ICPMS) in standard mode. Reproducibility of trace element measurements in rock standards was generally better than 3 % (RSD) for standards, and element abundances were generally within given errors (1σ standard deviation) of the USGS recommended values. Trace element concentrations determined by ICPMS generally agreed with those determined by XRF (Fig. S-3), except for sample DC14-40B, which frequently, although not exclusively, has lower trace element abundances measured by ICPMS, compared to XRF.

Figure S-3 Comparison of trace element abundances obtained from XRF (x-axis) and ICPMS (y-axis) plotted with unity lines. Elements are selected to represent several types of relationships: (a) Ni, which shows a robust correlation near unity; (b) Ba, which shows a robust relationship slightly offset from unity; (c) Y, which shows a moderately robust relationship offset from unity; and (d) La and Ce, which show a poor relationship offset from unity. Only rare earth elements and U, Th and Pb, the latter three of which are often below detection limits, fall into the last category. We use only the higher precision and accurate ICPMS REE, U, Th and Pb data in our discussion.
Strontium and neodymium isotope analyses. We performed a complete digestion and column calibration procedure as outlined in Table S-1. Isotopic compositions of Sr and Nd were measured as metals in positive ion mode on a ThermoScientific Triton Plus thermal ionisation mass spectrometer (TIMS). Blank contributions were monitored by analysis of Sr and Nd abundances on the iCAP-q ICPMS using stock solutions diluted to 0.01, 0.1, 1, 5 and 10 ppb. Using these data, we constructed a calibration curve using a least squares regression forced through zero and determined blank abundances using this curve. The r2 fits for the Sr and Nd calibration curves were >0.99. The Sr blanks averaged 460 pg (0.0002–0.001 % of loaded Sr) and had a measured 87Sr/86Sr of 0.70782. The Nd blanks averaged 61 pg (0.0003–0.003 % of loaded Nd) and could not be precisely analysed for their 143Nd/144Nd ratios; consequently, the natural 143Nd/144Nd value of 0.5128 was used for blank corrections. Long term precision of isotopic measurements was monitored by repeated measurements of NIST NBS987 (Sr) and La Jolla (Nd) standards, with results of 0.710234 ± 0.000019 (n = 6) and 0.511836 ± 0.000004 (n = 5), respectively.
Osmium isotope analyses and highly siderophile element abundances. Osmium isotope and HSE abundance analyses were performed using methods described in Day et al. (2016). Homogenised powders were precisely weighed and digested in sealed borosilicate Carius tubes with isotopically enriched spikes and 10 mL of a 2:3 mixture of multiply Teflon-distilled HCl and Teflon-distilled HNO3 that had been purged of Os. One gram of rock powder was used for all whole rock analyses to avoid erroneous results due to nuggeting. Powders were equilibrated with isotopically enriched multi-element HSE spikes (99Ru, 106Pd, 185Re, 190Os, 191Ir, 194Pt); approximately half were enriched with a spike containing a set Re/Os ratio of ~0.25 and the remainder were spiked for Re and Os separately. Replicate analyses revealed no significant difference between samples spiked with the combined Re-Os spike and the separate Re and Os spikes. Samples were digested at 240 °C in an oven for 72 hours. Osmium was then triply extracted from the acid using CCl4, back-extracted into HBr (Cohen and Waters, 1996) and purified by multiple micro-distillation (Birck et al., 1997). Rhenium and platinum group elements were recovered and purified from the residual solutions by anion exchange separation (Day et al., 2016), and then analysed on a Thermo Scientific iCAPq-c ICPMS in standard mode. Isotopic compositions of Os were measured in negative ion mode by peak-jumping on the ThermoScientific Triton TIMS and were oxide and fractionation corrected using 192Os/188Os = 3.08271. Concentrations of Os were determined from the same data using a 190Os spike subtraction, and were appropriately blank corrected. Repeated measurements of 36 and 72 pg UMCP Johnson Matthey standards were used to monitor precision of the Os isotope measurements, and averaged 0.11397 ± 0.00059 (2σ, n = 23). Total procedural blanks for Os analyses (n = 8) had an average corrected 187Os/188Os of 0.2748 and Os abundances of 2.2 ± 2.3 pg. Measured Re, Ir, Pt, Pd and Ru isotopic ratios for sample solutions were corrected for mass fractionation using the deviation of the standard average run on the day over the natural ratio for the element, and all reported values are blank corrected. HSE abundances of these blanks (n = 14) were (in pg): 75–202 for Ir, 14–525 for Ru, 7–46 for Pt, 13–94 for Pd and 15–100 for Re. Total analytical blanks reflect Carius tube batches used to process samples, as well as levels of underspiking for some total analytical blanks. Full tabulated blank percentages for each sample are available in Table S-2.
Determination of Réunion primary magma compositions
For Sr and Nd abundances and isotopic compositions, primary magma MgO was first determined on plots of MgO versus Al2O3 for Réunion basaltic samples available on the GEOROC database, which illustrates the relatively simple process of olivine removal or accumulation from a primary magma about a visually-determined inflection point. Because the location of this inflection point is subjective, and its MgO value determines all subsequent calculations, a window of error on the inflection point was determined. From least squares regressions, the Réunion primary magma has an MgO content of between 15.8 and 19.5 wt. %, with a preferred value of 17.4 wt. %. This result is similar to those determined by repeating the same exercise with similarly filtered datasets from other hotspots. Datasets comprising available MgO-Sr and MgO-Nd data for Réunion basaltic rocks were then compiled. In both cases, these data arrays also display inflection points corresponding to a phase change that radically alters the Sr and Nd abundances of low MgO lavas. The range of MgO affected by this phase change was visually determined to exclude all affected samples from further calculation. The remaining data were regressed above and below inferred primary magma MgO contents, and Sr and Nd abundances were determined from these regressions with error from both visual estimates appropriately propagated. Datasets comprising available Sr-87Sr/86Sr and Nd-143Nd/144Nd data for Réunion basaltic lavas were assembled and the data were regressed in a similar manner and determined primary magma 87Sr/86Sr and 143Nd/144Nd ratios from previously determined Sr and Nd abundances. This method is particularly appropriately applied to Réunion OIB, as the relatively small total variations in 87Sr/86Sr (ca. 0.7040 to 0.7043) and 143Nd/144Nd (ca. +3.8–4.8ε) among Réunion OIB mean that uncertainty introduced by the method itself is less than where the method is applied at any other global hotspot.
Supplementary Results
Major and trace element abundances
Analysed rock samples span a large compositional range, with SiO2 spanning from 42 to 73 wt. %. The samples are geochemically classified as basalts, with alkali basalts occurring primarily in the Kutch region (Fig. S-4) and tholeiitic basalts occurring throughout the Deccan Traps. Two melanocratic, silicic rocks were analysed: a rhyolite from the Saurashtra region (sample DC14-29) and a trachyandesite from the Girnar volcanic complex of Saurashtra (sample DC14-40A). Several basaltic andesites and one basanite were also collected from the Saurashtra region, making it the most compositionally diverse sampled region of our dataset. The sample suite includes both primitive (up to MgO = 15.7 wt. % and Mg# = 84) and evolved (to MgO = 1.3 wt. %, Mg# = 39, excluding the highly silicic samples) rocks. Although we generally sampled primarily visually unaltered, melanocratic samples, which tend to have the highest concentrations of the HSE, only five of our samples have MgO > 12 wt. %, despite documentation of picrites (i.e. olivine-bearing basalts; e.g., Melluso et al., 2006) in the areas sampled.

Figure S-4 Total alkali versus silica plot for new bulk rock major element data for Deccan lavas.
Correlations between MgO, major and minor elements reveal strong fractional crystallisation controls (Fig. S-5). An inflection point exists on a plot of Cu versus Mg at MgO ≈ 8 wt. %, implying that this is the threshold below which sulphide saturation began affecting bulk rock compositions. A similar inflection point exists around 8 wt. % MgO for plots of Ni and Cr, consistent with removal of sulphide and spinel (magnetite). It is notable, however, that several of the most primitive samples lie on parallel trends with lower Ni contents for a given MgO content, implying they may have derived from a compositionally distinct parental magma with low initial Ni content. There is a robust negative correlation between MgO and Y/Ho, suggesting that such “canonical” ratios (in this case Y/Ho = ~25.5) may remain relatively unaffected by fractional crystallisation despite extensive potential for crustal contamination. In contrast, primitive mantle-normalised (McDonough and Sun, 1995) La/Yb ratios do not show such a correlation to MgO, implying that HREE/LREE ratios may have been disturbed during crustal assimilation, or reflect different parental melt compositions.

Figure S-5 MgO versus major and minor elements for new whole rock geochemical data with approximate fractionation pathways relative to an assumed melt composition. Symbols as in Figure S-4.
Primitive mantle-normalised trace element contents (Fig. S-6) reveal variably steep incompatible element patterns. The steepest patterns are observed among basalts and basanites from Kutch and Pavagadh, while the flattest patterns are observed in flows near Kalsubai, basaltic dykes from the Maharashtra coast and low Ti basalts from Saurashtra. High Ti basalts from Saurashtra show relatively steep patterns, with high Ti Girnar basalts showing characteristic relative depletions in Zr and Hf. Kutch, Pavagadh and high Ti Saurashtra samples all show relative depletions in Cs and generally have relative enrichments in Ta without being enriched in Nb. The REE patterns amongst this subset show smooth negative trends with occasional depletions in Y relative to the middle REE. Basalts comprising the flattest trace element patterns also have flat MREE/HREE, with strong relative depletions in Ti. Relatively flat patterns among samples from near Mumbai also show characteristic relative enrichments in Rb and depletions in Sr. All samples from Kalusbai, which have among the ‘flattest’ trends, possess relative depletions in Nb and Sr, and many also possess a strong relative depletion in K.

Figure S-6 Trace element variation diagrams for Deccan lavas, normalised to primitive mantle (McDonough and Sun, 1995). Gray field represent range of Réunion lava compositions (Table S-3; Peters et al., 2016). Symbols as in Figure S-4.
Nephelenite and lamprophyre dykes near Murud, Maharashtra show enrichments in incompatible trace elements relative to basalts from the same locality. One lamprophyre sample exhibits relative depletions in Th and U and relative enrichments in K, Pb and Sr, while the other sampled lamprophyre, and the nephelenite have opposing patterns across K, Pb and Sr, and notable relative enrichments in Sm. Two dyke samples from the same locality have strong relative enrichments in Cs, which are not observed in any other samples across the Deccan. These complex patterns may be the result of unusually low degrees of partial melting combined with fractional crystallisation of unique phases during emplacement through normal faulting along the western Indian seaboard in the waning stages of Deccan volcanism. Full major and trace element data for all samples can be found in Table S-3.
Highly siderophile element abundances
Within the Deccan suite, the HSE contents are highly variable, but are generally depleted relative to primitive upper mantle (PUM) (Becker et al., 2006) (Fig. S-7). For example, Os concentrations range from 4 ppt to more than 1 ppb, and Pd concentrations from 99 ppt to more than 21 ppb, with the highest concentrations generally found in the low Ti Saurashtra group. Concentrations of Ir are generally low (0.008–0.839 ppb), with many samples possessing Ir within the range of our total procedural blanks, meaning that the blank approaches 100 % of the measured Ir in these samples (Table S-3). Many samples possess elevated Pt, Pd and Re relative to Os, Ir and Ru, which is a characteristic signature of relatively low MgO magmas that have experienced sulphide saturation (Jamais et al., 2008). Some samples, for example from Kutch and coastal Maharashtra, display relatively low Ru/Ir, contrary to many Réunion cumulates and lavas. Only the highest measured HSE concentrations for Deccan lavas approach those of Réunion cumulates and basalts (Peters et al., 2016); many samples are markedly depleted relative to Réunion and global OIB (Day, 2013).

Figure S-7 Primitive upper mantle (PUM) (Becker et al., 2006) normalised highly siderophile element patterns for Deccan lavas. Range of compositions for Saurashtra low Ti basalts (b) shown as gray region in other panels. Nearly all samples show evidence for sulphide fractionation of HSE evidenced by elevated (Pt + Pd + Re) / (Os + Ir + Ru), as evidenced by Figure S-10. Symbols as in Figure S-4.
Olivine and clinopyroxene separates have relatively flat PUM-normalised (Becker et al., 2006) HSE patterns (Fig. S-8), whereas plagioclase separates show more fractionated patterns with relative enrichments in Pt, Pd and Re. All but one separate (olivine separate DC14-47B) show relative depletions in Ir, with concentrations ranging from 0.0004–1.478 ppb. The HSE concentrations are generally enriched relative to their host rock, whereas in clinopyroxene and plagioclase separates, HSE concentrations are relatively depleted relative to the host rock. Despite these variations within individual samples, all measured HSE values for mineral separates are within the range of all measured Deccan whole rocks (Fig. S-8), implying that nuggeting in the separates is minimal. Full HSE data for all samples can be found in Table S-3.

Figure S-8 (a) PUM-normalised (Becker et al., 2006) HSE patterns for host lavas and (b) mineral separates. Crossed symbols in (b) are recycled powders from crushing in a WC crusher. Gray fields represent range of all measured Deccan samples.
Sr-Nd-Os isotope compositions
Measured 87Sr/88Sr ratios ranged from 0.70386 to 0.71197. Coupled with a range in 87Rb/86Sr ratios of 0.005 to 0.09, the age-corrected ratios span a similar range, from 0.70383 to 0.71195, at 65 Ma. Measured 143Nd/144Nd ranged from 0.511806 to 0.512839, age-correcting to 0.511701 to 0.512733 (or -16.6 to +3.6 in εCHUR(65 Ma) units) at 65 Ma with 147Sm/144Nd ratios of 0.16 to 0.32. These results are well within the range of published Deccan Sr-Nd isotope data (Mahoney et al., 1982, 1985, 2000; Cox and Hawkesworth, 1985; Lightfoot et al., 1987, 1988, 1990; Peng et al., 1994, 1998; Peng and Mahoney, 1995; Simonetti et al., 1998; Melluso et al., 2002, 2006; Sheth and Melluso, 2008; Vanderkluysen et al., 2011) which span to much more enriched compositions (i.e. crustal signatures) than our own (87Sr/88SrT = 0.703–0.786; 143Nd/144NdT = 0.5114–0.5129). The most enriched samples of our suite are DC14-28 and 59 (87Sr/86SrT of 0.711954 and 0.709875, respectively and εNdT of -15.0 and -17.3, respectively). A strong negative correlation exists between 87Sr/86Sr and 143Nd/144Nd (r2 = 0.77, excluding nephelenite sample 79; Fig. 2). Samples with moderately enriched Sr-Nd isotopic signatures are spread throughout all measured localities. The range of Sr-Nd-Pb isotope compositions found in the Deccan has widely been ascribed to variable crustal assimilation, with possible distinct contributions from lower and upper crust, or to assimilation of a heterogeneous group of crustal and lithospheric contaminants (Peng et al., 1998). Full Sr-Nd isotope data for all samples can be found in Table S-3.
Osmium isotopic compositions are highly variable, spanning compositions consistent with assimilation of continental lithospheric mantle material (~0.1186), to highly radiogenic crust (~1.44). Assimilation of depleted mantle material may have occurred in the liquid phase, or mantle material may be represented by mafic xenocrysts assimilated in the solid phase. Some samples are clearly disturbed with unsupported Os isotopic compositions after age-correction (γOs = -134 to +1033; γOs = (187Os/188Ossample-T / 187Os/188Oschondrite – 1) * 100, 187Os/188Oschondrite = 0.12714). Accounting for these samples, and those with lithospheric contamination, the average γOs of samples with high Os (>0.5 ppb) concentrations is +2.5 ± 3.7. Full Os isotope data for all samples can be found in Table S-3.
Supplementary Discussion
Assimilation of lithospheric and crustal materials
The Dharwar craton, which underlies much of the Deccan Traps, represents more than 200 km of continental lithosphere (Gupta et al., 1991), with 33–52 km of this thickness representing silicic crustal rocks (Gupta et al., 2003). In contrast, the crust thins to a minimum thickness of <20 km south of the Narmada Rift, which correlates to a large positive Bouguer anomaly extending north from Mumbai and both east and west at the Narmada Rift (Kaila, 1986). Accordingly, Deccan mantle-derived melts may have experienced variable amounts of crustal and lithospheric assimilation. Complex arrays in Sr-Nd-Pb isotopic space have led many researchers to adopt multi-stage and multi-component mixing to explain the compositions of Deccan lavas, including distinct roles for lithospheric, lower and upper crustal materials. Common interpretations of the Ambenali formation, which primarily crops out in the Western Ghats, include contamination by low ε143Nd and low 87Sr/86Sr materials, variably envisioned as continental lithospheric mantle (CLM) (Lightfoot et al., 1988, 1990) or lower crust (Peng et al., 1994). Qualitative modelling efforts have evoked crustal contaminants to explain trends found in commonly cited chemostratigraphic units (e.g., Peng et al., 1994). In some areas throughout the Deccan, however, age-corrected Sr-Nd isotopic compositions reveal a relatively minor role for crustal assimilation (Melluso et al., 2006; Sheth et al., 2014).
Our data range from isotopically ‘enriched’ (i.e. radiogenic 87Sr/86SrT to 0.711954, low εNd(T) to -16.6, and radiogenic 187Os/188OsT to 0.67132) to isotopically ‘depleted’ compositions (i.e. relatively unradiogenic 87Sr/86SrT to 0.703834, depleted εNd to +3.6, and unradiogenic 187Os/188OsT to 0.11797), and show clear assimilation trends when plotted versus elemental abundances (Fig. 2, Fig. S-9). We consider the effect of CLM, depleted MORB mantle (DMM), lower and upper continental crust (Peucat et al., 1989, 2013; Asmerom and Walker, 1998; Ray et al., 2008; Aulbach et al., 2016) on a Réunion-like Sr-Nd-Os isotopic and elemental composition. We use calculated parental 187Os/188Os and Os abundance values (Peters et al., 2016); Réunion end member Sr-Nd isotopic compositions were calculated as 87Sr/86Sr = 0.704158 (abundance: 387 ppm) and 143Nd/144Nd = 0.512849 (abundance 27 ppm). Empirical data were used to represent the composition of the assimilated reservoirs, and used measurements on regional upper and lower crustal crust where these were available; this information is tabulated in Table S-4.

Figure S-9 (a) Plots of 87Sr/86Sr versus Sr abundance and (b) 143Nd/144Nd versus Nd abundance. Similar to Figure 2a and Figure 3, inferred compositions of Réunion primary magmas are shown by dark circles. Mantle and crustal reservoirs that may act as assimilants to ascending Deccan primary magmas are shown by other large symbols. Small x symbols demarcate 10 % intervals of mixing. In (b), a number of alkalic and ultra-alkalic rocks show enrichment in Nd that moves them away from the Réunion-LCC join; no known crustal or upper mantle reservoir has Nd greater than about 20 ppm. Data sources are listed in Table S-4.
The bulk of 87Sr/86Sr versus Sr abundance data corresponds to mixing between a Réunion-like end member and upper continental crust (UCC, Fig. S-9a). Similarly, many 142Nd/143Nd data lie along a Réunion-lower continental crust (LCC) mixing trend (Fig. S-9b). However, in both cases some alkali samples display enrichment in Sr and Nd that pulls them away from these mixing joins. In the case of Sr isotopes, this trend may be explained by sequential assimilation of LCC and UCC, since Dharwar lower crust has less radiogenic 87Sr/86Sr and higher Sr abundance than Dharwar upper crust (Peucat et al., 1989, 2003; Ray et al., 2008). However, in the case of Nd and its isotopes, similar enrichment patterns cannot be explained by assimilation of crust or mantle reservoirs, as none have Nd abundances that approach the level of some samples (up to 100 ppm). Given that the same samples are affected by both relative Sr and Nd enrichments, it is possible that both are an equilibrium effect of partial melting or another physical process that affects alkali basalts and ultra-alkalic rocks more strongly than tholeiites. Thus, rather than Sr isotopes showing influence from both LCC and UCC, the Sr-enriched samples have inherited high Sr before differentiation and display little evidence for assimilation of lower or upper crustal Sr. A more simplistic mixing scenario exists for Os isotopes, which show good fit around a binary mixture between a Réunion-like parental magma and continental crust (Fig. 2a). We note that upper and lower continental crust contain similar Os abundances and isotopic signatures (Esser and Turekian, 1993; Asmerom and Walker, 1998) that would produce similar mixing trajectories, however the slightly elevated Os abundance of lower continental crust provides the best match to the array of Deccan data.
Multi-element plots show evidence for similar mixing histories (Fig. 3). These solutions are not unique, however, and arrays in the same space may be created by a primary mixture between a Réunion-like parental magma and a depleted mantle reservoir. However, if this were the case one would expect the inflection of the data to be subparallel to the Réunion-upper continental crust mixing curve until unrealistically high amounts of depleted mantle are assimilated. Further, if the Sr-Nd isotope system were open to assimilation of depleted mantle materials, one might expect to observe data with Sr isotopes less radiogenic than and Nd isotopes more radiogenic than Réunion, which do not exist in our dataset. In Nd-Os isotope space, a subordinate role for UCC is seen, with primary mixtures occurring between a Réunion-like parental magma and assimilation of lower continental crust. Some samples, including an analysed main sequence lava, may be explained instead by a primary mixture of a Réunion-like parental magma and DMM, followed by assimilation of lower continental crust. However, we prefer a unified explanation for all our data, some of which cannot be explained by such an assimilation history, and it is more likely that significant CLM existed in the ascent pathways of liquid Deccan primary magmas than DMM. Notwithstanding, many studies invoke DMM or Central Indian Ridge-like MORB as solid assimilants or melt-product contaminants responsible for the trace element and isotopic compositions of Deccan basalts (Melluso et al., 2006).
Despite clear mixing trends for binary isotope and isotope-element plots (Figs 2a and 3, and Fig. S-9), each combination of analytes implies a dominant role for different assimilant reservoirs. For example, Sr-87Sr/86Sr mixing relations imply a dominant role for UCC, whereas Nd-143Nd/144Nd mixing relations strongly imply mixing independent of UCC. Considering the dominant mineral hosts of Sr (plagioclase), Nd (pyroxene, phosphates) and Os (cr-spinel, olivine, sulphide), it is possible that the Os isotope system was closed to assimilation after the early stages of magma ascent, when most olivine and spinel have already crystallised, whereas Sr, which is bound mostly in late-crystallising phases, remained open to lithologies seen late in the ascent process, such as those making up the upper continental crust. Thus, each combination of analytes may imply a differing mixture of mantle materials, lower and upper continental crust according to the activity of mineral hosts and the ratio of analytes in the primary magma and the assimilant. For example, although Sr and Nd have distinct assimilation trends as noted above, mixing arrays in a plot of Sr and Nd isotopes (Fig. 3c) strongly imply a role for both upper and lower crust, showing influence from the behaviour of both Sr and Nd in an ascending primary magma.
In both Nd-Sr and Nd-Os isotope space, nephelenite sample DC14-79 lies far from the main data array, while lamprophyre samples DC14-80 and 83B lie particularly far from the main data array only in Nd-Os isotope space. This implies that both the Sm-Nd and Re-Os isotope systematics are distinct during nephelenite genesis, but that only the Re-Os isotope systematics are distinct during lamprophyre genesis, despite both lithologies being present in the same geographic region. This may have occurred if the nephelenites were generated by a lower degree of partial melting than the lamprophyres, generating lower Sm/Nd, but this degree of partial melting was sufficient for both to have initial Re/Os higher than, and 187Os/188Os more radiogenic than, basalts from other parts of the Deccan. The Re/Os ratio of the nephelenite parental magma must have been still greater than that of the lamprophyre, however, because its initial 187Os/188Os is 0.6713, the greatest of the whole suite. In general, however, the clear trend toward our assigned Réunion end member strongly implies that our selected representative composition reflects the composition of the Deccan parental magma and not small degree lithospheric melts represented by these samples (e.g., Gibson et al., 1995).
In order to calculate a hypothesised initial 187Os/188Os representing the whole Deccan Traps, we filtered our available HSE dataset in order to obtain a sample set that is both geographically diffuse and lacking strong evidence for extensive differentiation. We first choose samples that lie close to the MgO-Al2O3 inflection point in Figure S-6 (6 wt. % < sample MgO < 14 wt. %). This filter removes samples that are likely to have experienced significant accumulation or removal of olivine, a phase that commonly hosts sulphides and, if present in amounts that do not represent the Deccan parental magma, may bias the Re/Os and calculated initial 187Os/188Os composition. We then remove samples with LOI greater than 2.5 wt. %, which filters out samples that have experienced high degrees of post-emplacement alteration. Finally, we remove samples with a clear, strong influence from crustal or lithospheric assimilation resulting in unradiogenic or highly radiogenic 187Os/188Os or high 187Re/188Os. Data from 21 analyses representing 15 samples pass these filters: DC14-02 (Kutch), -9, -10A, -10B, -15, -20, -30, -31A (Saurashtra, northern Deccan), -46A, -46B (Pavagadh volcanic complex, central Deccan), -53 (Karjan, central Deccan), -71 (Igatpuri sequence, central Deccan), -82, -84A and -85 (coastal Maharashtra). Filtering of datasets in this way to initial isotopic compositions is generally warranted because the prediction of isochronous behaviour in any system presumes that all samples in the system have identical differentiation histories. When considering samples that span an entire flood basalt province, this assumption is clearly untrue. Geochemical filtering enables selection of samples that have experience the most similar differentiation histories, and, in particular, elimination of samples that have assimilated lithospheric and/or crustal materials to a high degree, but a degree that cannot be precisely calculated. The main drawback to the filtering process is that it may remove samples that, in fact, shared a similar differentiation history to those that pass the filters, and thus an important question is how strictly to filter a large dataset. Introduction of samples with somewhat more diverse histories will increase uncertainty on the calculated initial isotope ratio, but should, theoretically, produce a similar initial ratio within error. For example, taking all samples with MgO > 8 wt. % and 187Re/188Os < 100 (n = 32) produces an initial of 0.132 ± 0.027, a ratio that is essentially identical to the one presented in the main text, but possesses an uncertainty that makes it difficult to differentiate from well known mantle and crustal domains. We present the former initial ratio in the main text and discuss its relationship with Réunion 187Os/188Os, but acknowledge that the geochemistry of flood basalts is complex, that it is difficult to determine accurately a singular parental magma composition for a diverse igneous province, and that the calculated precision of the initial ratio corresponds directly to the selection of data filters.
The HSE composition of the Deccan Traps
Despite the existence of primitive isotopic characteristics, there is compelling evidence that differentiation played a dominant role in the determination of lava HSE signatures. Outside of Kutch, nearly all measured lavas show the characteristic “stepwise” break between relatively low concentrations of the IPGE and relatively high concentrations of the PPGE (Fig. S-7). This feature is common amongst CFB (Rocha-Júnior et al., 2012; Day et al., 2013) and likely results from sulphide saturation in evolved melts, causing rapid loss of IPGE to sulphide phases and preferential retention of PPGE in residual melts (Jamais et al., 2008). This process can be traced on a plot of PPGE versus Cu (Fig. S-10a), where PPGE contents below a certain level indicated by sulphur accumulation (traced by Cu) indicates previous extraction of sulphides. Many of our samples lie above the qualitative line separating S-saturated and S-undersaturated melts (Keays and Lightfoot, 2007, 2010), but still overlap with the field of S-saturated West Greenland lavas, which, considering the low MgO contents of many lavas, strongly implies they represent S-saturated melts.
The effects of sulphide saturation and crustal assimilation on HSE concentrations can be effectively avoided by considering the HSE contents of early formed mineral phases such as olivine. We reconstruct a parental magma composition by regressing Ir versus MgO data for mineral separates and determining concentrations of the remaining HSE using the HSE/Ir ratios of the olivine separates. We can then quantify the effects of sulphide extraction using the partitioning data of Jamais et al. (2008) and empirically determined partition coefficients of Day (2013) (Fig. S-10b) and this assumed parental melt HSE concentration. With an assumed tholeiitic parental magma MgO composition of 16 wt. %, we model extraction of an olivine-clinopyroxene-orthopyroxene-plagioclase assemblage and assimilation of upper continental crust (Peucker-Ehrenbrink and Jahn, 2001; Nishimura, 2012). Concentrations of MgO are monitored using experimentally determined partition coefficients (Beattie, 1994; Bindeman and Davis, 2000; Adam and Green, 2006) to approximate sulphur saturation at ~8 wt. % MgO. At that point (~8 % mass extraction), HSE partition coefficients are changed to reflect increased compatibility of the IPGE relative to the PPGE. Model results overlap measured concentrations of Saurashtra low Ti and Maharashtra main sequence samples, which are some of the most evolved of the sample suite, and generally reproduce the range of PUM normalised HSE concentrations measured in the lavas.
The model predicts relative depletions in Pd for evolved lavas despite input of a parental magma with modest enrichment in Pd, and this is reflected in the measured data for evolved lavas (Fig. S-7). A notable exception is found among main sequence lavas from near Mahabaleshwar (samples DC14-99, 103, 108 and 110), as well as two relatively high MgO lavas from Saurashtra (samples DC14-20 and 31A), which preserve relative Pd enrichments. Given that main sequence lavas from the formations represented by these samples exhibit Sr-Nd-Pb isotope evidence consistent with them being the least contaminated members of the main sequence (e.g., Peng et al., 1994), this may signify the persistence of a relative Pd enrichment present in the parental magma. Additionally, the model predicts relative enrichments in Ir for high MgO lavas and relative depletions in Ir for lower MgO lavas, an effect that would be compounded by degassing of Ir flourides (Toutain and Meyer, 1989). Our data also show relative enrichments in Ir amongst primitive lavas from Pavagadh and coastal regions of Maharashtra, but generally flat-to-negative patterns for Ir elsewhere.

Figure S-10 (a) Plot of Pd versus Cu to discriminate S-undersaturated and S-saturated lavas (Keays and Lightfoot, 2007). Although many Deccan lava samples lie above the qualitative line denoting the boundary between the S-saturated and S-undersaturated fields, most overlap the field of S-saturated (“contaminated”) West Greenland (WG) lavas (Keays and Lightfoot, 2007) which we take to imply that these lavas are also S-saturated. WG/EG: S-undersaturated (“uncontaminated) West and East Greenland lavas (Keays and Lightfoot, 2007). Symbols as in Figure S-4. (b) Assimilation-fractional crystallisation model for a hypothesised Deccan parental magma, equal to the calculated Réunion parental HSE composition of Peters et al. (2016), using partition coefficients of Jamais et al. (2008) and Day (2013) and an upper continental crust HSE composition of Peucker-Ehrenbrink and Jahn (2001). Shown for comparison are composition ranges of Mahabaleshwar main sequence basalts (light gray), Saurashtra low Ti basalts (medium gray) and the field in which these ranges overlap (dark gray). Question mark denotes unknown minimum Ir composition after several analyses for which measured Ir contents were less than the Ir contents of associated total analytical blanks.
Secular trends in the sources of global hotspots
The mantle sources of many hotspots are thought to represent variable mixtures of primitive and depleted mantle materials and recycled crustal materials that arise as a result of dynamic interaction between various, distinct geochemical domains (Stracke et al., 2012). Geochemically depleted materials may comprise up to >80 % of the mantle (Boyet and Carlson, 2006), meaning that primitive and recycled materials represent a volumetrically minor portion of the silicate Earth. Some hotspots display secular changes in the proportion of inferred mantle and crust contributing to their source through their lifetime. This may be expected if hotspot mantle sources change through time, or if changes in the physical nature of the plume affect the locations from which it sources mantle and recycled materials. Hawaiian Loa- and Kea-trend lavas, for example, document mantle source regions of variable influence from recycled materials that are evident in the Sr, Nd and Os isotopic characteristics of Hawaiian OIB (Huang et al., 2005; Ireland et al., 2011). These trends may result from variable source regions across the edge of a large, low-velocity-shear zone (LLSVP) (Weis et al., 2011), from local variations in the thermal structure of a mantle plume (Ren et al., 2005), or may originate from some other source. The Iceland hotspot displays similar variations in inferred source region over time, which has resulted in difficulty reconciling the mantle sources to the North Atlantic Igneous Province CFB and Iceland OIB (Schaefer et al., 2000; Dale et al., 2009). Such difficulties may arise from variable overprinting of mantle source signatures during periods of change, resulting in the decoupling of isotope systems.
In these examples of studies interrogating hotspot provenance, the Re-Os isotope system does not present a unique advantage for diagnosing the relationship between active hotspot volcanism and ancient mantle sources to predecessor eruptions such as CFB. Rather, a geochemical link, as we propose here for the Réunion hotspot, relies on both robust filtering of assimilation signatures and long term source stability of a hotspot generated by a mantle plume. While use of the Re-Os isotope system may be necessary for the former, it may be insufficient to consider Re-Os isotopes alone when learning about the latter. In the case of the Réunion hotspot, concomitant Sr-Nd-Os isotope similarities between Deccan CFB and Réunion OIB, examined for lithospheric and crustal assimilation, present a compelling case against changes in the Réunion mantle plume and its sources through geologic time.
Supplementary Tables
Table S-1 Unspiked Sr-Nd digestion and column procedure.
| √ | Digestion |
| Precisely weigh 0.100 grams homogenised rock powders into labelled 15 mL or 20 mL PFTE beakers. Adjust powder mass to achieve a target load of ca. 1 µL Sr and 500 ng Nd, but do not load more than 0.200 grams into a 15 mL beaker or 0.300 mL into a 20 mL beaker. | |
| Add 1 mL teflon distilled HNO3 per 0.100 grams rock powder to each beaker. | |
| Add 4 mL Optima HF per 0.100 grams rock powder to each beaker. | |
| Place tightly capped beakers on vented hotplate at 150 °C. Monitor for reaction between powder and acid; this should produce a yellowish, gaseous substance above the liquid in the beaker. Allow to flux for at least 72 hours. | |
| Carefully uncap beakers and evaporate to incipient dryness on a vented hotplate at a maximum temperature of 100 °C. Expect this drydown to take 10-12 hours for 5 mL acid at 100 °C. | |
| Add 2 mL teflon distilled HNO3 per 0.100 grams rock powder to each beaker. | |
| Place tightly capped beakers on vented hotplate at 120 °C. Allow to flux for at least 24 hours. | |
| Carefully uncap beakers and evaporate to incipient dryness on a vented hotplate at a maximum temperature of 100 °C. Expect this drydown to take 4-6 hours for 2 mL acid at 100 °C. | |
| Add 5 mL teflon distilled HCl per 0.100 grams rock powder to each beaker. | |
| Place tightly capped beakers on vented hotplate at 120 °C. Allow to flux for at least 24 hours. | |
| Carefully uncap beakers and evaporate to incipient dryness on a vented hotplate at a maximum temperature of 100 °C. Expect this drydown to take 10-12 hours for 5 mL acid at 100 °C. | |
| Add 2 mL 4 M HCl to each beaker. | |
| Place tightly capped beakers on vented hotplate at a maximum temperature of 100 °C for at least three hours to equilibrate sample with dilute acid. | |
| | If desired, extract a ca. 20 uL aliquot for trace element analysis on the ICP-MS. |
| Preliminary cation exchange column | |
| Prepare new columns with 1.5 mL AG50W-X8 resin, or take used columns from storage. With proper cleaning procedures, each column can be used about 10 times with no loss in functionality. | |
| Elute 1 column volume mQ H2O and discard. | |
| Elute 1 column volume 4 M HF and discard into HF-bearing waste container. | |
| Elute 1 column volume mQ H2O and discard. | |
| Elute 1 column volume 6 M HCl and discard into acid waste container. | |
| Elute 1 column volume mQ H2O and discard. | |
| Elute 5 mL 4 N HCl and discard into acid waste container. | |
| Load sample in 2 mL 4 M HCl and collect in 7 mL beaker (Hf-Pb cut) | |
| Elute 2 mL 2.5 N HCl-1 N HF and collect in same 7 mL beaker (Hf-Pb cut) | |
| Elute 20 mL 2.5 N HCl-1 N HF and collect in 20 mL beaker (Sr cut) | |
| Elute 1 column volume 2 N HNO3 and discard into acid waste container (LILE, including Ba). | |
| Elute 15 mL 6 N HCl and collect in 15 mL beaker (REE cut) | |
| Elute 1 column volume mQ H2O and discard. | |
| Elute 5 mL 4 N HCl and discard into acid waste container. | |
| Fill column with 4 N HCl so that liquid level in the column is higher than liquid level in the storage container, and return used column to storage. If the column has been used >10 times, discard the column. | |
| Place uncapped Hf-Pb, Sr and REE beakers on a vented hotplate and evaporate to incipient dryness at a maximum temperature of 100 °C. | |
| Take up Sr cut in 1 mL 4 N HNO3 and allow to equilibrate for at least three hours at a maximum temperature of 70 °C. | |
| | Leave REE cut at incipient dryness for now; do not take up in any liquid. |
| Sr column | |
| Prepare new columns with ca. 200 mg Sr-spec resin in a 1 mL pipette tip (ask for direction), or take used columns from storage. With proper cleaning procedures, each column can be reused with no loss in functionality. | |
| Elute 1 column volume mQ H2O and discard. | |
| Elute 1 column volume 4 N HNO3 and discard. | |
| Elute 1 column volume mQ H2O and discard. | |
| Elute 1 column volume 4 N HNO3 and discard. | |
| Elute 1 column volume mQ H2O and discard. | |
| Elute 1 column volume 4 N HNO3 and discard. | |
| Load sample in 1 mL 4N HNO3 and collect onto dry REE cut. | |
| Elute a further 1 mL 4 N HNO3 and collect into REE cut. Evaporate replenished REE cut to incipient dryness at a maximum temperature of 100 °C. Expect this drydown to take 2-4 hours. Then, take up REE cut in 1 mL 0.2 5N HCl and allow to equilibrate for at least three hours at a maximum temperature of 70 °C. | |
| Elute 1 mL 4 N HNO3 and collect into Sr beaker. Repeat 5 further times for a cumulative collection of 6 mL 4 N HNO3 into the Sr beaker. | |
| Elute 1 mL 0.05 N HNO3 and collect into Sr beaker. Repeat 2 further times for a cumulative collection of 3 mL 0.05 N HNO3 into the Sr beaker. Place uncapped Sr beaker on vented hotplate at a maximum of 100 °C and evaporate to incipient dryness. It is now ready for analysis on the Triton. | |
| Elute 1 mL 0.05 N HNO3 and discard. Repeat 2 further times for a cumulative 3 mL of discarded 0.05 N HNO3. | |
| Elute 1 column volume mQ H2O and discard. | |
| Elute 1 column volume 4 N HNO3 and discard. | |
| | Fill column with 4 N HNO3 so that liquid level in the column is higher than liquid level in the storage container, and return used column to storage in 4N HNO3. |
| Nd column | |
| Prepare new columns with ca. 200 mg LN-spec resin in a 1 mL pipette tip (ask for direction), or take used columns from storage. With proper cleaning procedures, each column can be reused with no loss in functionality. | |
| Elute 1 column volume mQ H2O and discard. | |
| Elute 1 column volume 4 N HNO3 and discard. | |
| Elute 1 column volume mQ H2O and discard. | |
| Elute 1 column volume 6 N HCl and discard. | |
| Elute 1 column volume mQ H2O and discard. | |
| Elute 1 column volume 0.25 N HCl and discard. | |
| Load sample in 1 mL 0.25 N HCl and discard. | |
| Elute 1 mL 0.25 N HCl and collect into Nd beaker. Repeat 2 further times for a cumulative collection of 3 mL 0.25 N HCl into the Nd beaker. Place uncapped Nd beaker on vented hotplate at a maximum of 100 °C and evaporate to incipient dryness. | |
| Elute 1 mL 0.25 N HCl and discard. Repeat 2 further times for a cumulative 3 mL of discarded 0.25 N HCl (Sm). | |
| Elute 1 mL 0.75 N HCl and discard. Repeat 3 further times for a cumulative 4 mL of discarded 0.75 N HCl (HREE). | |
| Elute 1 column volume mQ H2O and discard. | |
| Elute 1 column volume 0.2 5N HCl and discard. | |
| Fill column with 0.2 5N HCl so that liquid level in the column is higher than liquid level in the storage container, and return used column to storage in 0.25 N HCl. |
Table S-2 Tabulated HSE blank concentrations and percent blank contributions to samples.
| Os (ng) | Ir (ng) | Ru (ng) | Pt (ng) | Pd (ng) | Re (ng) | 187Os/188Os | ||
| B6-4 | 0.131 | 0.081 | 0.029 | 0.049 | 0.054 | |||
| B6-8 | 0.125 | 0.072 | 0.024 | 0.055 | 0.100 | |||
| B8-4 | 0.090 | 0.028 | 0.010 | 0.065 | ||||
| B9-4 | 0.077 | 0.026 | 0.012 | 0.058 | 0.033 | |||
| B9-8 | 0.088 | 0.029 | 0.007 | 0.038 | ||||
| B10-4 | 0.075 | 0.086 | 0.011 | 0.083 | 0.046 | |||
| B12-1 | 0.097 | 0.039 | 0.014 | 0.094 | 0.049 | |||
| B12-2 | 0.003 | 0.092 | 0.015 | 0.012 | 0.063 | 0.021 | ||
| B12-3 | 0.099 | 0.018 | 0.016 | 0.057 | 0.020 | |||
| B12-4 | 0.004 | 0.137 | 0.014 | 0.011 | 0.073 | 0.021 | ||
| B12-5 | 0.004 | 0.150 | 0.020 | 0.015 | 0.063 | 0.022 | 0.683 | |
| B14-4 | 0.001 | 0.168 | 0.040 | 0.031 | 0.022 | 0.025 | 0.231 | |
| B15-4 | 0.001 | 0.164 | 0.382 | 0.046 | 0.014 | 0.035 | 0.310 | |
| B16-4 | 0.001 | 0.202 | 0.037 | 0.019 | 0.013 | 0.015 | 0.255 | |
| B17-4 | 0.001 | 0.177 | 0.052 | 0.034 | 0.022 | 0.022 | 0.325 | |
| B18-4 | 0.003 | 0.164 | 0.525 | 0.024 | 0.023 | 0.018 | 0.137 | |
| *Many Os blanks reflected inefficient spike equilibration and were consequently discarded | ||||||||
| Os (ng) | Ir (ng) | Ru (ng) | Pt (ng) | Pd (ng) | Re (ng) | 187Os/188Os | 1 St.Dev. | |
| Average blank | 0.002 | 0.127 | 0.092 | 0.020 | 0.050 | 0.034 | 0.32 | 0.19 |
| Sample: | Os (%) | Ir (%) | Ru (%) | Pt (%) | Pd (%) | Re (%) | ||
| DC14-01F | 55.3 | 14.7 | 20.0 | 5.2 | ||||
| DC14-02 | 0.8 | 28.9 | 23.5 | 3.5 | 8.5 | 23.6 | ||
| DC14-05 | 0.3 | 8.5 | 6.3 | 2.7 | 9.2 | 11.8 | ||
| DC14-09 | 0.3 | 9.6 | 15.2 | 0.4 | 1.3 | |||
| DC14-10A | 0.3 | 11.7 | 15.9 | 0.5 | 2.1 | 3.4 | ||
| DC14-10B | 0.4 | 10.2 | 19.2 | 0.5 | 1.7 | 3.7 | ||
| DC14-10B | 0.3 | 10.3 | 17.0 | 0.5 | 2.7 | 2.3 | ||
| DC14-10B | 0.3 | 11.5 | 19.8 | 0.5 | 2.2 | 2.3 | ||
| DC14-10B | 0.2 | 8.3 | 15.4 | 0.4 | 1.3 | 0.7 | ||
| DC14-10B | 11.0 | 19.7 | 0.5 | 2.5 | 2.7 | |||
| DC14-15 | 10.7 | 65.9 | 0.3 | 0.4 | 5.3 | |||
| DC14-15 | 6.2 | 48.3 | 0.3 | 0.4 | 2.9 | |||
| DC14-19 | 0.7 | 28.6 | 26.3 | 0.5 | 1.4 | 4.0 | ||
| DC14-20 | 0.7 | 14.8 | 12.7 | 0.3 | 0.8 | 9.6 | ||
| DC14-21 | 2.6 | 52.9 | 37.8 | 0.4 | 2.1 | 4.5 | ||
| DC14-28 | 33.7 | 41.6 | 25.1 | 9.9 | 19.9 | |||
| DC14-30 | 0.8 | 14.1 | 33.4 | 0.3 | 1.0 | 6.6 | ||
| DC14-31A | 0.3 | 9.5 | 12.7 | 0.2 | 0.4 | 7.9 | ||
| DC14-36 | 1.4 | 21.6 | 18.1 | 0.4 | 2.0 | 6.1 | ||
| DC14-38 | 1.1 | 18.4 | 17.3 | 0.4 | 1.3 | 7.8 | ||
| DC14-38 | 1.0 | 21.3 | 16.1 | 0.4 | 1.8 | 7.0 | ||
| DC14-39 | 33.1 | 53.7 | 84.2 | 18.9 | 4.3 | |||
| DC14-39 | 37.7 | 48.0 | 5.4 | |||||
| DC14-46A | 1.7 | 33.6 | 42.4 | 1.7 | 12.1 | 2.9 | ||
| DC14-46A | 1.6 | 38.4 | 46.7 | 1.6 | 12.9 | 2.5 | ||
| DC14-46B | 1.9 | 57.1 | 58.0 | 1.8 | 14.0 | 3.3 | ||
| DC14-46C | 0.3 | 43.4 | 54.8 | 1.8 | 11.8 | 10.4 | ||
| DC14-47B | 1.2 | 37.2 | 48.6 | 2.2 | 7.4 | 20.8 | ||
| DC14-47B | 0.6 | 47.2 | 84.4 | 2.9 | 5.6 | 16.4 | ||
| DC14-47A | 7.9 | 45.1 | 79.0 | 2.1 | 6.3 | 2.1 | ||
| DC14-53 | 2.1 | 31.9 | 59.5 | 0.6 | 3.6 | 24.4 | ||
| DC14-59 | 22.4 | 7.8 | 11.2 | 2.5 | ||||
| DC14-63 | 33.5 | 26.4 | 23.3 | 4.9 | ||||
| DC14-68 | 9.6 | 48.8 | 0.8 | 1.1 | 3.3 | |||
| DC14-69 | 0.4 | 10.0 | 18.0 | 0.4 | 2.0 | 8.0 | ||
| DC14-71 | 1.0 | 42.5 | 33.4 | 0.7 | 1.9 | 4.0 | ||
| DC14-72 | 0.9 | 27.9 | 44.8 | 0.5 | 2.2 | 5.6 | ||
| DC14-75 | 1.9 | 92.3 | 7.6 | 35.9 | 5.6 | |||
| DC14-77 | 0.3 | 17.6 | 19.6 | 0.4 | 3.1 | 4.8 | ||
| DC14-77 | 0.5 | 14.9 | 20.3 | 0.4 | 1.4 | 1.1 | ||
| DC14-77 | 0.4 | 15.1 | 21.1 | 0.4 | 1.7 | 5.9 | ||
| DC14-78 | 0.6 | 12.9 | 16.7 | 0.4 | 1.7 | 7.5 | ||
| DC14-79 | 6.3 | 70.6 | 88.0 | 1.3 | 3.3 | 0.9 | ||
| DC14-80 | 1.8 | 26.4 | 65.0 | 1.7 | 4.1 | 0.0 | ||
| DC14-82 | 0.2 | 5.6 | 17.1 | 0.4 | 1.1 | 3.9 | ||
| DC14-83B | 0.5 | 18.9 | 27.8 | 1.6 | 2.8 | 4.2 | ||
| DC14-83B | 1.1 | 20.9 | 32.4 | 1.6 | 4.4 | 1.0 | ||
| DC14-83B | 0.7 | 20.0 | 32.8 | 1.7 | 3.1 | 4.2 | ||
| DC14-84A | 1.4 | 20.4 | 45.5 | 0.4 | 1.1 | 3.3 | ||
| DC14-85 | 1.3 | 13.7 | 34.5 | 0.3 | 1.0 | 3.7 | ||
| DC14-96 | 0.2 | 17.9 | 33.0 | 0.8 | 2.9 | 3.9 | ||
| DC14-96 | 0.9 | 36.6 | 33.1 | 0.8 | 2.1 | 3.2 | ||
| DC14-97 | 0.8 | 52.2 | 35.5 | 0.7 | 2.4 | 4.1 | ||
| DC14-99 | 12.9 | 39.9 | 0.8 | 1.3 | 4.6 | |||
| DC14-103 | 4.7 | 36.8 | 0.8 | 0.9 | 7.0 | |||
| DC14-108 | 8.6 | 37.9 | 1.0 | 0.8 | 2.5 | |||
| DC14-110 | 0.9 | 25.1 | 44.3 | 0.6 | 0.9 | 5.7 | ||
| DC14-111 | 14.8 | 44.0 | 1.0 | 0.5 | 3.0 | |||
| MMF7 | 86.6 | 48.8 | 21.5 | 32.1 | 7.8 | |||
| MMF7 | 2.3 | 42.3 | 21.7 | 7.9 | ||||
Table S-3 Geochemical and isotopic data (Table S-3 is available for download as an Excel file below).
Table S-4 Modelling parameters.
| 87Sr/86Sr | Range | [Sr] | 143Nd/144Nd | Range | [Nd] | 187Os/188Os | Range | [Os] | References | |
| Réunion | 0.7041891 | 0.704-0.70425 | 57.24 | 0.5128531 | 0.5128-0.5129 | 35 | 0.1324 | 0.1310-0.1338 | 1.01 | Peters et al. (2016). GEOROC (accessed 13 January 2017) |
| Upper Continental Crust | 0.72715 | 0.725-0.735 | 284 | 0.510556 | 0.51035-0.5111 | 4.6 | 1.2 | 0.196-1.2 | 0.001 - 0.004 | Ray et al. (2008). Peucat et al. (1989. 2013). Asmerom and Walker (1998) |
| Lower Continental Crust | 0.70264 | 0.702-0.712 | 989 | 0.5106 | 0.51035-0.5117 | 13.7 | 0.83335 | 0.196-1.2 | 0.001 - 0.004 | Peucat et al. (1989. 2013). Asmerom and Walker (1998) |
| Continental Lithospheric Mantle | 0.70255 | 0.702-0.7045 | 3252 | 0.512777 | 0.5133-0.5124 | 1.252 | 0.113 | 0.105-0.120 | 3.4 | Aulbach et al. (2016); McBride et al. (1996) |
| Depleted MORB Mantle | | | | 0.51321 | 0.5125-0.5135 | 8 | 0.125 | 0.1218-0.1274 | 3 | Snow and Reisberg (1995); Roy-Barman et al. (1998) |
Notes:
1 Elemental concentrations projected from MgO versus element plots assembled from listed references; isotopic ratios projected from element versus isotope ratio plots assembled from listed references (Supplementary Information).
2 Estimated concentrations to match appropriate R values as discussed in the literature.
3 Representing Archean-aged CLM.
Table S-5 Data used for initial 187Os/188Os calculation filtered from Table S-3 (second tab in the Excel version of Table S-5, available for download below).
| Filter parameters | ||||||||
| Filtering ranges can be adjusted to test effect on initial | ||||||||
| MgO | wt. % | LOI | wt. % | 187Re/188Os | 187Os/188Os | |||
| min. | 6 | min. | 0 | min. | 0 | min. | 0.125 | |
| max. | 15 | max. | 2.5 | max. | 100 | max. | 1.000 | |
| Remarks: | Avoids highly differentiated and olivine-accumulative samples | Avoids highly altered samples | Avoids samples that experienced significant crustal assimilation | Avoids samples that experienced significant lithospheric or crustal assimilation | ||||
| Initial calculation | ||||||||
| Filtered samples | ||||||||
| nsamples | 15 | |||||||
| nmeasurements | 21 | |||||||
| Isochron method (least-squares) | Weighted initial (t = 65 Ma) | |||||||
| 187Os/188Os (i) | 0.1337 | 187Os/188Os (i) | 0.1332 | |||||
| Max | 0.1365 | Max | 0.1333 | |||||
| Min | 0.1308 | Min | 0.1331 | |||||
| 95 % c.i. | 0.0028 | 95 % c.i. | 0.0001 | |||||
| Isochron method (Isoplot / York) | ||||||||
| 187Os/188Os (i) | 0.1336 | This result is static and will not automatically update. It is based on initial filtering conditions: 6 < MgO wt. % < 14, LOI < 2.5 wt. %. 187Re/188Os < 100, 0.125 < 187Os/188Os < 1. | ||||||
| Max | 0.1367 | |||||||
| Min | 0.1305 | |||||||
| | 2σ s.d. | 0.0031 | ||||||
| Filtered samples | ||||||||
| Sample name | MgO (wt. %) | LOI (wt. %) | 187Re/188Os | 2σ | 187Os/188Os | 2σ | 187Os/188Os (T = 65 Ma) | 2σ |
| DC14-2 | 13.96 | 2.16 | 1.04 | 0.05 | 0.13271 | 0.00014 | 0.13158 | 0.00020 |
| DC14-9 | 8.68 | 1.9 | 4.47 | 0.22 | 0.13402 | 0.00009 | 0.12918 | 0.00033 |
| DC14-10A | 8.91 | 2.09 | 4.27 | 0.21 | 0.13511 | 0.00013 | 0.13048 | 0.00036 |
| DC14-10B | 8.93 | 2.03 | 4.13 | 0.21 | 0.13650 | 0.00007 | 0.13202 | 0.00030 |
| DC14-10B | 8.93 | 2.03 | 5.13 | 0.26 | 0.13553 | 0.00007 | 0.12997 | 0.00035 |
| DC14-10B | 8.93 | 2.03 | 6.19 | 0.31 | 0.13811 | 0.00010 | 0.13140 | 0.00044 |
| DC14-10B | 8.93 | 2.03 | 0.72 | 0.04 | 0.13910 | 0.00010 | 0.13832 | 0.00014 |
| DC14-15 | 6.76 | 1.79 | 91.43 | 4.57 | 0.23546 | 0.00085 | 0.13635 | 0.00581 |
| DC14-15 | 6.76 | 1.79 | 94.85 | 4.74 | 0.24480 | 0.00043 | 0.14198 | 0.00557 |
| DC14-15 | 6.76 | 1.79 | 7.80 | 0.39 | 0.14104 | 0.00034 | 0.13258 | 0.00076 |
| DC14-20 | 9.37 | 1.17 | 2.80 | 0.14 | 0.13260 | 0.00010 | 0.12957 | 0.00025 |
| DC14-30 | 9.36 | 2.34 | 5.02 | 0.25 | 0.13459 | 0.00046 | 0.12914 | 0.00074 |
| DC14-31A | 11.22 | 1.44 | 1.56 | 0.08 | 0.12870 | 0.00008 | 0.12701 | 0.00016 |
| DC14-46A | 8.52 | 2.04 | 24.84 | 1.24 | 0.16199 | 0.00019 | 0.13506 | 0.00154 |
| DC14-46A | 8.52 | 2.04 | 27.70 | 1.39 | 0.16652 | 0.00018 | 0.13649 | 0.00168 |
| DC14-46B | 8.42 | 2.49 | 23.32 | 1.17 | 0.16558 | 0.00035 | 0.14030 | 0.00161 |
| DC14-53 | 8.37 | 1.18 | 2.85 | 0.14 | 0.15066 | 0.00079 | 0.14757 | 0.00094 |
| DC14-71 | 6.96 | 2.43 | 10.30 | 0.52 | 0.14046 | 0.00014 | 0.12930 | 0.00070 |
| DC14-82 | 12.9 | 1.91 | 2.27 | 0.11 | 0.14064 | 0.00006 | 0.13818 | 0.00018 |
| DC14-84A | 7.55 | 1.82 | 17.83 | 0.89 | 0.16297 | 0.00014 | 0.14364 | 0.00111 |
| DC14-85 | 8.38 | 1.9 | 14.76 | 0.74 | 0.15907 | 0.00015 | 0.14307 | 0.00095 |
Supplementary Information References
Asmerom, Y., Walker, R.J. (1998) Pb and Os isotopic constraints on the composition and rheology of the lower crust. Geology 42, 1197–1218.
Aulbach, S., Mungall, J.E., Pearson, D.G. (2016) Distribution and processing of highly siderophile elements in cratonic mantle lithosphere. Reviews in Mineralogy and Geochemistry 81, 239–304.
Beattie, P. (1994) Systematics and energetics of trace-element partitioning between olivine and silicate melts: Implications for the nature of mineral/melt partitioning. Chemical Geology 117, 57–71.
Becker, H., Horan, M.F., Walker, R.J., Gao, S., Lorand J.-P., Rudnick R.L. (2006) Highly siderophile element composition of the Earth’s primitive upper mantle: constraints rom new data on peridotite massifs and xenoliths. Geochimica et Cosmochimica Acta 70, 4528–4550.
Bindeman, I., Davis, A. (2000) Trace element partitioning between plagioclase and melt: Investigation of dopant influence on partition behavior. Geochimica et Cosmochimica Acta 64, 2863–2878.
Birck, J.-L., Roy-Barman M., Capmas, F. (1997) Re-Os isotopic measurements at the femtomole level in natural samples. Journal of Geostandards and Geoanalysis 21, 19–27.
Boyd, F.R, Mertzman, S.A. (1987) Composition and structure of the Kaapvaal lithosphere, southern Africa. In: Mysen, B.O. (Ed.) Magmatic Processes: Physicochemical Principles. The Geochemical Society, Special Publication No. 1. The Geochemical Society, Washington, D.C., 13–24.
Boyet, M., Carlson, R.W. (2006) A new geochemical model for the Earth’s mantle inferred from 146Sm-142Nd systematics. Earth and Planetary Science Letters 250, 254–268.
Cohen, A.S., Waters, F.G. (1996) Separation of osmium from geological materials by solvent extraction for analysis by thermal ionization mass spectrometry. Analytica Chimica Acta 332, 269–275.
Cox, K.G., Hawkesworth, C.J. (1985) Geochemical stratigraphy of the Deccan Traps at Mahabaleshwar, Western Ghats, India, with implication for open system magmatic processes. Journal of Petrology 26, 355–377.
Dale, C.W., Pearson, D.G., Starkey, N.A., Stuart, F.M., Ellam, R.M., Larsen, L.M., Fitton, J.G., Macpherson, C.G. (2009) Osmium isotopes in Baffin Island and West Greenland picrites: Implications for the 187Os/188Os composition of the convecting mantle and the nature of high 3He/4He mantle. Earth and Planetary Science Letters 278, 267–277.
Day, J.M.D. (2013) Hotspot volcanism and highly siderophile elements. Chemical Geology 341, 60–74.
Day, J.M.D., Pearson, D.G., Hulbert, L.J. (2013) Highly siderophile lement behavior during flood basalt genesis and evidence for melts from intrusive chromitite formation in the Mackenzie large igneous province: Lithos 182–183, 242–258.
Day, J.M.D., Peters, B.J., Janney, P.E. (2014) Oxygen isotope systematics of South African olivine melilitites and implications for HIMU mantle reservoirs. Lithos 202–203, 76–84.
Day, J.M.D., Waters, C.L., Schaefer, B.F., Walker R.J., Turner, S. (2016) Use of hydrofluoric acid desilicification in the determination of highly siderophile element abundances and Re-Pt-Os isotope systematics in mafic-ultramafic rocks. Geostandards and Geoanalytical Research 40, 49–65.
DiMuro, A., Metrich, N., Vergani, D., Rosi, M., Armienti, P., Fougeroux, T., Deloule, E., Arienzo, I., Civetta, L. (2014) The shallow plumbing system of Piton de la Fournaise volcano (La Reunion Island, Indian Ocean) revealed by the major 2007 caldera-forming eruption. Journal of Petrology 55, 1287–1315.
Esser, B.K., Turekian, K.K. (1993) The osmium isotopic composition of the continental crust. Geochimica et Cosmochimica Acta 57, 3093–3104.
Gibson, S.A., Thompson, R.N., Dickin, A.P., Leonardos, O.H. (1995) High-Ti and low-Ti mafic potassic magmas: Key to plume-lithosphere interactions and continental flood-basalt genesis. Earth and Planetary Science Letters 136, 149–165.
Gupta, M.L., Sundar, A., Sharma, S.R. (1991) Heat flow and heat generation in the Archaean Dharwar cratons and implications for the southern Indian shield geotherm and lithospheric thickness. Tectonophysics 194, 107–122.
Gupta, S., Rai, S.S., Prakasam, K.S., Srinagesh, D., Chadha, R.K., Prisetley K., Gaur, V.K. (2003) First evidence for anomalous thick crust between the mid-Archean western Dharwar craton. Current Science 84, 1219–1226.
Huang, S., Frey, F.A., Blichert-Toft, J., Fodor, R.V., Bauer G.R., Xu, G. (2005) Enriched components in the Hawaiian plume: Evidence from Kahoolawe Volcano, Hawaii. Geochemistry, Geophysics, Geosystems 6, doi: 10.1029/2005GC001012.
Ireland, T.J., Walker, R.J., Brandon, A.D. (2011) 186Os-187Os systematics of Hawaiian picrites revisited: New insights into Os isotopic variations in ocean island basalts. Geochimica et Cosmochimica Acta 75, 4456–4475.
Jamais, M., Lassiter, J.C., Brügmann, G. (2008) PGE and Os-isotopic variations in lavas from Kohala Volcano, Hawaii: constraints on PGE behavior and melt/crust interaction. Chemical Geology 250, 16–28.
Jay, A.E., Widdowson, M. (2008) Stratigraphy, structure and volcanology of the SE Deccan continental flood basalt province: implications for eruptive extent and volumes. Journal of the Geological Society 165, 177–188.
Kaila, K.L. (1986) Tectonic framework of Narmada-Son Lineament – a continental rift system in central India from deep seismic soundings. In: Barazangi, M., Brown, L. (Eds.) Reflection seismology: a global perspective. American Geophysical Union, Washington, D.C., 133–150.
Keays, R.R., Lightfoot, P.C. (2007) Siderophile and chalcophile metal variations in Tertiary picrites and basalts from West Greenland with implications for the sulphide saturation history of continental flood basalt magmas. Mineralium Deposita 40, 451–472.
Keays, R.R., Lightfoot, P.C. (2010) Crustal sulfur is required to form magmatic Ni-Cu sulfide deposits: evidence from chalcophile element signatures of Siberian and Deccan Trap basalts. Mineralium Deposita 45, 241–257.
Lightfoot, P.C., Hawkesworth C.J., Sethna, S.F. (1987) Petrogenesis of rhyolites and trachytes from the Deccan Trap: Sr, Nd and Pb isotope and trace element evidence. Contributions to Mineralogy and Petrology 95, 44–54.
Lightfoot, P., Hawkesworth, C. (1988) Origin of Deccan Trap lavas: evidence from combined trace element and Sr-, Nd- and Pb-isotope studies. Earth and Planetary Science Letters 91, 89–104.
Lightfoot, P.C., Hawkesworth, C.J., Devey, C.W., Rogers N.W., Van Calsteren, P.W.C. (1990) Source and differentiation of Deccan Trap lavas: Implications of geochemical and mineral chemical variations. Journal of Petrology 31, 1165–1200.
Mahoney, J., Macduogall, J.D., Lugmair, G.W., Murali, A.V., Sankar Das, M., Gopalan, K. (1982) Origin of the Deccan Trap flows at Mahabaleshwar inferred from Nd and Sr isotopic and chemical evidence. Earth and Planetary Science Letters 60, 47–60.
Mahoney, J.J., Macdougall, J.D., Lugmair, G.W., Gopalan K., Krishnamurthy, P. (1985) Origin of contemporaneous tholeiitic and K-rich alkalic lavas: a case study from the northern Deccan Plateau, India. Earth and Planetary Science Letters 72, 39–53.
Mahoney, J.J., Sheth, H.C., Chandrasekharam D., Peng, Z.X. (2000) Geochemistry of flood basalts of the Toranmal Section, northern Deccan Traps, India: Implications for regional Deccan stratigraphy. Journal of Petrology 41, 1099–1120.
McBride, J.S., Lambert, D.D., Greig, A., Nicholls, I.A. (1996) Multistage evolution of Australian subcontinental mantle: Re-Os isotopic constraints from Victorian mantle xenoliths. Geology 24, 631–634.
McDonough, W.F., Sun, S.-s. (1995) The composition of the Earth. Chemical Geology 120, 223–253.
Melluso, L., Sethna, S.F., D’Antonio, M., Javeri, P., Bennio, L. (2002) Geochemistry and petrogenesis of sodic and potassic mafic alkaline rocks in the Deccan Volcanic Province, Mumbai Area (India). Mineralogy and Petrology 74, 323–342.
Melluso, L., Mahoney J.J., Dallai, L. (2006) Mantle sources and crustal input as recorded in high-Mg Deccan Traps basalts of Gujarat (India). Lithos 89, 259–274.
Nishimura, K. (2012) A mathematical model of trace element and isotopic behavior during simultaneous assimilation and imperfect fractional crystallization. Contributions to Mineralogy and Petrology 164, 427–440.
Peng, Z.X., Mahoney, J., Hooper, P., Harris, C., Beane, J. (1994) A role for lower continental crust in flood basalt genesis? Isotopic and incompatible element study of the lower six formation of the western Deccan Traps. Geochimica et Cosmochimica Acta 58, 267–288.
Peng, Z.X., Mahoney, J.J. (1995) Drillhole lavas from the northwestern Deccan Traps, and the evolution of the Réunion hotspot mantle. Earth and Planetary Science Letters 134, 169–185.
Peng, Z.X., Mahoney, J.J., Hooper, P.R., Macdougall, J.D., Krishnamurthy, P. (1998) Basalts of the northeastern Deccan Traps, India: Isotopic and elemental geochemistry and relation to the southwestern Deccan stratigraphy. Journal of Geophysical Research 103, 29843–29865.
Peters, B.J., Day, J.M.D., Taylor, L.A. (2016) Early mantle heterogeneities in the Réunion hotspot source inferred from highly siderophile elements in cumulate xenoliths. Earth and Planetary Science Letters 448, 150–160.
Peucat, J.-J., Vidal, P., Bernard-Griffiths J., Condie, K.C. (1989) Sr, Nd and Pb isotopic systematics in Archean low- to high-grade transition zone of southern India: Syn-accretion vs. post-accretion granulites. The Journal of Geology 97, 537–549.
Peucat, J.-J., Jayananda, M., Chardon, D., Capdevila, R., Fanning, C.M., Paquette, J.-L. (2013) The lower crust of the Dharwar Craton, southern India: patchwork of Archean granulitic domains. Precambrian Research 227, 4–28.
Peucker-Ehrenbrink, B., Jahn, B.-M. (2001) Rhenium-osmium isotope systematics and platinum-group element concentrations: loess and the upper continental crust: Geochemistry, Geophysics, Geosystems 2, doi: 10.1029/2001GC000172.
Ray, R., Shukla, A.D., Sheth, H.C., Ray, J.S., Duraiswami, R.A., Vanderkluysen, L., Rautela, C.S., Mallik, J. (2008) Highly heterogeneous Precambrian basement under the central Deccan Traps, India: Direct evidence from xenoliths in dykes. Gondwana Research 13, 375–385.
Ren, Z.-Y., Ingle, S., Takahashi, E., Hirano N., Hirata, T. (2005) The chemical structure of the Hawaiian mantle plume. Nature 436, 837–840.
Richards, M.A., Alvarez, W., Self, S., Karlstrom, L., Renne, P.R., Manga, M., Sprain, C., Smit, J., Vanderkluysen, L., Gibson, S.A (2015) Triggering of the largest Deccan eruptions by the Chicxulub impact. Geological Society of America Bulletin 127, 1507–1520.
Rocha-Júnior, E.R.V., Puchtel, I.S., Marques, L.S., Walker, R.J., Machado, F.B., Nardy, A.J.R., Babinski, M., Figueiredo, A.M.G. (2012) Re-Os isotope and highly siderophile element systematics of the Paraná continental flood basalts (Brazil). Earth and Planetary Science Letters 337–338, 164–173.
Roy-Barman, M., Wasserburg, G.J., Papanastassiou D.A., Chaussidon, M. (1998) Osmium isotopic compositions and Re-Os concentrations in sulfide globules from basaltic glasses. Earth and Planetary Science Letters 154, 331–347.
Schaefer, B.F., Parkinson, I.J., Hawkesworth, C.J. (2000) Deep mantle plume osmium isotope signature from West Greenland Tertiary picrites. Earth and Planetary Science Letters 175, 105–118.
Sheth, H., Melluso, L. (2008) The Mount Pavagadh volcanic suite, Deccan Traps: geochemical stratigraphy and magmatic evolution. Journal of Asian Earth Sciences 32, 5–21.
Sheth, H.C., Zellmer, G.F., Demonterova. E.I., Ivanov, A.V., Kumar, R., Patel, R.K. (2014) The Deccan tholeiite lavas and dykes of Ghatkopar-Powai area, Mumbai, Panvel flexure zone: Geochemistry, stratigraphic status, and tectonic significance. Journal of Asian Earth Sciences 84, 69–82.
Simonetti, A., Goldstein, S.L., Schmidberger, S.S, Viladkar, S.G. (1998) Geochemical and Nd, Pb, and Sr isotope data from Deccan alkaline complexes – inferences for mantle sources and plume-lithosphere interaction. Journal of Petrology 39, 1847–1864.
Snow, J.E., Reisberg, L. (1995) Os isotopic systematics of the MORB mantle: results from altered abyssal peridotites: Earth and Planetary Science Letters 133, 411–421.
Stracke, A. (2012) Earth’s heterogeneous mantle: A product of convection-driven interaction between crust and mantle. Chemical Geology 330–331, 274–299.
Toutain, J.-P., Meyer, G. (1989) Iridium-bearing sublimates at a hot-spot volcano (Piton de la Fournaise, Indian Ocean). Geophysical Research Letters 16, 1391–1394.
Vanderkluysen, L., Mahoney, J.J., Hooper, P.R., Sheth, H.C., Ray, R. (2011) The feeder system of the Deccan Traps (India): Insights from dike geochemistry. Journal of Petrology 52, 315–343.
Weis, D., Garcia, M.O., Rhodes, J.M., Jellinek M., Scoates, J.S. (2011) Role of the deep mantle in generating the compositional asymmetry of the Hawaiian mantle plume. Nature Geoscience 4, 831–838.
Figures and Tables
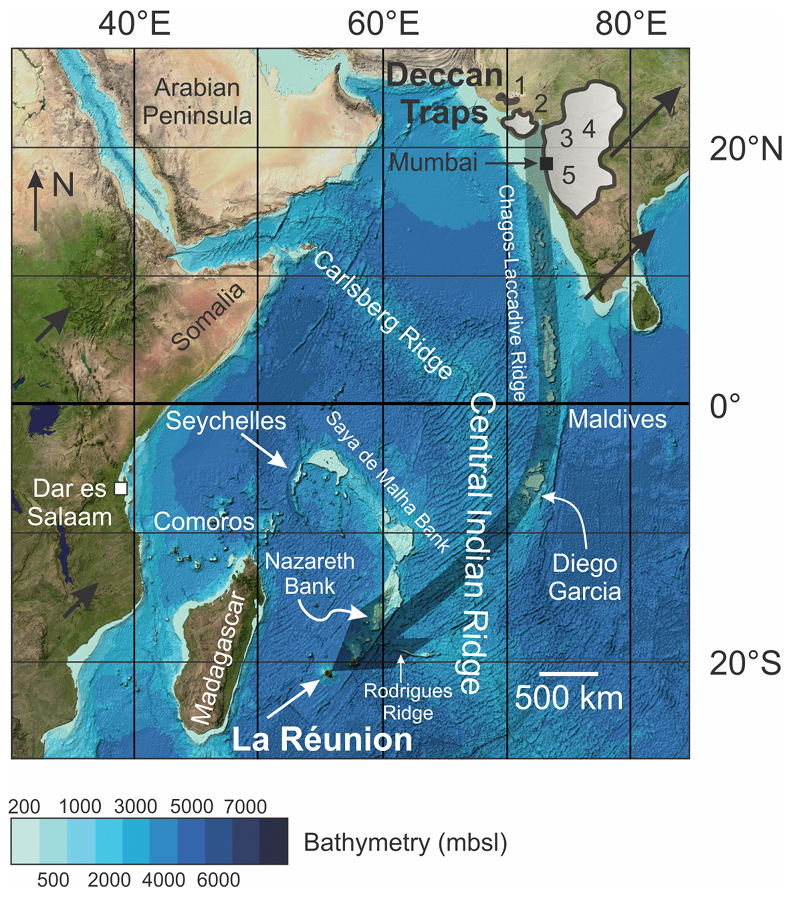
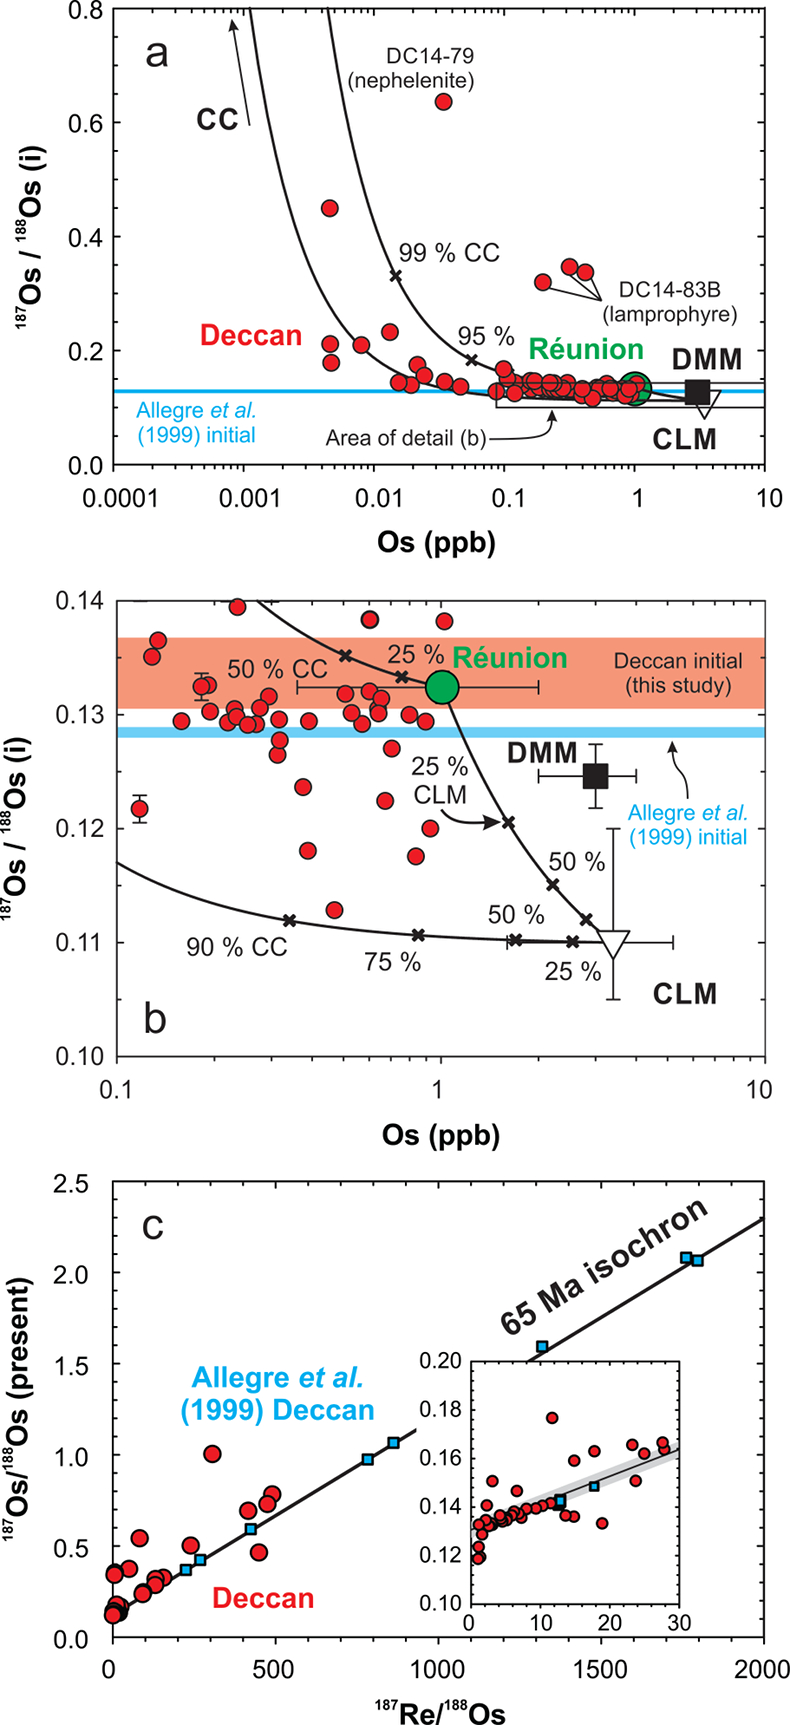
Figure 2 (a) 187Os/188Os versus [Os] for Deccan lavas (red circles), with inferred compositions of the Réunion primary magma (green circle) (Peters et al., 2016
Peters, B.J., Day, J.M.D., Taylor, L.A. (2016) Early mantle heterogeneities in the Réunion hotspot source inferred from highly siderophile elements in cumulate xenoliths. Earth and Planetary Science Letters 448, 150–160.
), crust (CC: continental crust) and lithosphere (DMM: depleted mid-ocean ridge basalt mantle, CLM: continental lithospheric mantle) and mixing lines. Initial 187Os/188Os reported in literature data (Allegre et al., 1999Allegre, C.J., Birck, J.L., Campas, F., Courtillot, V. (1999) Age of the Deccan traps using 187Re-187Os systematics. Earth and Planetary Science Letters 170, 197–204.
) shown as blue. (b) Small scale view of (a) showing end member compositions and uncertainties with initial 187Os/188Os calculated in this study (transparent red box with range indicated by bidirectional arrow) and in Allegre et al. (1999)Allegre, C.J., Birck, J.L., Campas, F., Courtillot, V. (1999) Age of the Deccan traps using 187Re-187Os systematics. Earth and Planetary Science Letters 170, 197–204.
(blue box with outline). (c) Rhenium-osmium isotopes for Deccan lavas in this study (red circles) and from Allegre et al. (1999)Allegre, C.J., Birck, J.L., Campas, F., Courtillot, V. (1999) Age of the Deccan traps using 187Re-187Os systematics. Earth and Planetary Science Letters 170, 197–204.
(blue squares), with inset for low Re samples. For reference, a 65 Ma isochron with initial 187Os/188Os = 0.1336 ± 0.0031, as determined from our samples, is shown. Uncertainty on the isochron is thinner than line thickness in panel (c) and is represented by the shaded region in the inset. A 65 Ma isochron corresponding to the initial 187Os/188Os determined by Allegre et al. (1999)Allegre, C.J., Birck, J.L., Campas, F., Courtillot, V. (1999) Age of the Deccan traps using 187Re-187Os systematics. Earth and Planetary Science Letters 170, 197–204.
is approximately equivalent to a line following the lower bound of the shaded region, given the precision noted in that study. Model end members are given in Table S-4.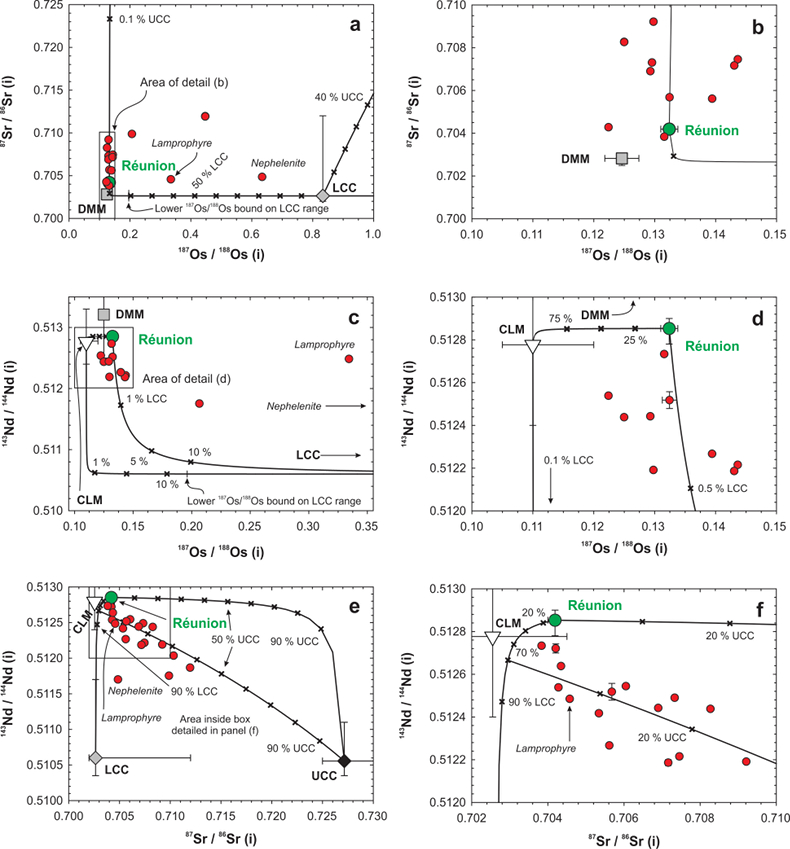
Back to article
Supplementary Figures and Tables
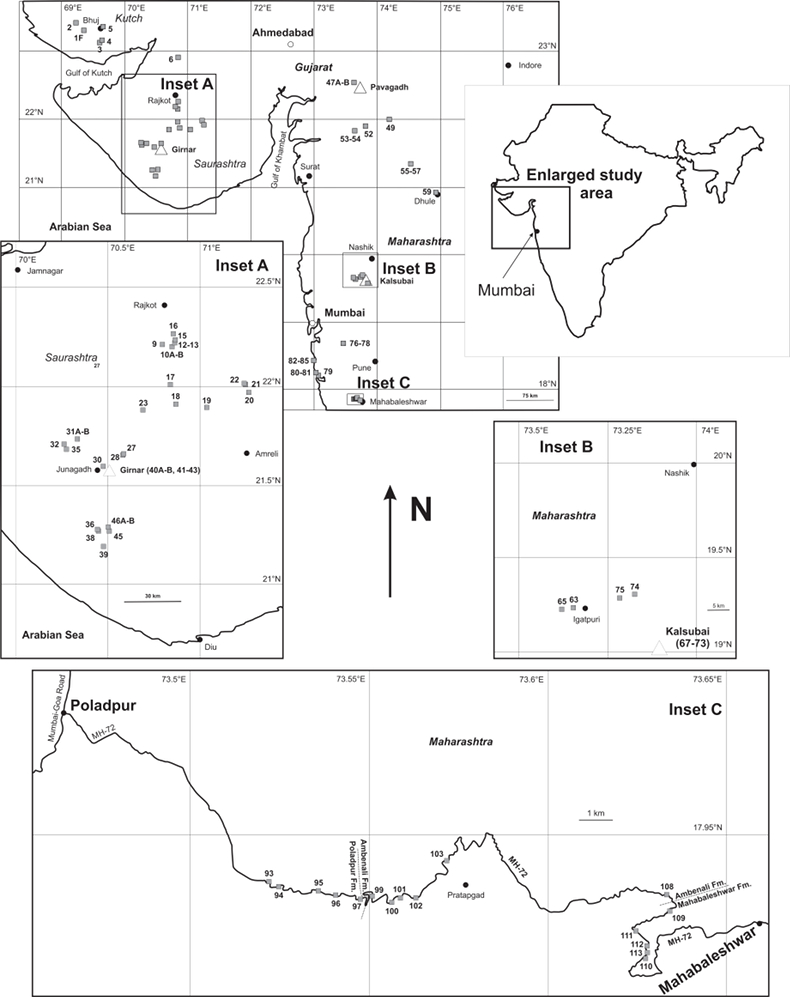
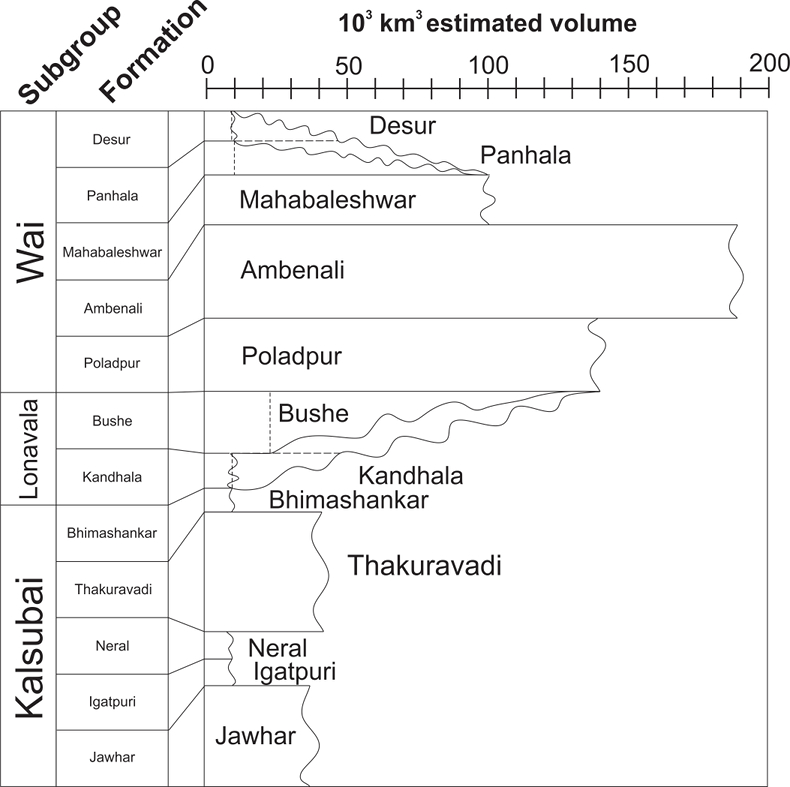
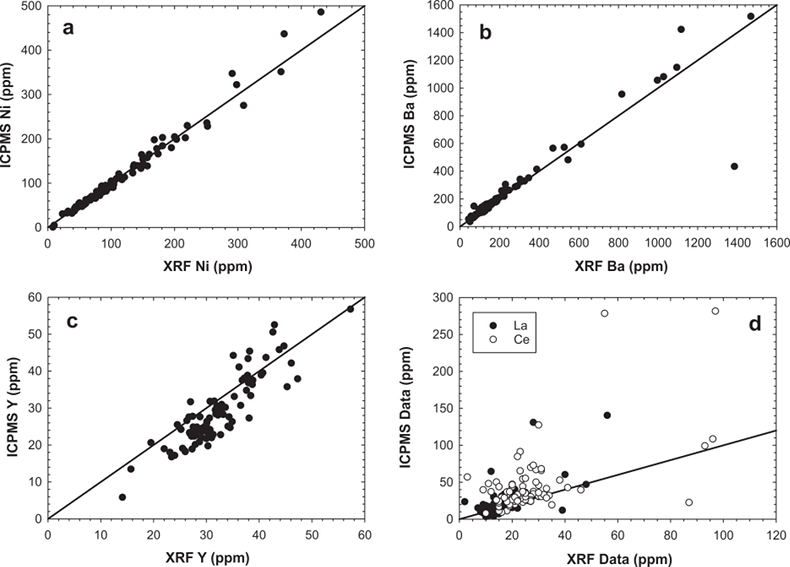
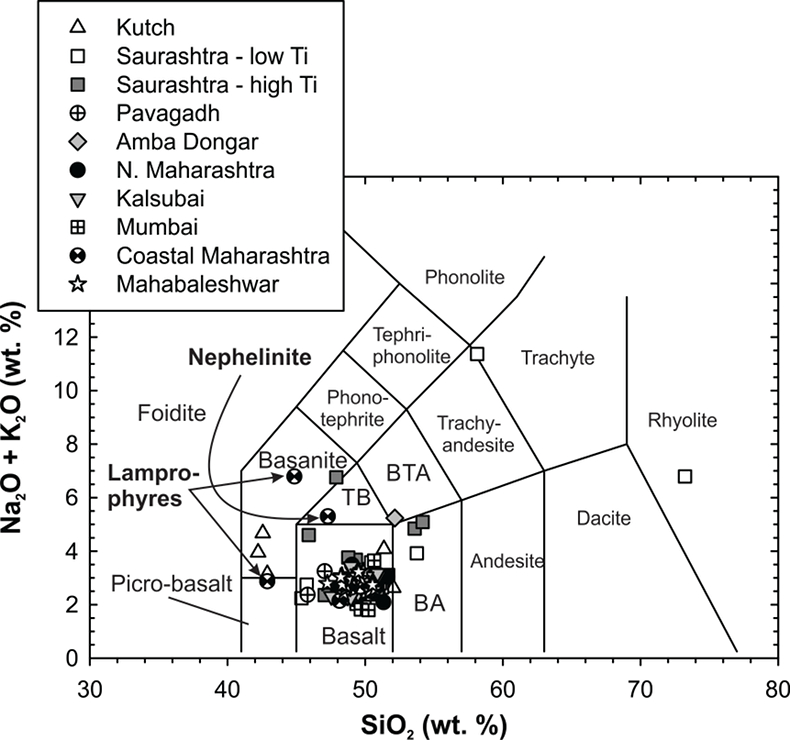
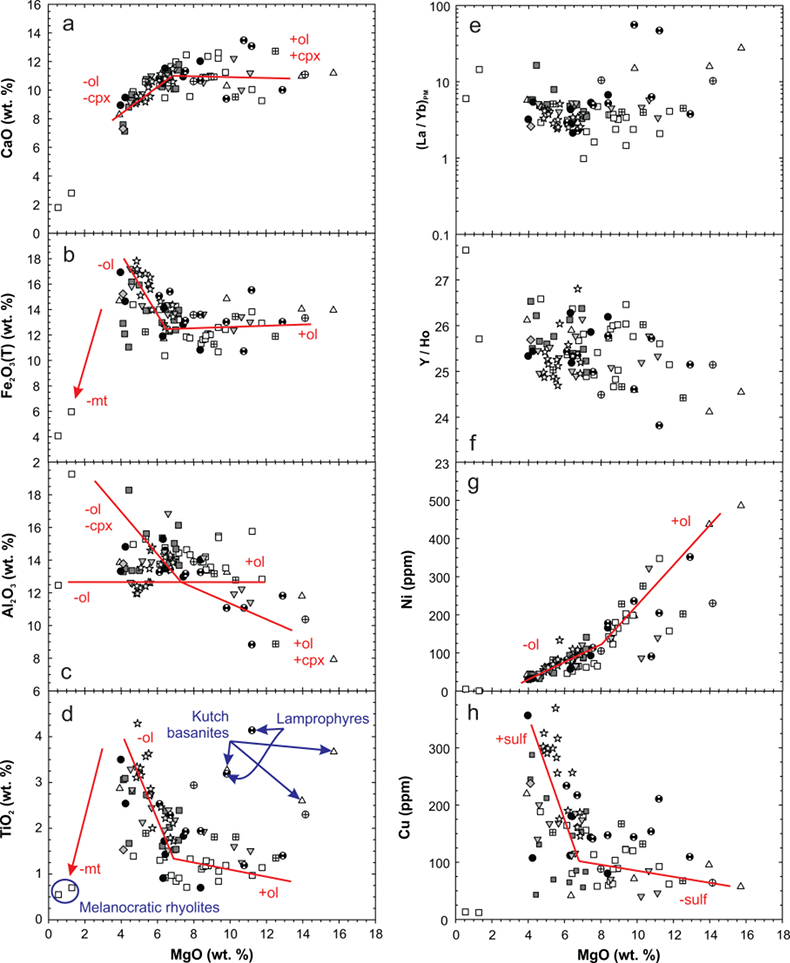
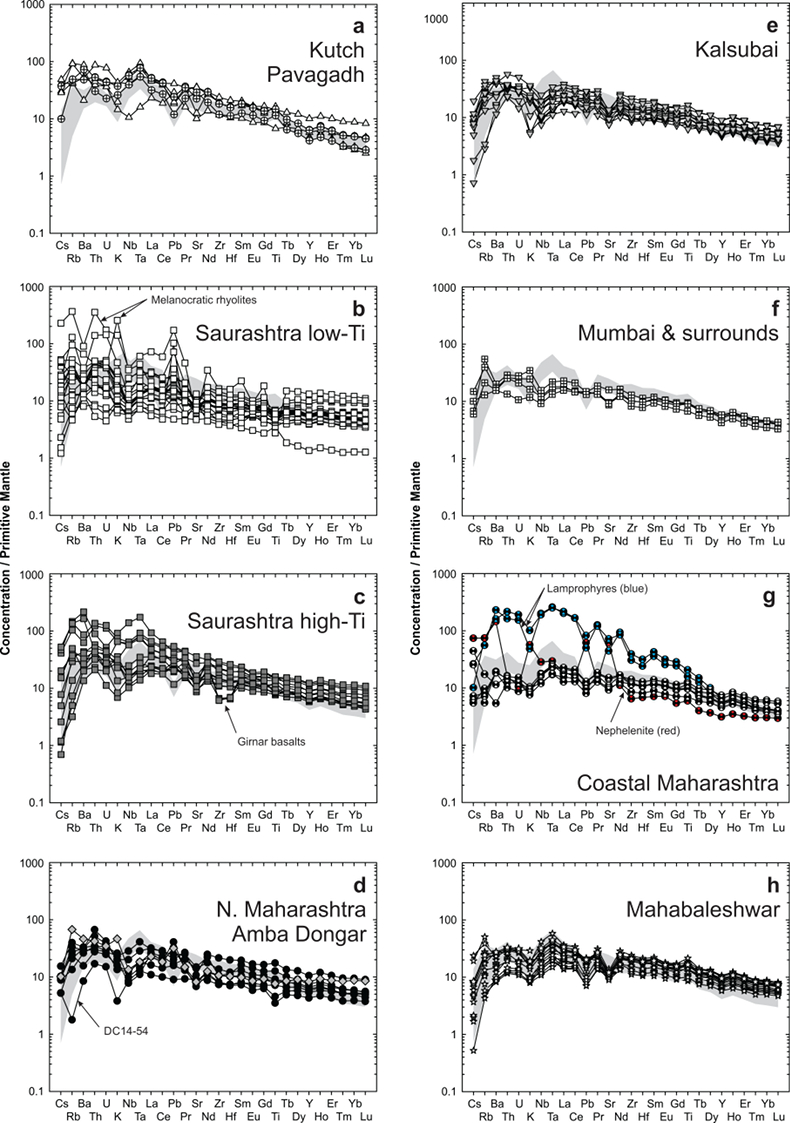
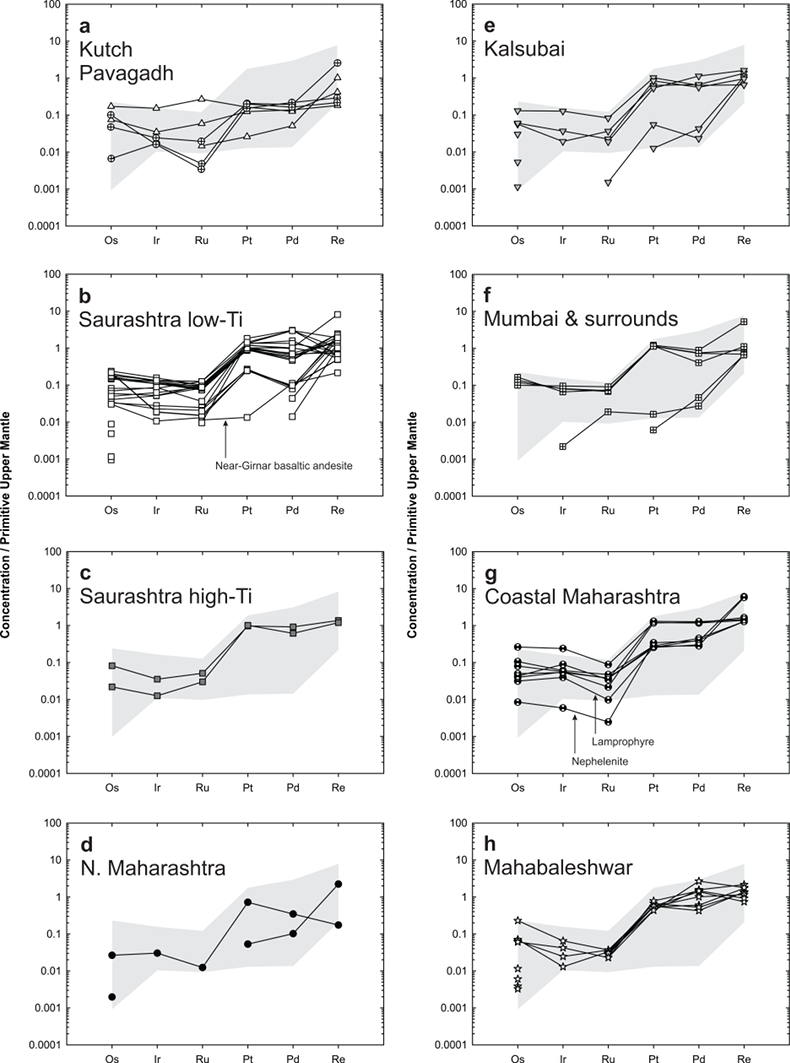

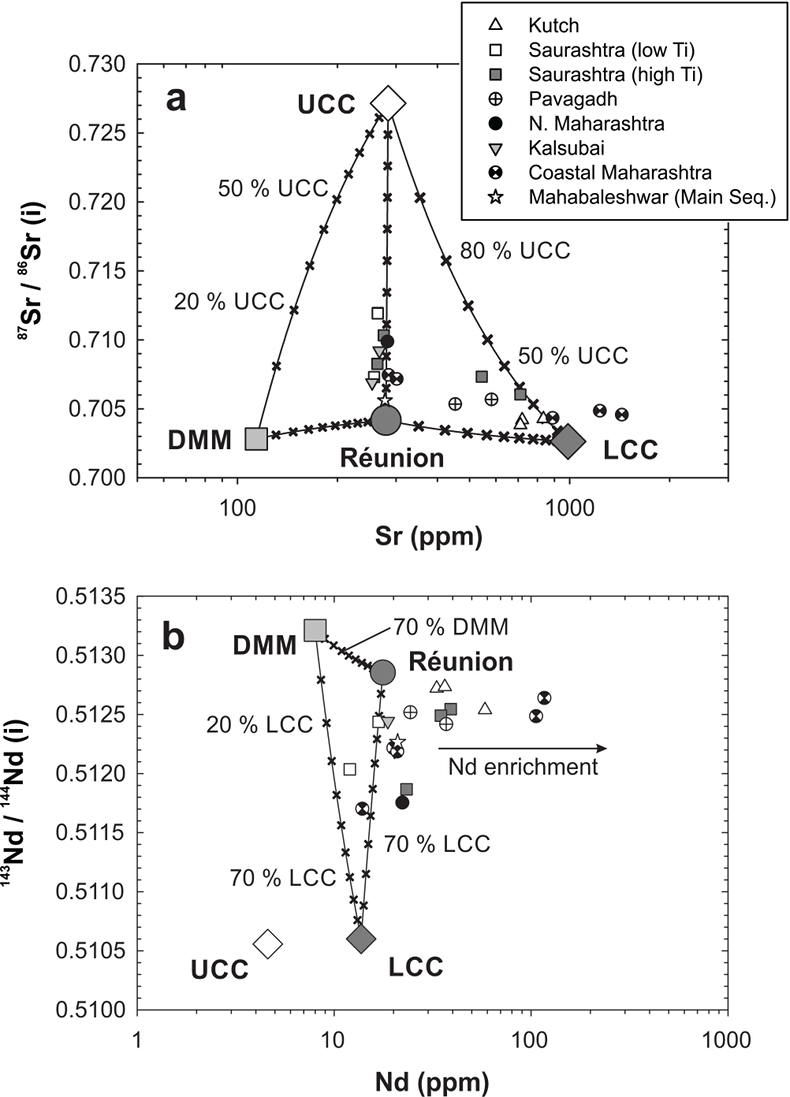
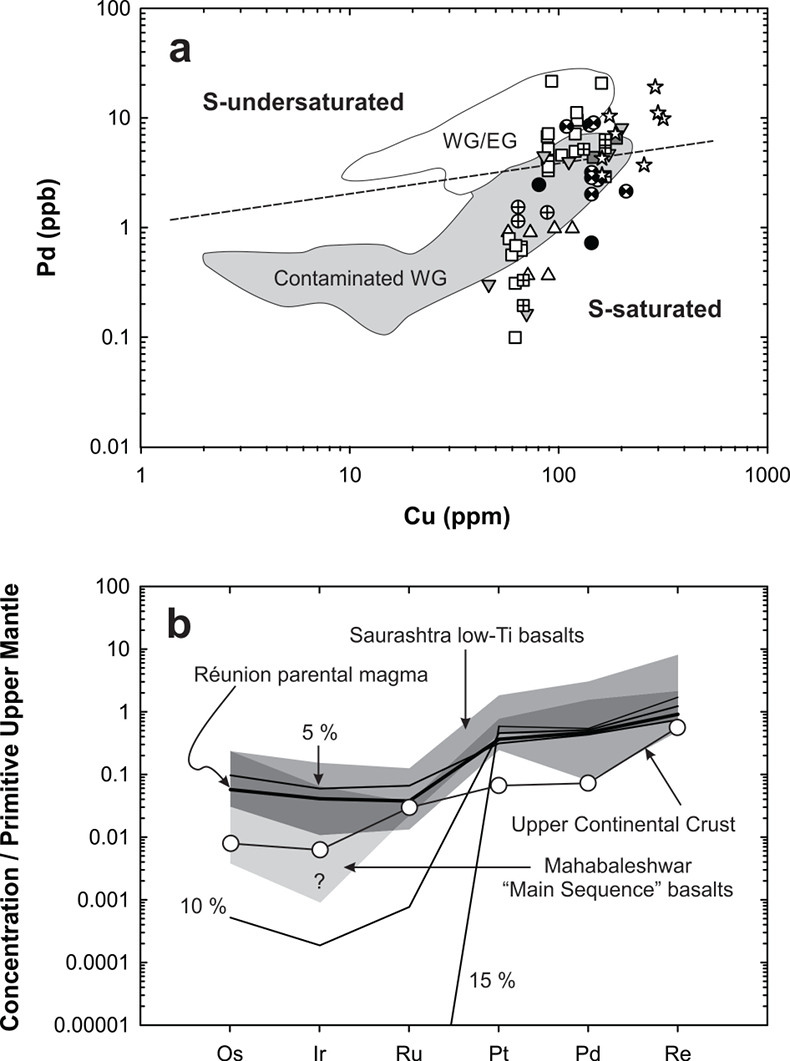
Table S-1 Unspiked Sr-Nd digestion and column procedure.
| √ | Digestion |
| Precisely weigh 0.100 grams homogenised rock powders into labelled 15 mL or 20 mL PFTE beakers. Adjust powder mass to achieve a target load of ca. 1 µL Sr and 500 ng Nd, but do not load more than 0.200 grams into a 15 mL beaker or 0.300 mL into a 20 mL beaker. | |
| Add 1 mL teflon distilled HNO3 per 0.100 grams rock powder to each beaker. | |
| Add 4 mL Optima HF per 0.100 grams rock powder to each beaker. | |
| Place tightly capped beakers on vented hotplate at 150 °C. Monitor for reaction between powder and acid; this should produce a yellowish, gaseous substance above the liquid in the beaker. Allow to flux for at least 72 hours. | |
| Carefully uncap beakers and evaporate to incipient dryness on a vented hotplate at a maximum temperature of 100 °C. Expect this drydown to take 10-12 hours for 5 mL acid at 100 °C. | |
| Add 2 mL teflon distilled HNO3 per 0.100 grams rock powder to each beaker. | |
| Place tightly capped beakers on vented hotplate at 120 °C. Allow to flux for at least 24 hours. | |
| Carefully uncap beakers and evaporate to incipient dryness on a vented hotplate at a maximum temperature of 100 °C. Expect this drydown to take 4-6 hours for 2 mL acid at 100 °C. | |
| Add 5 mL teflon distilled HCl per 0.100 grams rock powder to each beaker. | |
| Place tightly capped beakers on vented hotplate at 120 °C. Allow to flux for at least 24 hours. | |
| Carefully uncap beakers and evaporate to incipient dryness on a vented hotplate at a maximum temperature of 100 °C. Expect this drydown to take 10-12 hours for 5 mL acid at 100 °C. | |
| Add 2 mL 4 M HCl to each beaker. | |
| Place tightly capped beakers on vented hotplate at a maximum temperature of 100 °C for at least three hours to equilibrate sample with dilute acid. | |
| | If desired, extract a ca. 20 uL aliquot for trace element analysis on the ICP-MS. |
| Preliminary cation exchange column | |
| Prepare new columns with 1.5 mL AG50W-X8 resin, or take used columns from storage. With proper cleaning procedures, each column can be used about 10 times with no loss in functionality. | |
| Elute 1 column volume mQ H2O and discard. | |
| Elute 1 column volume 4 M HF and discard into HF-bearing waste container. | |
| Elute 1 column volume mQ H2O and discard. | |
| Elute 1 column volume 6 M HCl and discard into acid waste container. | |
| Elute 1 column volume mQ H2O and discard. | |
| Elute 5 mL 4 N HCl and discard into acid waste container. | |
| Load sample in 2 mL 4 M HCl and collect in 7 mL beaker (Hf-Pb cut) | |
| Elute 2 mL 2.5 N HCl-1 N HF and collect in same 7 mL beaker (Hf-Pb cut) | |
| Elute 20 mL 2.5 N HCl-1 N HF and collect in 20 mL beaker (Sr cut) | |
| Elute 1 column volume 2 N HNO3 and discard into acid waste container (LILE, including Ba). | |
| Elute 15 mL 6 N HCl and collect in 15 mL beaker (REE cut) | |
| Elute 1 column volume mQ H2O and discard. | |
| Elute 5 mL 4 N HCl and discard into acid waste container. | |
| Fill column with 4 N HCl so that liquid level in the column is higher than liquid level in the storage container, and return used column to storage. If the column has been used >10 times, discard the column. | |
| Place uncapped Hf-Pb, Sr and REE beakers on a vented hotplate and evaporate to incipient dryness at a maximum temperature of 100 °C. | |
| Take up Sr cut in 1 mL 4 N HNO3 and allow to equilibrate for at least three hours at a maximum temperature of 70 °C. | |
| | Leave REE cut at incipient dryness for now; do not take up in any liquid. |
| Sr column | |
| Prepare new columns with ca. 200 mg Sr-spec resin in a 1 mL pipette tip (ask for direction), or take used columns from storage. With proper cleaning procedures, each column can be reused with no loss in functionality. | |
| Elute 1 column volume mQ H2O and discard. | |
| Elute 1 column volume 4 N HNO3 and discard. | |
| Elute 1 column volume mQ H2O and discard. | |
| Elute 1 column volume 4 N HNO3 and discard. | |
| Elute 1 column volume mQ H2O and discard. | |
| Elute 1 column volume 4 N HNO3 and discard. | |
| Load sample in 1 mL 4N HNO3 and collect onto dry REE cut. | |
| Elute a further 1 mL 4 N HNO3 and collect into REE cut. Evaporate replenished REE cut to incipient dryness at a maximum temperature of 100 °C. Expect this drydown to take 2-4 hours. Then, take up REE cut in 1 mL 0.2 5N HCl and allow to equilibrate for at least three hours at a maximum temperature of 70 °C. | |
| Elute 1 mL 4 N HNO3 and collect into Sr beaker. Repeat 5 further times for a cumulative collection of 6 mL 4 N HNO3 into the Sr beaker. | |
| Elute 1 mL 0.05 N HNO3 and collect into Sr beaker. Repeat 2 further times for a cumulative collection of 3 mL 0.05 N HNO3 into the Sr beaker. Place uncapped Sr beaker on vented hotplate at a maximum of 100 °C and evaporate to incipient dryness. It is now ready for analysis on the Triton. | |
| Elute 1 mL 0.05 N HNO3 and discard. Repeat 2 further times for a cumulative 3 mL of discarded 0.05 N HNO3. | |
| Elute 1 column volume mQ H2O and discard. | |
| Elute 1 column volume 4 N HNO3 and discard. | |
| | Fill column with 4 N HNO3 so that liquid level in the column is higher than liquid level in the storage container, and return used column to storage in 4N HNO3. |
| Nd column | |
| Prepare new columns with ca. 200 mg LN-spec resin in a 1 mL pipette tip (ask for direction), or take used columns from storage. With proper cleaning procedures, each column can be reused with no loss in functionality. | |
| Elute 1 column volume mQ H2O and discard. | |
| Elute 1 column volume 4 N HNO3 and discard. | |
| Elute 1 column volume mQ H2O and discard. | |
| Elute 1 column volume 6 N HCl and discard. | |
| Elute 1 column volume mQ H2O and discard. | |
| Elute 1 column volume 0.25 N HCl and discard. | |
| Load sample in 1 mL 0.25 N HCl and discard. | |
| Elute 1 mL 0.25 N HCl and collect into Nd beaker. Repeat 2 further times for a cumulative collection of 3 mL 0.25 N HCl into the Nd beaker. Place uncapped Nd beaker on vented hotplate at a maximum of 100 °C and evaporate to incipient dryness. | |
| Elute 1 mL 0.25 N HCl and discard. Repeat 2 further times for a cumulative 3 mL of discarded 0.25 N HCl (Sm). | |
| Elute 1 mL 0.75 N HCl and discard. Repeat 3 further times for a cumulative 4 mL of discarded 0.75 N HCl (HREE). | |
| Elute 1 column volume mQ H2O and discard. | |
| Elute 1 column volume 0.2 5N HCl and discard. | |
| Fill column with 0.2 5N HCl so that liquid level in the column is higher than liquid level in the storage container, and return used column to storage in 0.25 N HCl. |
Table S-2 Tabulated HSE blank concentrations and percent blank contributions to samples.
| Os (ng) | Ir (ng) | Ru (ng) | Pt (ng) | Pd (ng) | Re (ng) | 187Os/188Os | ||
| B6-4 | 0.131 | 0.081 | 0.029 | 0.049 | 0.054 | |||
| B6-8 | 0.125 | 0.072 | 0.024 | 0.055 | 0.100 | |||
| B8-4 | 0.090 | 0.028 | 0.010 | 0.065 | ||||
| B9-4 | 0.077 | 0.026 | 0.012 | 0.058 | 0.033 | |||
| B9-8 | 0.088 | 0.029 | 0.007 | 0.038 | ||||
| B10-4 | 0.075 | 0.086 | 0.011 | 0.083 | 0.046 | |||
| B12-1 | 0.097 | 0.039 | 0.014 | 0.094 | 0.049 | |||
| B12-2 | 0.003 | 0.092 | 0.015 | 0.012 | 0.063 | 0.021 | ||
| B12-3 | 0.099 | 0.018 | 0.016 | 0.057 | 0.020 | |||
| B12-4 | 0.004 | 0.137 | 0.014 | 0.011 | 0.073 | 0.021 | ||
| B12-5 | 0.004 | 0.150 | 0.020 | 0.015 | 0.063 | 0.022 | 0.683 | |
| B14-4 | 0.001 | 0.168 | 0.040 | 0.031 | 0.022 | 0.025 | 0.231 | |
| B15-4 | 0.001 | 0.164 | 0.382 | 0.046 | 0.014 | 0.035 | 0.310 | |
| B16-4 | 0.001 | 0.202 | 0.037 | 0.019 | 0.013 | 0.015 | 0.255 | |
| B17-4 | 0.001 | 0.177 | 0.052 | 0.034 | 0.022 | 0.022 | 0.325 | |
| B18-4 | 0.003 | 0.164 | 0.525 | 0.024 | 0.023 | 0.018 | 0.137 | |
| *Many Os blanks reflected inefficient spike equilibration and were consequently discarded | ||||||||
| Os (ng) | Ir (ng) | Ru (ng) | Pt (ng) | Pd (ng) | Re (ng) | 187Os/188Os | 1 St.Dev. | |
| Average blank | 0.002 | 0.127 | 0.092 | 0.020 | 0.050 | 0.034 | 0.32 | 0.19 |
| Sample: | Os (%) | Ir (%) | Ru (%) | Pt (%) | Pd (%) | Re (%) | ||
| DC14-01F | 55.3 | 14.7 | 20.0 | 5.2 | ||||
| DC14-02 | 0.8 | 28.9 | 23.5 | 3.5 | 8.5 | 23.6 | ||
| DC14-05 | 0.3 | 8.5 | 6.3 | 2.7 | 9.2 | 11.8 | ||
| DC14-09 | 0.3 | 9.6 | 15.2 | 0.4 | 1.3 | |||
| DC14-10A | 0.3 | 11.7 | 15.9 | 0.5 | 2.1 | 3.4 | ||
| DC14-10B | 0.4 | 10.2 | 19.2 | 0.5 | 1.7 | 3.7 | ||
| DC14-10B | 0.3 | 10.3 | 17.0 | 0.5 | 2.7 | 2.3 | ||
| DC14-10B | 0.3 | 11.5 | 19.8 | 0.5 | 2.2 | 2.3 | ||
| DC14-10B | 0.2 | 8.3 | 15.4 | 0.4 | 1.3 | 0.7 | ||
| DC14-10B | 11.0 | 19.7 | 0.5 | 2.5 | 2.7 | |||
| DC14-15 | 10.7 | 65.9 | 0.3 | 0.4 | 5.3 | |||
| DC14-15 | 6.2 | 48.3 | 0.3 | 0.4 | 2.9 | |||
| DC14-19 | 0.7 | 28.6 | 26.3 | 0.5 | 1.4 | 4.0 | ||
| DC14-20 | 0.7 | 14.8 | 12.7 | 0.3 | 0.8 | 9.6 | ||
| DC14-21 | 2.6 | 52.9 | 37.8 | 0.4 | 2.1 | 4.5 | ||
| DC14-28 | 33.7 | 41.6 | 25.1 | 9.9 | 19.9 | |||
| DC14-30 | 0.8 | 14.1 | 33.4 | 0.3 | 1.0 | 6.6 | ||
| DC14-31A | 0.3 | 9.5 | 12.7 | 0.2 | 0.4 | 7.9 | ||
| DC14-36 | 1.4 | 21.6 | 18.1 | 0.4 | 2.0 | 6.1 | ||
| DC14-38 | 1.1 | 18.4 | 17.3 | 0.4 | 1.3 | 7.8 | ||
| DC14-38 | 1.0 | 21.3 | 16.1 | 0.4 | 1.8 | 7.0 | ||
| DC14-39 | 33.1 | 53.7 | 84.2 | 18.9 | 4.3 | |||
| DC14-39 | 37.7 | 48.0 | 5.4 | |||||
| DC14-46A | 1.7 | 33.6 | 42.4 | 1.7 | 12.1 | 2.9 | ||
| DC14-46A | 1.6 | 38.4 | 46.7 | 1.6 | 12.9 | 2.5 | ||
| DC14-46B | 1.9 | 57.1 | 58.0 | 1.8 | 14.0 | 3.3 | ||
| DC14-46C | 0.3 | 43.4 | 54.8 | 1.8 | 11.8 | 10.4 | ||
| DC14-47B | 1.2 | 37.2 | 48.6 | 2.2 | 7.4 | 20.8 | ||
| DC14-47B | 0.6 | 47.2 | 84.4 | 2.9 | 5.6 | 16.4 | ||
| DC14-47A | 7.9 | 45.1 | 79.0 | 2.1 | 6.3 | 2.1 | ||
| DC14-53 | 2.1 | 31.9 | 59.5 | 0.6 | 3.6 | 24.4 | ||
| DC14-59 | 22.4 | 7.8 | 11.2 | 2.5 | ||||
| DC14-63 | 33.5 | 26.4 | 23.3 | 4.9 | ||||
| DC14-68 | 9.6 | 48.8 | 0.8 | 1.1 | 3.3 | |||
| DC14-69 | 0.4 | 10.0 | 18.0 | 0.4 | 2.0 | 8.0 | ||
| DC14-71 | 1.0 | 42.5 | 33.4 | 0.7 | 1.9 | 4.0 | ||
| DC14-72 | 0.9 | 27.9 | 44.8 | 0.5 | 2.2 | 5.6 | ||
| DC14-75 | 1.9 | 92.3 | 7.6 | 35.9 | 5.6 | |||
| DC14-77 | 0.3 | 17.6 | 19.6 | 0.4 | 3.1 | 4.8 | ||
| DC14-77 | 0.5 | 14.9 | 20.3 | 0.4 | 1.4 | 1.1 | ||
| DC14-77 | 0.4 | 15.1 | 21.1 | 0.4 | 1.7 | 5.9 | ||
| DC14-78 | 0.6 | 12.9 | 16.7 | 0.4 | 1.7 | 7.5 | ||
| DC14-79 | 6.3 | 70.6 | 88.0 | 1.3 | 3.3 | 0.9 | ||
| DC14-80 | 1.8 | 26.4 | 65.0 | 1.7 | 4.1 | 0.0 | ||
| DC14-82 | 0.2 | 5.6 | 17.1 | 0.4 | 1.1 | 3.9 | ||
| DC14-83B | 0.5 | 18.9 | 27.8 | 1.6 | 2.8 | 4.2 | ||
| DC14-83B | 1.1 | 20.9 | 32.4 | 1.6 | 4.4 | 1.0 | ||
| DC14-83B | 0.7 | 20.0 | 32.8 | 1.7 | 3.1 | 4.2 | ||
| DC14-84A | 1.4 | 20.4 | 45.5 | 0.4 | 1.1 | 3.3 | ||
| DC14-85 | 1.3 | 13.7 | 34.5 | 0.3 | 1.0 | 3.7 | ||
| DC14-96 | 0.2 | 17.9 | 33.0 | 0.8 | 2.9 | 3.9 | ||
| DC14-96 | 0.9 | 36.6 | 33.1 | 0.8 | 2.1 | 3.2 | ||
| DC14-97 | 0.8 | 52.2 | 35.5 | 0.7 | 2.4 | 4.1 | ||
| DC14-99 | 12.9 | 39.9 | 0.8 | 1.3 | 4.6 | |||
| DC14-103 | 4.7 | 36.8 | 0.8 | 0.9 | 7.0 | |||
| DC14-108 | 8.6 | 37.9 | 1.0 | 0.8 | 2.5 | |||
| DC14-110 | 0.9 | 25.1 | 44.3 | 0.6 | 0.9 | 5.7 | ||
| DC14-111 | 14.8 | 44.0 | 1.0 | 0.5 | 3.0 | |||
| MMF7 | 86.6 | 48.8 | 21.5 | 32.1 | 7.8 | |||
| MMF7 | 2.3 | 42.3 | 21.7 | 7.9 | ||||
Table S-3 Geochemical and isotopic data (Table S-3 is available for download as an Excel file below).
Table S-4 Modelling parameters.
| 87Sr/86Sr | Range | [Sr] | 143Nd/144Nd | Range | [Nd] | 187Os/188Os | Range | [Os] | References | |
| Réunion | 0.7041891 | 0.704-0.70425 | 57.24 | 0.5128531 | 0.5128-0.5129 | 35 | 0.1324 | 0.1310-0.1338 | 1.01 | Peters et al. (2016). GEOROC (accessed 13 January 2017) |
| Upper Continental Crust | 0.72715 | 0.725-0.735 | 284 | 0.510556 | 0.51035-0.5111 | 4.6 | 1.2 | 0.196-1.2 | 0.001 - 0.004 | Ray et al. (2008). Peucat et al. (1989. 2013). Asmerom and Walker (1998) |
| Lower Continental Crust | 0.70264 | 0.702-0.712 | 989 | 0.5106 | 0.51035-0.5117 | 13.7 | 0.83335 | 0.196-1.2 | 0.001 - 0.004 | Peucat et al. (1989. 2013). Asmerom and Walker (1998) |
| Continental Lithospheric Mantle | 0.70255 | 0.702-0.7045 | 3252 | 0.512777 | 0.5133-0.5124 | 1.252 | 0.113 | 0.105-0.120 | 3.4 | Aulbach et al. (2016); McBride et al. (1996) |
| Depleted MORB Mantle | | | | 0.51321 | 0.5125-0.5135 | 8 | 0.125 | 0.1218-0.1274 | 3 | Snow and Reisberg (1995); Roy-Barman et al. (1998) |
Notes:
1 Elemental concentrations projected from MgO versus element plots assembled from listed references; isotopic ratios projected from element versus isotope ratio plots assembled from listed references.
2 Estimated concentrations to match appropriate R values as discussed in the literature.
3 Representing Archean-aged CLM.
Table S-5 Data used for initial 187Os/188Os calculation filtered from Table S-3 (second tab in the Excel version of Table S-5, available for download below).
| Filter parameters | ||||||||
| Filtering ranges can be adjusted to test effect on initial | ||||||||
| MgO | wt. % | LOI | wt. % | 187Re/188Os | 187Os/188Os | |||
| min. | 6 | min. | 0 | min. | 0 | min. | 0.125 | |
| max. | 15 | max. | 2.5 | max. | 100 | max. | 1.000 | |
| Remarks: | Avoids highly differentiated and olivine-accumulative samples | Avoids highly altered samples | Avoids samples that experienced significant crustal assimilation | Avoids samples that experienced significant lithospheric or crustal assimilation | ||||
| Initial calculation | ||||||||
| Filtered samples | ||||||||
| nsamples | 15 | |||||||
| nmeasurements | 21 | |||||||
| Isochron method (least-squares) | Weighted initial (t = 65 Ma) | |||||||
| 187Os/188Os (i) | 0.1337 | 187Os/188Os (i) | 0.1332 | |||||
| Max | 0.1365 | Max | 0.1333 | |||||
| Min | 0.1308 | Min | 0.1331 | |||||
| 95 % c.i. | 0.0028 | 95 % c.i. | 0.0001 | |||||
| Isochron method (Isoplot / York) | ||||||||
| 187Os/188Os (i) | 0.1336 | This result is static and will not automatically update. It is based on initial filtering conditions: 6 < MgO wt. % < 14, LOI < 2.5 wt. %. 187Re/188Os < 100, 0.125 < 187Os/188Os < 1. | ||||||
| Max | 0.1367 | |||||||
| Min | 0.1305 | |||||||
| | 2σ s.d. | 0.0031 | ||||||
| Filtered samples | ||||||||
| Sample name | MgO (wt. %) | LOI (wt. %) | 187Re/188Os | 2σ | 187Os/188Os | 2σ | 187Os/188Os (T = 65 Ma) | 2σ |
| DC14-2 | 13.96 | 2.16 | 1.04 | 0.05 | 0.13271 | 0.00014 | 0.13158 | 0.00020 |
| DC14-9 | 8.68 | 1.9 | 4.47 | 0.22 | 0.13402 | 0.00009 | 0.12918 | 0.00033 |
| DC14-10A | 8.91 | 2.09 | 4.27 | 0.21 | 0.13511 | 0.00013 | 0.13048 | 0.00036 |
| DC14-10B | 8.93 | 2.03 | 4.13 | 0.21 | 0.13650 | 0.00007 | 0.13202 | 0.00030 |
| DC14-10B | 8.93 | 2.03 | 5.13 | 0.26 | 0.13553 | 0.00007 | 0.12997 | 0.00035 |
| DC14-10B | 8.93 | 2.03 | 6.19 | 0.31 | 0.13811 | 0.00010 | 0.13140 | 0.00044 |
| DC14-10B | 8.93 | 2.03 | 0.72 | 0.04 | 0.13910 | 0.00010 | 0.13832 | 0.00014 |
| DC14-15 | 6.76 | 1.79 | 91.43 | 4.57 | 0.23546 | 0.00085 | 0.13635 | 0.00581 |
| DC14-15 | 6.76 | 1.79 | 94.85 | 4.74 | 0.24480 | 0.00043 | 0.14198 | 0.00557 |
| DC14-15 | 6.76 | 1.79 | 7.80 | 0.39 | 0.14104 | 0.00034 | 0.13258 | 0.00076 |
| DC14-20 | 9.37 | 1.17 | 2.80 | 0.14 | 0.13260 | 0.00010 | 0.12957 | 0.00025 |
| DC14-30 | 9.36 | 2.34 | 5.02 | 0.25 | 0.13459 | 0.00046 | 0.12914 | 0.00074 |
| DC14-31A | 11.22 | 1.44 | 1.56 | 0.08 | 0.12870 | 0.00008 | 0.12701 | 0.00016 |
| DC14-46A | 8.52 | 2.04 | 24.84 | 1.24 | 0.16199 | 0.00019 | 0.13506 | 0.00154 |
| DC14-46A | 8.52 | 2.04 | 27.70 | 1.39 | 0.16652 | 0.00018 | 0.13649 | 0.00168 |
| DC14-46B | 8.42 | 2.49 | 23.32 | 1.17 | 0.16558 | 0.00035 | 0.14030 | 0.00161 |
| DC14-53 | 8.37 | 1.18 | 2.85 | 0.14 | 0.15066 | 0.00079 | 0.14757 | 0.00094 |
| DC14-71 | 6.96 | 2.43 | 10.30 | 0.52 | 0.14046 | 0.00014 | 0.12930 | 0.00070 |
| DC14-82 | 12.9 | 1.91 | 2.27 | 0.11 | 0.14064 | 0.00006 | 0.13818 | 0.00018 |
| DC14-84A | 7.55 | 1.82 | 17.83 | 0.89 | 0.16297 | 0.00014 | 0.14364 | 0.00111 |
| DC14-85 | 8.38 | 1.9 | 14.76 | 0.74 | 0.15907 | 0.00015 | 0.14307 | 0.00095 |


