Iodine proxy evidence for increased ocean oxygenation during the Bitter Springs Anomaly
Affiliations | Corresponding Author | Cite as | Funding informationKeywords: Bitter Springs Anomaly, iodine, I/(Ca+Mg), I/Ca, oxygenation
- Share this article


Article views:7,854Cumulative count of HTML views and PDF downloads.
- Download Citation
- Rights & Permissions
Abstract
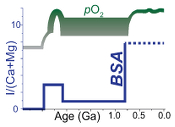
Figures and Tables
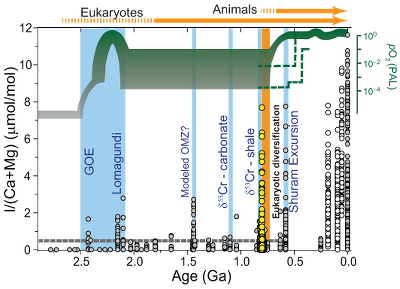 Figure 1 Secular trend of I/(Ca + Mg). White (I/Ca; limestone) and gray (I/(Ca + Mg); dolostone) dots are from Hardisty et al. (2017). Yellow dots are from this study. Blue bars mark intervals where there are data consistent with possible oxygenation events (Kendall et al., 2009; Planavsky et al., 2014; Gilleaudeau et al., 2016) relative to the long term atmospheric pO2 curve (green shades from Lyons et al., 2014; green dash line from Sperling et al., 2015) and major evolutionary events (orange) in biosphere. The grey dashed line at 0.5 μmol/mol is the Precambrian I/(Ca + Mg) baseline. | 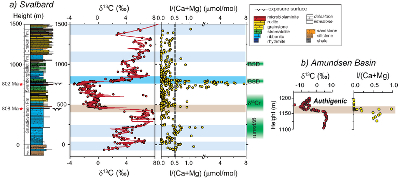 Figure 2 I/(Ca + Mg) data from (a) Svalbard and (b) Amundsen basin. Values above 0.5 μmol/mol (Fig. 1) are most commonly associated with the rise in δ13C (blue bar). Darker blue bar highlights the recovery phase of BSA with a major increase in δ13C. The decrease in δ13C that defines the base of the BSA is indicated with a brown bar, and data from Svalbard and the Amundsen Basin are lined up accordingly. Note the axis for I/(Ca + Mg) is broken at 1.50 to better illustrate stratigraphic trends below 2 μmol/mol. Green boxes show the timing of increases in O2 levels as stratigraphically correlated to the Svalbard section. Gypsum evaporite deposits are from Turner and Bekker (2016). δ53Cr signature is from Planavsky et al. (2014). BSD stands for bacterial sulphur disproportionation, as recorded in multiple sulphur isotope data (Kunzmann et al., 2017). |
| Figure 1 | Figure 2 |
Supplementary Figures and Tables
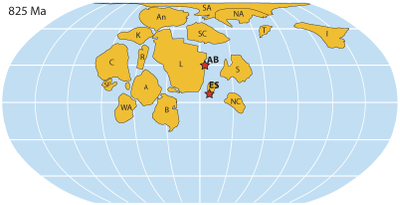 Figure S-1 Palaeogeographic reconstruction for 825 Ma (modified from Li et al., 2013). Stars mark sampled locations (ES = East Svalbard; AB = Amundsen Basin). Craton names: A = Amazon; An = Antarctica; B = Baltica; C = Congo; I = India; K = Kalahari; NA = northern Australia; R = Rio Plata; S = Siberia; SA = southern Australia; SC = South China; T = Tarim; WA = West Africa. | 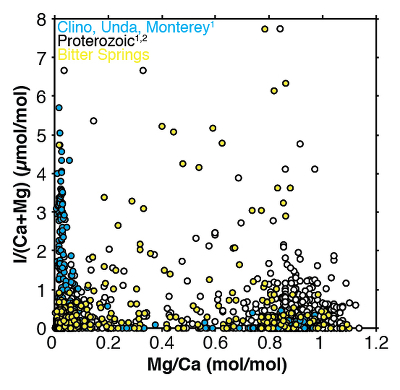 Figure S-2 I/(Ca + Mg) vs. Mg/Ca. Blue data points for multiple Neogene diagenetic scenarios (Hardisty et al., 2017). White circles for Proterozoic carbonates (Hardisty et al., 2017). Yellow points are from this study. |  Table S-1 I/(Mg + Ca) and δ13C data from (a) Svalbard and (b) the Amundsen Basin. |
| Figure S-1 | Figure S-2 | Table S-1 |
top
Introduction
The second largest rise in atmospheric oxygen in Earth’s history might have occurred during the Neoproterozoic Era or the Palaeozoic (e.g., Lyons et al., 2014
Lyons, T.W., Reinhard, C.T., Planavsky, N.J. (2014) The rise of oxygen in Earth's early ocean and atmosphere. Nature 506, 307–315.
; Sperling et al., 2015Sperling, E.A., Wolock, C.J., Morgan, A.S., Gill, B.C., Kunzmann, M., Halverson, G.P., Macdonald, F.A., Knoll, A.H., Johnston, D.T. (2015) Statistical analysis of iron geochemical data suggests limited late Proterozoic oxygenation. Nature 523, 451–454.
). The Neoproterozoic is distinguished by dramatic palaeoenvironmental and biological changes, manifested in a pair of global glaciations, extreme fluctuations in δ13C values of seawater, and the emergence of macroscopic animals (Macdonald et al., 2010Macdonald, F.A., Schmitz, M.D., Crowley, J.L., Roots, C.F., Jones, D.S., Maloof, A.C., Strauss, J.V., Cohen, P.A., Johnston, D.T., Schrag, D.P. (2010) Calibrating the Cryogenian. Science 327, 1241–1243.
). The ca. 810–800 Ma Bitter Springs Anomaly (BSA) is a long-lived negative excursion in seawater δ13C (Halverson et al., 2005Halverson, G.P., Hoffman, P.F., Schrag, D.P., Maloof, A.C., Rice, A.H.N. (2005) Toward a Neoproterozoic composite carbon-isotope record. Geological Society of America Bulletin 117, 1181–1207.
). The BSA is broadly coeval with a proposed eukaryotic diversification event, as well as an inferred rise in atmospheric O2 (Fig. 1) (Planavsky et al., 2014Planavsky, N.J., Reinhard, C.T., Wang, X.L., Thomson, D., McGoldrick, P., Rainbird, R.H., Johnson, T., Fischer, W.W., Lyons, T.W. (2014) Low Mid-Proterozoic atmospheric oxygen levels and the delayed rise of animals. Science 346, 635–638.
; Cohen and Macdonald, 2015Cohen, P.A., Macdonald, F.A. (2015) The Proterozoic Record of Eukaryotes. Paleobiology 41, 610–632.
; Thomson et al., 2015Thomson, D., Rainbird, R.H., Planavsky, N., Lyons, T.W., Bekker, A. (2015) Chemostratigraphy of the Shaler Supergroup, Victoria Island, NW Canada: A record of ocean composition prior to the Cryogenian glaciations. Precambrian Research 263, 232–245.
; Cole et al., 2016Cole, D.B., Reinhard, C.T., Wang, X., Gueguen, B., Halverson, G.P., Gibson, T., Hodgskiss, M.S.W., McKenzie, N.R., Lyons, T.W., Planavsky, N.J. (2016) A shale-hosted Cr isotope record of low atmospheric oxygen during the Proterozoic. Geology 44, 555–558.
; Turner and Bekker, 2016Turner, E.C., Bekker, A. (2016) Thick sulfate evaporite accumulations marking a mid-Neoproterozoic oxygenation event (Ten Stone Formation, Northwest Territories, Canada). Geological Society of America Bulletin 128, 203–222.
). Consequently, understanding the change in ocean redox conditions during the BSA may provide important insights into the intertwined changes in the biosphere, atmospheric oxygen, and carbon cycle during this critical chapter in Earth history.Bulk carbonate I/(Ca + Mg) is a local redox proxy that records upper ocean conditions where limestones and dolostones were formed. The thermodynamically stable forms of iodine in seawater are iodate (IO3-) and iodide (I-) (Wong, 1991
Wong, G.T.F. (1991) The marine geochemistry of iodine. Reviews in Aquatic Sciences 4, 45–73.
). Iodate is quantitatively converted to I- in low O2 settings such as oxygen minimum zones (OMZs) (Rue et al., 1997Rue, E.L., Smith, G.J., Cutter, G.A., Bruland, K.W. (1997) The response of trace element redox couples to suboxic conditions in the water column. Deep-Sea Research Part I-Oceanographic Research Papers 44, 113–134.
). Further, IO3- is the only chemical form of iodine that is incorporated into the structure of carbonate minerals (Lu et al., 2010Lu, Z., Jenkyns, H.C., Rickaby, R.E.M. (2010) Iodine to calcium ratios in marine carbonate as a paleo-redox proxy during oceanic anoxic events. Geology 38, 1107–1110.
), substituting for CO32- (Podder et al., 2017Podder, J., Lin, J., Sun, W., Botis, S.M., Tse, J., Chen, N., Hu, Y., Li, D., Seaman, J., Pan, Y. (2017) Iodate in calcite and vaterite: Insights from synchrotron X-ray absorption spectroscopy and first-principles calculations. Geochimica et Cosmochimica Acta 198, 218–228.
). Modern OMZs are characterised by low I/Ca (~0.5–2.5 μmol/mol) compared to that of the well-oxygenated waters (~5 μmol/mol) (Lu et al., 2016Lu, Z., Hoogakker, B.A.A., C.D., H., Zhou, X., Thomas, E., Gutchess, K., Lu, W., Jones, L., Rickaby, R.E.M. (2016) Oxygen depletion recorded in upper waters of the glacial Southern Ocean. Nature Communications 7, 11146.
). During Precambrian oxidation events in the relatively low pO2 world (Fig. 1), dolostones rarely have I/(Ca + Mg) values above 2 μmol/mol (Hardisty et al., 2017Hardisty, D.S., Lu, Z., Bekker, A., Diamond, C.W., Gill, B.C., Jiang, G., Kah, L.C., Knoll, A.H., Loyd, S.J., Osburn, M.R., Planavsky, N.J., Wang, C., Zhou, X., Lyons, T.W. (2017) Perspectives on Proterozoic surface ocean redox from iodine contents in ancient and recent carbonate. Earth and Planetary Science Letters 463, 159–170.
).Here we present new I/(Ca + Mg) data (Fig. 1) from well-preserved carbonates of multiple outcrop sections in Svalbard and from a drill core in the Amundsen Basin of northwestern Canada (Supplementary Information and Fig. S-1). A previous study through this interval (of the lower Svanbergfjellet Formation) demonstrated that the dolomitisation of these samples was early, and fabric retentive, and that no subsequent alteration has overprinted the geochemical signatures of these rocks (Halverson et al., 2007
Halverson, G.P., Maloof, A.C., Schrag, D.P., Dudas, F.O., Hurtgen, M.T. (2007) Stratigraphy and geochemistry of a ca 800 Ma negative carbon isotope interval in northeastern Svalbard. Chemical Geology 237, 5–27.
).
Figure 1 Secular trend of I/(Ca + Mg). White (I/Ca; limestone) and gray (I/(Ca + Mg); dolostone) dots are from Hardisty et al. (2017)
Hardisty, D.S., Lu, Z., Bekker, A., Diamond, C.W., Gill, B.C., Jiang, G., Kah, L.C., Knoll, A.H., Loyd, S.J., Osburn, M.R., Planavsky, N.J., Wang, C., Zhou, X., Lyons, T.W. (2017) Perspectives on Proterozoic surface ocean redox from iodine contents in ancient and recent carbonate. Earth and Planetary Science Letters 463, 159–170.
. Yellow dots are from this study. Blue bars mark intervals where there are data consistent with possible oxygenation events (Kendall et al., 2009Kendall, B., Creaser, R.A., Gordon, G.W., Anbar, A.D. (2009) Re–Os and Mo isotope systematics of black shales from the Middle Proterozoic Velkerri and Wollogorang Formations, McArthur Basin, northern Australia. Geochimica et Cosmochimica Acta 73, 2534–2558.
; Planavsky et al., 2014Planavsky, N.J., Reinhard, C.T., Wang, X.L., Thomson, D., McGoldrick, P., Rainbird, R.H., Johnson, T., Fischer, W.W., Lyons, T.W. (2014) Low Mid-Proterozoic atmospheric oxygen levels and the delayed rise of animals. Science 346, 635–638.
; Gilleaudeau et al., 2016Gilleaudeau, G.J., Frei, R., Kaufman, A.J., Kah, L.C., Azmy, K., Bartley, J.K., Chernyavskiy, P., Knoll, A.H. (2016) Oxygenation of the mid-Proterozoic atmosphere: clues from chromium isotopes in carbonates. Geochemical Perspectives Letters 2, 178–187.
) relative to the long term atmospheric pO2 curve (green shades from Lyons et al., 2014Lyons, T.W., Reinhard, C.T., Planavsky, N.J. (2014) The rise of oxygen in Earth's early ocean and atmosphere. Nature 506, 307–315.
; green dash line from Sperling et al., 2015Sperling, E.A., Wolock, C.J., Morgan, A.S., Gill, B.C., Kunzmann, M., Halverson, G.P., Macdonald, F.A., Knoll, A.H., Johnston, D.T. (2015) Statistical analysis of iron geochemical data suggests limited late Proterozoic oxygenation. Nature 523, 451–454.
) and major evolutionary events (orange) in biosphere. The grey dashed line at 0.5 μmol/mol is the Precambrian I/(Ca + Mg) baseline.top
Methods
For the I/(Ca + Mg) analyses, ~4 mg of fine powder for each sample were weighed out and then rinsed with de-ionised water. Nitric acid (3 %) was added for dissolution. Fresh iodine calibration standards were prepared from potassium iodate powder. To stabilise iodine, 0.1 % tertiary amine solution was used after carbonate dissolution, followed immediately by measurements on a quadrupole ICP-MS (Bruker M90) at Syracuse University. The sensitivity of iodine was tuned to ~80 kcps for a 1 ppb standard. The precision for 127I is normally better than 1 %. The long term accuracy is checked by frequently repeated analysis of the reference material JCp-1 (Lu et al., 2010
Lu, Z., Jenkyns, H.C., Rickaby, R.E.M. (2010) Iodine to calcium ratios in marine carbonate as a paleo-redox proxy during oceanic anoxic events. Geology 38, 1107–1110.
). The detection limit of I/Ca is on the order of 0.1 μmol/mol. Calcium and Mg concentrations were calibrated using a Merck multi-element standard and measured via ICP-MS.top
Results
Excluding the samples from intervals with an oxygen rise suggested by other proxies, over 95 % of data (n = 250) from all previously published Proterozoic samples have I/(Ca + Mg) of < 0.5 μmol/mol, (Hardisty et al., 2017
Hardisty, D.S., Lu, Z., Bekker, A., Diamond, C.W., Gill, B.C., Jiang, G., Kah, L.C., Knoll, A.H., Loyd, S.J., Osburn, M.R., Planavsky, N.J., Wang, C., Zhou, X., Lyons, T.W. (2017) Perspectives on Proterozoic surface ocean redox from iodine contents in ancient and recent carbonate. Earth and Planetary Science Letters 463, 159–170.
). We therefore treat 0.5 μmol/mol as the baseline for I/(Ca + Mg) in Precambrian carbonates, marked by a dashed line in Figures 1 and 2. Values above this baseline are relatively high for the Proterozoic. The most prominent feature in our new dataset is a maximum in I/(Ca + Mg) reaching ~8 μmol/mol at the onset of the recovery phase of the BSA (Figs. 1 and 2). This peak greatly exceeds the maximum values found throughout the preceding Precambrian, including the Great Oxidation Event (GOE) at ca. 2.3–2.4 Ga (~2 μmol/mol; Hardisty et al., 2014Hardisty, D.S., Lu, Z., Planavsky, N., Bekker, A., Philippot, P., Zhou, X., Lyons, T.W. (2014) An iodine record of Paleoproterozoic surface ocean oxygenation. Geology 42, 619–622.
), but is comparable to the highest values recorded during the Ediacaran (ca. 580 Ma) Shuram Excursion (Hardisty et al., 2017Hardisty, D.S., Lu, Z., Bekker, A., Diamond, C.W., Gill, B.C., Jiang, G., Kah, L.C., Knoll, A.H., Loyd, S.J., Osburn, M.R., Planavsky, N.J., Wang, C., Zhou, X., Lyons, T.W. (2017) Perspectives on Proterozoic surface ocean redox from iodine contents in ancient and recent carbonate. Earth and Planetary Science Letters 463, 159–170.
). In the Tonian Akademikerbreen Group, Svalbard, all but two samples with I/(Ca + Mg) values above 0.5 μmol/mol occur in intervals showing a prominent rise δ13C (blue bars in Fig. 2a). In drill core samples from the Wynniatt Formation (Shaler Supergroup) in the Amundsen Basin (Thomson et al., 2015Thomson, D., Rainbird, R.H., Planavsky, N., Lyons, T.W., Bekker, A. (2015) Chemostratigraphy of the Shaler Supergroup, Victoria Island, NW Canada: A record of ocean composition prior to the Cryogenian glaciations. Precambrian Research 263, 232–245.
), the iodine signal drops to zero during the BSA interval in organic matter-rich samples that have δ13C values well below typical BSA values (Fig. 2c).
Figure 2 I/(Ca + Mg) data from (a) Svalbard and (b) Amundsen basin. Values above 0.5 μmol/mol (Fig. 1) are most commonly associated with the rise in δ13C (blue bar). Darker blue bar highlights the recovery phase of BSA with a major increase in δ13C. The decrease in δ13C that defines the base of the BSA is indicated with a brown bar, and data from Svalbard and the Amundsen Basin are lined up accordingly. Note the axis for I/(Ca + Mg) is broken at 1.50 to better illustrate stratigraphic trends below 2 μmol/mol. Green boxes show the timing of increases in O2 levels as stratigraphically correlated to the Svalbard section. Gypsum evaporite deposits are from Turner and Bekker (2016)
Turner, E.C., Bekker, A. (2016) Thick sulfate evaporite accumulations marking a mid-Neoproterozoic oxygenation event (Ten Stone Formation, Northwest Territories, Canada). Geological Society of America Bulletin 128, 203–222.
. δ53Cr signature is from Planavsky et al. (2014)Planavsky, N.J., Reinhard, C.T., Wang, X.L., Thomson, D., McGoldrick, P., Rainbird, R.H., Johnson, T., Fischer, W.W., Lyons, T.W. (2014) Low Mid-Proterozoic atmospheric oxygen levels and the delayed rise of animals. Science 346, 635–638.
. BSD stands for bacterial sulphur disproportionation, as recorded in multiple sulphur isotope data (Kunzmann et al., 2017Kunzmann, M., Bui, T.H., Crockford, P.W., Halverson, G.P., Scott, C., Lyons, T.W., Wing, B.A. (2017) Bacterial sulfur disproportionation constrains timing of Neoproterozoic oxygenation. Geology 45, 207–210.
).top
Discussion
Primary redox signal? Despite the potential for diagenetic resetting, the distinctively high I/(Ca + Mg) of the BSA in Svalbard compared to other Precambrian data is most likely a primary signal (Fig. 1) based on the following considerations:
(1) A plot of I/(Ca + Mg) against Mg/Ca (Fig. S-2, with a value of 1 for a pure dolomite end member) shows that the highest BSA I/(Ca + Mg) values from Svalbard are concentrated in partially to fully dolomitised samples. This is opposite of a trend observed in a comprehensive study of Neogene-Quaternary carbonates, which demonstrated that diagenesis, and most prominently dolomitisation, typically decreases the primary I/(Ca + Mg) signal (Hardisty et al., 2017
Hardisty, D.S., Lu, Z., Bekker, A., Diamond, C.W., Gill, B.C., Jiang, G., Kah, L.C., Knoll, A.H., Loyd, S.J., Osburn, M.R., Planavsky, N.J., Wang, C., Zhou, X., Lyons, T.W. (2017) Perspectives on Proterozoic surface ocean redox from iodine contents in ancient and recent carbonate. Earth and Planetary Science Letters 463, 159–170.
). Therefore, the I/(Ca + Mg) values that peak well above the baseline (Fig. 2) might have been higher initially prior to iodine loss during dolomitisation, i.e. the observed peak can be regarded as a minimum estimate of the changes in local seawater iodate level.(2) In contrast to Svalbard, the BSA in the Amundsen Basin is associated with organic-rich carbonates marked by δ13Ccarb values (< -10 ‰) well below typical values for the BSA. These data suggest a large authigenic carbonate component (Thomson et al., 2015
Thomson, D., Rainbird, R.H., Planavsky, N., Lyons, T.W., Bekker, A. (2015) Chemostratigraphy of the Shaler Supergroup, Victoria Island, NW Canada: A record of ocean composition prior to the Cryogenian glaciations. Precambrian Research 263, 232–245.
). Authigenic carbonate in organic-rich sediments form in anoxic porewaters where I- is the only iodine species and is excluded from the carbonate mineral lattice (Lu et al., 2010Lu, Z., Jenkyns, H.C., Rickaby, R.E.M. (2010) Iodine to calcium ratios in marine carbonate as a paleo-redox proxy during oceanic anoxic events. Geology 38, 1107–1110.
). Hence, it is unsurprising that these Amundsen Basin samples yielded no detectable iodine (Fig. 2b). These Amundsen data confirm again (Hardisty et al., 2017Hardisty, D.S., Lu, Z., Bekker, A., Diamond, C.W., Gill, B.C., Jiang, G., Kah, L.C., Knoll, A.H., Loyd, S.J., Osburn, M.R., Planavsky, N.J., Wang, C., Zhou, X., Lyons, T.W. (2017) Perspectives on Proterozoic surface ocean redox from iodine contents in ancient and recent carbonate. Earth and Planetary Science Letters 463, 159–170.
) that mixing authigenic carbonates into primary carbonates cannot cause a false positive in I/Ca values. The high I/(Ca + Mg) values in Svalbard samples, if associated with any authigenic components, should have had a primary signal higher than currently observed.(3) Studies of recent carbonates from Bahamas (Clino) and the Pleistocene Key Largo limestone have found that carbonate recrystallisation during subaerial exposure and associated diagenesis in meteoric waters are most likely to reduce iodine in carbonates because iodine concentrations in fresh water are orders of magnitude lower than those in seawater (Hardisty et al., 2017
Hardisty, D.S., Lu, Z., Bekker, A., Diamond, C.W., Gill, B.C., Jiang, G., Kah, L.C., Knoll, A.H., Loyd, S.J., Osburn, M.R., Planavsky, N.J., Wang, C., Zhou, X., Lyons, T.W. (2017) Perspectives on Proterozoic surface ocean redox from iodine contents in ancient and recent carbonate. Earth and Planetary Science Letters 463, 159–170.
). Meteoric diagenesis during subaerial exposure also cannot explain the iodine spike observed for the BSA in Svalbard.(4) The I/Ca spike is unlikely to be explained by shoaling of carbonate deposition (e.g., near exposure surfaces) while maintaining the shallow oxycline conditions that typified most of parts of the Proterozoic. Firstly, all the Svalbard samples were preserved already at shallow depth (Halverson et al., 2007
Halverson, G.P., Maloof, A.C., Schrag, D.P., Dudas, F.O., Hurtgen, M.T. (2007) Stratigraphy and geochemistry of a ca 800 Ma negative carbon isotope interval in northeastern Svalbard. Chemical Geology 237, 5–27.
). Secondly, the high I/(Ca + Mg) values are only associated with the upper subaerial exposure surface but not at the lower one (Fig. 2a). Finally, in the modern ocean, sea surface iodate concentrations are relatively low above a shallow OMZs (even at modern pO2 level), resulting in I/Ca ratios below ~2.5 µmol/mol (Lu et al., 2016Lu, Z., Hoogakker, B.A.A., C.D., H., Zhou, X., Thomas, E., Gutchess, K., Lu, W., Jones, L., Rickaby, R.E.M. (2016) Oxygen depletion recorded in upper waters of the glacial Southern Ocean. Nature Communications 7, 11146.
)—which stand in stark contrast to the observed very high BSA values of up to ~8 µmol/mol. Therefore, some fundamental redox reorganisation is likely required to account for the observed I/(Ca + Mg) spike during the BSA recovery.Iodide oxidation during the BSA recovery. I/(Ca + Mg) ratios above 4 μmol/mol found in this study (Fig. 1) reach a range characteristic of Cenozoic and Mesozoic carbonate iodine records (Zhou et al., 2015
Zhou, X., Jenkyns, H.C., Owens, J.D., Junium, C.K., Zheng, X., Sageman, B., Hardisty, D.S., Lyons, T.W., Ridgwell, A., Lu, Z. (2015) Upper ocean oxygenation dynamics from I/Ca ratios during the Cenomanian-Turonian OAE 2. Paleoceanography 30, 510–526.
). We interpret these high I/(Ca + Mg) values during the BSA to reflect the oxidation of iodide in the upper ocean. Modern carbonate fossils show very low ratios of ~0.5 μmol/mol directly above strong and shallow OMZs, and >5 μmol/mol at well-oxygenated locations, indicating that I/Ca is a sensitive local to regional proxy for subsurface O2-depletion and for the depth of oxycline in the water column (Lu et al., 2016Lu, Z., Hoogakker, B.A.A., C.D., H., Zhou, X., Thomas, E., Gutchess, K., Lu, W., Jones, L., Rickaby, R.E.M. (2016) Oxygen depletion recorded in upper waters of the glacial Southern Ocean. Nature Communications 7, 11146.
). Even though I/(Ca + Mg) is not a direct measure of atmospheric oxygen levels, the existing Precambrian I/(Ca + Mg) data show a response in the upper ocean to several possible oxygenation events identified based on other redox proxies (Fig. 1). This response is predicted because atmospheric pO2 is one of the major controls on oxycline depth. I/(Ca + Mg) first rose to ~2 μmol/mol during the ca. 2.2–2.0 Ga Lomagundi Event following the GOE (Hardisty et al., 2014Hardisty, D.S., Lu, Z., Planavsky, N., Bekker, A., Philippot, P., Zhou, X., Lyons, T.W. (2014) An iodine record of Paleoproterozoic surface ocean oxygenation. Geology 42, 619–622.
). Relatively high values are also available from ca. 1.4 Ga carbonates in North China and the middle Ediacaran Shuram excursion (SE) (Hardisty et al., 2017Hardisty, D.S., Lu, Z., Bekker, A., Diamond, C.W., Gill, B.C., Jiang, G., Kah, L.C., Knoll, A.H., Loyd, S.J., Osburn, M.R., Planavsky, N.J., Wang, C., Zhou, X., Lyons, T.W. (2017) Perspectives on Proterozoic surface ocean redox from iodine contents in ancient and recent carbonate. Earth and Planetary Science Letters 463, 159–170.
). Although carbon cycle dynamics and the primary controls on oxygenation were likely different during these three events, the increase in I/(Ca + Mg) that is common to all of them cannot be explained by diagenesis and likely reflects elevated oxygen levels. In this context, our I/(Ca + Mg) values up to ~8 μmol/mol during the BSA recovery are evidence for a remarkable increase in iodate concentrations in the surface waters of a carbonate platform. The BSA I/(Ca + Mg) peak is most likely due to deepening of the oxycline and concomitant oxidation of iodide.The I/(C a+ Mg) data suggest that the oxycline began to deepen slightly before the initial rise of δ13C marking the onset of recovery from the BSA (darker blue bar in Fig. 2a). Similarly, there is evidence for shifting marine redox immediately prior to the positive δ13C excursion due to global carbon burial defining the onset of Mesozoic Oceanic Anoxic Event 2 (Zhou et al., 2015
Zhou, X., Jenkyns, H.C., Owens, J.D., Junium, C.K., Zheng, X., Sageman, B., Hardisty, D.S., Lyons, T.W., Ridgwell, A., Lu, Z. (2015) Upper ocean oxygenation dynamics from I/Ca ratios during the Cenomanian-Turonian OAE 2. Paleoceanography 30, 510–526.
; Ostrander et al., 2017Ostrander, C.M., Owens, J.D., Nielsen, S.G. (2017) Constraining the rate of oceanic deoxygenation leading up to a Cretaceous Oceanic Anoxic Event (OAE-2: ~94 Ma). Science Advances 3, e1701020.
; Owens et al., 2017Owens, J.D., Lyons, T.W., Hardisty, D.S., Lowery, C.M., Lu, Z., Lee, B., Jenkyns, H.C. (2017) Patterns of local and global redox variability during the Cenomanian–Turonian Boundary Event (Oceanic Anoxic Event 2) recorded in carbonates and shales from central Italy. Sedimentology 64, 168–185.
). Regardless of such an offset in timing, the I/(Ca + Mg) spike is tied stratigraphically most closely to the 8–10 ‰ increase in δ13C—rather than the 8 ‰ decrease in δ13C that marks the initial phase of the BSA. More generally, carbonates with I/(Ca + Mg) above the Precambrian baseline (0.5 μmol/mol) are mostly restricted to intervals with rising δ13C values in the Akademikerbren Group (Fig. 2a, light blue bars). These observations imply that iodide oxidation events occurred repeatedly during the middle Neoproterozoic and were coupled to both the carbon cycle and upper ocean redox.Broader landscape of Neoproterozoic oxygenation. There is independent evidence that our observed elevated I/(Ca + Mg) values record a significant transition to more oxidising conditions (Fig. 2a). Thick gypsum deposits occur just below the BSA interval in early Neoproterozoic basins on at least three cratons, following a prolonged interval of sparse gypsum evaporite deposition (Turner and Bekker (2016)
Turner, E.C., Bekker, A. (2016) Thick sulfate evaporite accumulations marking a mid-Neoproterozoic oxygenation event (Ten Stone Formation, Northwest Territories, Canada). Geological Society of America Bulletin 128, 203–222.
). This sharp increase in gypsum deposition is interpreted to reflect a build-up of marine sulphate levels due to an increase in oxidative weathering of the continents or a decrease in pyrite burial prior to the BSA—both of which are consistent with higher atmospheric oxygen levels. Chromium isotope (δ53Cr) data from ironstones and shales suggest very low atmospheric O2 throughout the mid-Proterozoic up to ca. 0.8 Ga (Planavsky et al., 2014Planavsky, N.J., Reinhard, C.T., Wang, X.L., Thomson, D., McGoldrick, P., Rainbird, R.H., Johnson, T., Fischer, W.W., Lyons, T.W. (2014) Low Mid-Proterozoic atmospheric oxygen levels and the delayed rise of animals. Science 346, 635–638.
; Cole et al., 2016Cole, D.B., Reinhard, C.T., Wang, X., Gueguen, B., Halverson, G.P., Gibson, T., Hodgskiss, M.S.W., McKenzie, N.R., Lyons, T.W., Planavsky, N.J. (2016) A shale-hosted Cr isotope record of low atmospheric oxygen during the Proterozoic. Geology 44, 555–558.
). Based on carbon isotope chemostratigraphy, the increase in δ53Cr was initiated prior to the onset of the BSA and hence precedes the I/(Ca + Mg) peak in the Akademikerbreen Group in Svalbard. Furthermore, multiple sulphur isotope data delineate signatures of bacterial sulphur disproportionation in the middle Neoproterozoic, suggesting at least local oxidative sulphur cycling prior to more widespread oxidative cycling beginning in the early Ediacaran Period (Kunzmann et al., 2017Kunzmann, M., Bui, T.H., Crockford, P.W., Halverson, G.P., Scott, C., Lyons, T.W., Wing, B.A. (2017) Bacterial sulfur disproportionation constrains timing of Neoproterozoic oxygenation. Geology 45, 207–210.
). Each of these redox indicators reflects different processes, controls, and challenges, yet they consistently imply oxygenation in the atmosphere-ocean system at approximately 800 Ma.Following the BSA, I/(Ca + Mg) values in the Akademikerbreen Group returned to levels mostly below the Proterozoic baseline. Similar trends are recorded for the other Precambrian events marked by elevated I/(Ca + Mg) (Hardisty et al., 2017
Hardisty, D.S., Lu, Z., Bekker, A., Diamond, C.W., Gill, B.C., Jiang, G., Kah, L.C., Knoll, A.H., Loyd, S.J., Osburn, M.R., Planavsky, N.J., Wang, C., Zhou, X., Lyons, T.W. (2017) Perspectives on Proterozoic surface ocean redox from iodine contents in ancient and recent carbonate. Earth and Planetary Science Letters 463, 159–170.
), suggesting a pattern of dynamic behaviour, with long term deepening of the oxycline occurring much later in Earth history. Such a pattern of episodic (transient) Neoproterozoic oxygenation is also observed in other proxy records such as S, Mo, and Fe (Dahl et al., 2010Dahl, T.W., Hammarlund, E.U., Anbar, A.D., Bond, D.P.G., Gill, B.C., Gordon, G.W., Knoll, A.H., Nielsen, A.T., Schovsbo, N.H., Canfield, D.E. (2010) Devonian rise in atmospheric oxygen correlated to the radiations of terrestrial plants and large predatory fish. Proceedings of the National Academy of Sciences of the United States of America 107, 17911–17915.
; Sperling et al., 2015Sperling, E.A., Wolock, C.J., Morgan, A.S., Gill, B.C., Kunzmann, M., Halverson, G.P., Macdonald, F.A., Knoll, A.H., Johnston, D.T. (2015) Statistical analysis of iron geochemical data suggests limited late Proterozoic oxygenation. Nature 523, 451–454.
; Kunzmann et al., 2017Kunzmann, M., Bui, T.H., Crockford, P.W., Halverson, G.P., Scott, C., Lyons, T.W., Wing, B.A. (2017) Bacterial sulfur disproportionation constrains timing of Neoproterozoic oxygenation. Geology 45, 207–210.
). This relationship implies a fundamental instability in oxygen levels that may have extended into, and through, the Ediacaran and perhaps into the Palaeozoic (Sperling et al., 2015Sperling, E.A., Wolock, C.J., Morgan, A.S., Gill, B.C., Kunzmann, M., Halverson, G.P., Macdonald, F.A., Knoll, A.H., Johnston, D.T. (2015) Statistical analysis of iron geochemical data suggests limited late Proterozoic oxygenation. Nature 523, 451–454.
; Sahoo et al., 2016Sahoo, S.K., Planavsky, N.J., Jiang, G., Kendall, B., Owens, J.D., Wang, X., Shi, X., Anbar, A.D., Lyons, T.W. (2016) Oceanic oxygenation events in the anoxic Ediacaran ocean. Geobiology 14, 457–468.
). The details of this behaviour and its possible implications for the life emerging remain targets for future research.top
Acknowledgements
ZL, WL, XZ acknowledge NSF EAR-1349252 and OCE-1232620. GH and RR acknowledge support from NSERC Discovery grants. AB acknowledges NSERC Discovery and Accelerator Grants as well as the support from the Society of Independent Thinkers. Funds from the NSF and the NASA Astrobiology Institute supported the contributions of DH and TL.
Editor: Liane G. Benning
top
References
Cohen, P.A., Macdonald, F.A. (2015) The Proterozoic Record of Eukaryotes. Paleobiology 41, 610–632.
 Show in context
 The BSA is broadly coeval with a proposed eukaryotic diversification event, as well as an inferred rise in atmospheric O2 (Fig. 1) (Planavsky et al., 2014; Cohen and Macdonald, 2015; Thomson et al., 2015; Cole et al., 2016; Turner and Bekker, 2016).
View in article
Cole, D.B., Reinhard, C.T., Wang, X., Gueguen, B., Halverson, G.P., Gibson, T., Hodgskiss, M.S.W., McKenzie, N.R., Lyons, T.W., Planavsky, N.J. (2016) A shale-hosted Cr isotope record of low atmospheric oxygen during the Proterozoic. Geology 44, 555–558.
 Show in context
 The BSA is broadly coeval with a proposed eukaryotic diversification event, as well as an inferred rise in atmospheric O2 (Fig. 1) (Planavsky et al., 2014; Cohen and Macdonald, 2015; Thomson et al., 2015; Cole et al., 2016; Turner and Bekker, 2016).
View in article
Chromium isotope (δ53Cr) data from ironstones and shales suggest very low atmospheric O2 throughout the mid-Proterozoic up to ca. 0.8 Ga (Planavsky et al., 2014; Cole et al., 2016).
View in article
Dahl, T.W., Hammarlund, E.U., Anbar, A.D., Bond, D.P.G., Gill, B.C., Gordon, G.W., Knoll, A.H., Nielsen, A.T., Schovsbo, N.H., Canfield, D.E. (2010) Devonian rise in atmospheric oxygen correlated to the radiations of terrestrial plants and large predatory fish. Proceedings of the National Academy of Sciences of the United States of America 107, 17911–17915.
 Show in context
 Such a pattern of episodic (transient) Neoproterozoic oxygenation is also observed in other proxy records such as S, Mo, and Fe (Dahl et al., 2010; Sperling et al., 2015; Kunzmann et al., 2017).
View in article
Gilleaudeau, G.J., Frei, R., Kaufman, A.J., Kah, L.C., Azmy, K., Bartley, J.K., Chernyavskiy, P., Knoll, A.H. (2016) Oxygenation of the mid-Proterozoic atmosphere: clues from chromium isotopes in carbonates. Geochemical Perspectives Letters 2, 178–187.
 Show in context
 Figure 1 [...] Blue bars mark intervals where there are data consistent with possible oxygenation events (Kendall et al., 2009; Planavsky et al., 2014; Gilleaudeau et al., 2016) relative to the long term atmospheric pO2 curve (green shades from Lyons et al., 2014; green dash line from Sperling et al., 2015) and major evolutionary events (orange) in biosphere.
View in article
Halverson, G.P., Hoffman, P.F., Schrag, D.P., Maloof, A.C., Rice, A.H.N. (2005) Toward a Neoproterozoic composite carbon-isotope record. Geological Society of America Bulletin 117, 1181–1207.
 Show in context
 The ca. 810–800 Ma Bitter Springs Anomaly (BSA) is a long-lived negative excursion in seawater δ13C (Halverson et al., 2005).
View in article
Halverson, G.P., Maloof, A.C., Schrag, D.P., Dudas, F.O., Hurtgen, M.T. (2007) Stratigraphy and geochemistry of a ca 800 Ma negative carbon isotope interval in northeastern Svalbard. Chemical Geology 237, 5–27.
 Show in context
 A previous study through this interval (of the lower Svanbergfjellet Formation) demonstrated that the dolomitisation of these samples was early, and fabric retentive, and that no subsequent alteration has overprinted the geochemical signatures of these rocks (Halverson et al., 2007).
View in article
Firstly, all the Svalbard samples were preserved already at shallow depth (Halverson et al., 2007).
View in article
Hardisty, D.S., Lu, Z., Planavsky, N., Bekker, A., Philippot, P., Zhou, X., Lyons, T.W. (2014) An iodine record of Paleoproterozoic surface ocean oxygenation. Geology 42, 619–622.
 Show in context
 This peak greatly exceeds the maximum values found throughout the preceding Precambrian, including the Great Oxidation Event (GOE) at ca. 2.3–2.4 Ga (~2 μmol/mol; Hardisty et al., 2014), but is comparable to the highest values recorded during the Ediacaran (ca. 580 Ma) Shuram Excursion (Hardisty et al., 2017).
View in article
This response is predicted because atmospheric pO2 is one of the major controls on oxycline depth. I/(Ca + Mg) first rose to ~2 μmol/mol during the ca. 2.2–2.0 Ga Lomagundi Event following the GOE (Hardisty et al., 2014).
View in article
Hardisty, D.S., Lu, Z., Bekker, A., Diamond, C.W., Gill, B.C., Jiang, G., Kah, L.C., Knoll, A.H., Loyd, S.J., Osburn, M.R., Planavsky, N.J., Wang, C., Zhou, X., Lyons, T.W. (2017) Perspectives on Proterozoic surface ocean redox from iodine contents in ancient and recent carbonate. Earth and Planetary Science Letters 463, 159–170.
 Show in context
 During Precambrian oxidation events in the relatively low pO2 world (Fig. 1), dolostones rarely have I/(Ca + Mg) values above 2 μmol/mol (Hardisty et al., 2017).
View in article
Figure 1 Secular trend of I/(Ca + Mg). White (I/Ca; limestone) and gray (I/(Ca + Mg); dolostone) dots are from Hardisty et al. (2017).
View in article
Excluding the samples from intervals with an oxygen rise suggested by other proxies, over 95 % of data (n = 250) from all previously published Proterozoic samples have I/(Ca + Mg) of < 0.5 μmol/mol, (Hardisty et al., 2017).
View in article
This peak greatly exceeds the maximum values found throughout the preceding Precambrian, including the Great Oxidation Event (GOE) at ca. 2.3–2.4 Ga (~2 μmol/mol; Hardisty et al., 2014), but is comparable to the highest values recorded during the Ediacaran (ca. 580 Ma) Shuram Excursion (Hardisty et al., 2017).
View in article
This is opposite of a trend observed in a comprehensive study of Neogene-Quaternary carbonates, which demonstrated that diagenesis, and most prominently dolomitisation, typically decreases the primary I/(Ca + Mg) signal (Hardisty et al., 2017).
View in article
These Amundsen data confirm again (Hardisty et al., 2017) that mixing authigenic carbonates into primary carbonates cannot cause a false positive in I/Ca values.
View in article
Studies of recent carbonates from Bahamas (Clino) and the Pleistocene Key Largo limestone have found that carbonate recrystallisation during subaerial exposure and associated diagenesis in meteoric waters are most likely to reduce iodine in carbonates because iodine concentrations in fresh water are orders of magnitude lower than those in seawater (Hardisty et al., 2017).
View in article
Relatively high values are also available from ca. 1.4 Ga carbonates in North China and the middle Ediacaran Shuram excursion (SE) (Hardisty et al., 2017).
View in article
Similar trends are recorded for the other Precambrian events marked by elevated I/(Ca + Mg) (Hardisty et al., 2017), suggesting a pattern of dynamic behaviour, with long term deepening of the oxycline occurring much later in Earth history.
View in article
Kendall, B., Creaser, R.A., Gordon, G.W., Anbar, A.D. (2009) Re–Os and Mo isotope systematics of black shales from the Middle Proterozoic Velkerri and Wollogorang Formations, McArthur Basin, northern Australia. Geochimica et Cosmochimica Acta 73, 2534–2558.
 Show in context
 Figure 1 [...] Blue bars mark intervals where there are data consistent with possible oxygenation events (Kendall et al., 2009; Planavsky et al., 2014; Gilleaudeau et al., 2016) relative to the long term atmospheric pO2 curve (green shades from Lyons et al., 2014; green dash line from Sperling et al., 2015) and major evolutionary events (orange) in biosphere.
View in article
Kunzmann, M., Bui, T.H., Crockford, P.W., Halverson, G.P., Scott, C., Lyons, T.W., Wing, B.A. (2017) Bacterial sulfur disproportionation constrains timing of Neoproterozoic oxygenation. Geology 45, 207–210.
 Show in context
 Figure 2 [...] BSD stands for bacterial sulphur disproportionation, as recorded in multiple sulphur isotope data (Kunzmann et al., 2017).
View in article
Furthermore, multiple sulphur isotope data delineate signatures of bacterial sulphur disproportionation in the middle Neoproterozoic, suggesting at least local oxidative sulphur cycling prior to more widespread oxidative cycling beginning in the early Ediacaran Period (Kunzmann et al., 2017).
View in article
Such a pattern of episodic (transient) Neoproterozoic oxygenation is also observed in other proxy records such as S, Mo, and Fe (Dahl et al., 2010; Sperling et al., 2015; Kunzmann et al., 2017).
View in article
Lu, Z., Jenkyns, H.C., Rickaby, R.E.M. (2010) Iodine to calcium ratios in marine carbonate as a paleo-redox proxy during oceanic anoxic events. Geology 38, 1107–1110.
 Show in context
 Further, IO3- is the only chemical form of iodine that is incorporated into the structure of carbonate minerals (Lu et al., 2010), substituting for CO32- (Podder et al., 2017).
View in article
The long term accuracy is checked by frequently repeated analysis of the reference material JCp-1 (Lu et al., 2010).
View in article
Authigenic carbonate in organic-rich sediments form in anoxic porewaters where I- is the only iodine species and is excluded from the carbonate mineral lattice (Lu et al., 2010).
View in article
Lu, Z., Hoogakker, B.A.A., C.D., H., Zhou, X., Thomas, E., Gutchess, K., Lu, W., Jones, L., Rickaby, R.E.M. (2016) Oxygen depletion recorded in upper waters of the glacial Southern Ocean. Nature Communications 7, 11146.
 Show in context
 Modern OMZs are characterised by low I/Ca (~0.5–2.5 μmol/mol) compared to that of the well-oxygenated waters (~5 μmol/mol) (Lu et al., 2016).
View in article
Finally, in the modern ocean, sea surface iodate concentrations are relatively low above a shallow OMZs (even at modern pO2 level), resulting in I/Ca ratios below ~2.5 µmol/mol (Lu et al., 2016)—which stand in stark contrast to the observed very high BSA values of up to ~8 µmol/mol.
View in article
Modern carbonate fossils show very low ratios of ~0.5 μmol/mol directly above strong and shallow OMZs, and >5 μmol/mol at well-oxygenated locations, indicating that I/Ca is a sensitive local to regional proxy for subsurface O2-depletion and for the depth of oxycline in the water column (Lu et al., 2016).
View in article
Lyons, T.W., Reinhard, C.T., Planavsky, N.J. (2014) The rise of oxygen in Earth's early ocean and atmosphere. Nature 506, 307–315.
 Show in context
 The second largest rise in atmospheric oxygen in Earth’s history might have occurred during the Neoproterozoic Era or the Palaeozoic (e.g., Lyons et al., 2014; Sperling et al., 2015).
View in article
Figure 1 [...] Blue bars mark intervals where there are data consistent with possible oxygenation events (Kendall et al., 2009; Planavsky et al., 2014; Gilleaudeau et al., 2016) relative to the long term atmospheric pO2 curve (green shades from Lyons et al., 2014; green dash line from Sperling et al., 2015) and major evolutionary events (orange) in biosphere.
View in article
Macdonald, F.A., Schmitz, M.D., Crowley, J.L., Roots, C.F., Jones, D.S., Maloof, A.C., Strauss, J.V., Cohen, P.A., Johnston, D.T., Schrag, D.P. (2010) Calibrating the Cryogenian. Science 327, 1241–1243.
 Show in context
 The Neoproterozoic is distinguished by dramatic palaeoenvironmental and biological changes, manifested in a pair of global glaciations, extreme fluctuations in δ13C values of seawater, and the emergence of macroscopic animals (Macdonald et al., 2010).
View in article
Ostrander, C.M., Owens, J.D., Nielsen, S.G. (2017) Constraining the rate of oceanic deoxygenation leading up to a Cretaceous Oceanic Anoxic Event (OAE-2: ~94 Ma). Science Advances 3, e1701020.
 Show in context
 Similarly, there is evidence for shifting marine redox immediately prior to the positive δ13C excursion due to global carbon burial defining the onset of Mesozoic Oceanic Anoxic Event 2 (Zhou et al., 2015; Ostrander et al., 2017; Owens et al., 2017).
View in article
Owens, J.D., Lyons, T.W., Hardisty, D.S., Lowery, C.M., Lu, Z., Lee, B., Jenkyns, H.C. (2017) Patterns of local and global redox variability during the Cenomanian–Turonian Boundary Event (Oceanic Anoxic Event 2) recorded in carbonates and shales from central Italy. Sedimentology 64, 168–185.
 Show in context
 Similarly, there is evidence for shifting marine redox immediately prior to the positive δ13C excursion due to global carbon burial defining the onset of Mesozoic Oceanic Anoxic Event 2 (Zhou et al., 2015; Ostrander et al., 2017; Owens et al., 2017).
View in article
Planavsky, N.J., Reinhard, C.T., Wang, X.L., Thomson, D., McGoldrick, P., Rainbird, R.H., Johnson, T., Fischer, W.W., Lyons, T.W. (2014) Low Mid-Proterozoic atmospheric oxygen levels and the delayed rise of animals. Science 346, 635–638.
 Show in context
 Podder, J., Lin, J., Sun, W., Botis, S.M., Tse, J., Chen, N., Hu, Y., Li, D., Seaman, J., Pan, Y. (2017) Iodate in calcite and vaterite: Insights from synchrotron X-ray absorption spectroscopy and first-principles calculations. Geochimica et Cosmochimica Acta 198, 218–228.
 Show in context
 Further, IO3- is the only chemical form of iodine that is incorporated into the structure of carbonate minerals (Lu et al., 2010), substituting for CO32- (Podder et al., 2017).
View in article
Rue, E.L., Smith, G.J., Cutter, G.A., Bruland, K.W. (1997) The response of trace element redox couples to suboxic conditions in the water column. Deep-Sea Research Part I-Oceanographic Research Papers 44, 113–134.
 Show in context
 Iodate is quantitatively converted to I- in low O2 settings such as oxygen minimum zones (OMZs) (Rue et al., 1997).
View in article
Sahoo, S.K., Planavsky, N.J., Jiang, G., Kendall, B., Owens, J.D., Wang, X., Shi, X., Anbar, A.D., Lyons, T.W. (2016) Oceanic oxygenation events in the anoxic Ediacaran ocean. Geobiology 14, 457–468.
 Show in context
 This relationship implies a fundamental instability in oxygen levels that may have extended into, and through, the Ediacaran and perhaps into the Palaeozoic (Sperling et al., 2015; Sahoo et al., 2016).
View in article
Sperling, E.A., Wolock, C.J., Morgan, A.S., Gill, B.C., Kunzmann, M., Halverson, G.P., Macdonald, F.A., Knoll, A.H., Johnston, D.T. (2015) Statistical analysis of iron geochemical data suggests limited late Proterozoic oxygenation. Nature 523, 451–454.
 Show in context
 The second largest rise in atmospheric oxygen in Earth’s history might have occurred during the Neoproterozoic Era or the Palaeozoic (e.g., Lyons et al., 2014; Sperling et al., 2015).
View in article
Figure 1 [...] Blue bars mark intervals where there are data consistent with possible oxygenation events (Kendall et al., 2009; Planavsky et al., 2014; Gilleaudeau et al., 2016) relative to the long term atmospheric pO2 curve (green shades from Lyons et al., 2014; green dash line from Sperling et al., 2015) and major evolutionary events (orange) in biosphere.
View in article
Such a pattern of episodic (transient) Neoproterozoic oxygenation is also observed in other proxy records such as S, Mo, and Fe (Dahl et al., 2010; Sperling et al., 2015; Kunzmann et al., 2017).
View in article
This relationship implies a fundamental instability in oxygen levels that may have extended into, and through, the Ediacaran and perhaps into the Palaeozoic (Sperling et al., 2015; Sahoo et al., 2016).
View in article
Thomson, D., Rainbird, R.H., Planavsky, N., Lyons, T.W., Bekker, A. (2015) Chemostratigraphy of the Shaler Supergroup, Victoria Island, NW Canada: A record of ocean composition prior to the Cryogenian glaciations. Precambrian Research 263, 232–245.
 Show in context
 The BSA is broadly coeval with a proposed eukaryotic diversification event, as well as an inferred rise in atmospheric O2 (Fig. 1) (Planavsky et al., 2014; Cohen and Macdonald, 2015; Thomson et al., 2015; Cole et al., 2016; Turner and Bekker, 2016).
View in article
In drill core samples from the Wynniatt Formation (Shaler Supergroup) in the Amundsen Basin (Thomson et al., 2015), the iodine signal drops to zero during the BSA interval in organic matter-rich samples that have δ13C values well below typical BSA values (Fig. 2c).
View in article
These data suggest a large authigenic carbonate component (Thomson et al., 2015).
View in article
Turner, E.C., Bekker, A. (2016) Thick sulfate evaporite accumulations marking a mid-Neoproterozoic oxygenation event (Ten Stone Formation, Northwest Territories, Canada). Geological Society of America Bulletin 128, 203–222.
 Show in context
 The BSA is broadly coeval with a proposed eukaryotic diversification event, as well as an inferred rise in atmospheric O2 (Fig. 1) (Planavsky et al., 2014; Cohen and Macdonald, 2015; Thomson et al., 2015; Cole et al., 2016; Turner and Bekker, 2016).
View in article
Figure 2 [...] Gypsum evaporite deposits are from Turner and Bekker (2016).
View in article
Thick gypsum deposits occur just below the BSA interval in early Neoproterozoic basins on at least three cratons, following a prolonged interval of sparse gypsum evaporite deposition (Turner and Bekker, 2016).
View in article
Wong, G.T.F. (1991) The marine geochemistry of iodine. Reviews in Aquatic Sciences 4, 45–73.
 Show in context
 The thermodynamically stable forms of iodine in seawater are iodate (IO3-) and iodide (I-) (Wong, 1991).
View in article
Zhou, X., Jenkyns, H.C., Owens, J.D., Junium, C.K., Zheng, X., Sageman, B., Hardisty, D.S., Lyons, T.W., Ridgwell, A., Lu, Z. (2015) Upper ocean oxygenation dynamics from I/Ca ratios during the Cenomanian-Turonian OAE 2. Paleoceanography 30, 510–526.
 Show in context
 I/(Ca + Mg) ratios above 4 μmol/mol found in this study (Fig. 1) reach a range characteristic of Cenozoic and Mesozoic carbonate iodine records (Zhou et al., 2015).
View in article
Similarly, there is evidence for shifting marine redox immediately prior to the positive δ13C excursion due to global carbon burial defining the onset of Mesozoic Oceanic Anoxic Event 2 (Zhou et al., 2015; Ostrander et al., 2017; Owens et al., 2017).
View in article
top
Supplementary Information

Figure S-1 Palaeogeographic reconstruction for 825 Ma (modified from Li et al., 2013). Stars mark sampled locations (ES = East Svalbard; AB = Amundsen Basin). Craton names: A = Amazon; An = Antarctica; B = Baltica; C = Congo; I = India; K = Kalahari; NA = northern Australia; R = Rio Plata; S = Siberia; SA = southern Australia; SC = South China; T = Tarim; WA = West Africa.
The BSA and Sample Materials
The BSA anomaly has been documented in basins on multiple cratons, and radiometric age constraints from northwestern Canada (Macdonald et al., 2010) and Ethiopia (Swanson-Hysell et al., 2015), along with Sr isotope data, indicate that it records a global and long-lived perturbation to seawater that began ca. 810 Ma. In Svalbard, where it is documented in the greatest detail (Halverson et al., 2007), the BSA is defined at the base by a negative 8 ‰ shift in δ13C that spans a minor subaerial unconformity in the middle Grusdievbreen Formation. Low δ13C values (-4 to 0 ‰) persist for ~300 m of section deposited over 5–10 Myr (Swanson-Hysell et al., 2015), and a shift back to high δ13C (>5 ‰) occurs in a transgressive systems tract above a second subaerial unconformity within the lower Svanbergfjellet Formation.
δ13C data presented here are from four formations in the Akademikerbreen Group, spanning the BSA: the Grusdievbreen, Svanbergfjellet, Draken, and Backlundtoppen formations. We plot the data as a single composite section, constructed by correlating individual partial sections, using well defined formation and member boundaries that can be easily identified across the outcrop belt (Knoll and Swett, 1990; Halverson et al., 2005). Most of the carbon isotope data shown in Figure 2 were previously published (Halverson et al., 2005, 2007); however, some new data from previously studied stratigraphic sections are included. The new data were acquired on sample powders in the McGill Stable Isotope Laboratory on a Nu Instruments Perspective dual inlet mass spectrometer, coupled to a NuCarb automated carbonate preparation device. The reproducibility of standards was typically better than 0.1 ‰.
Dolomitisation

Figure S-2 I/(Ca + Mg) vs. Mg/Ca. Blue data points for multiple Neogene diagenetic scenarios (Hardisty et al., 2017). White circles for Proterozoic carbonates (Hardisty et al., 2017). Yellow points are from this study.
Data Table
Table S-1 is available for download as an Excel file below.
Table S-1 I/(Mg + Ca) and δ13C data from (a) Svalbard and (b) the Amundsen Basin.
Supplementary Information References
Halverson, G.P., Maloof, A.C., Schrag, D.P., Dudas, F.O., Hurtgen, M. (2007) Stratigraphy and geochemistry of a ca 800 Ma negative carbon isotope interval in northeastern Svalbard. Chemical Geology 237, 5–27.
Hardisty, D.S., Lu, Z., Bekker, A., Diamond, C.W., Gill, B.C., Jiang, G., Kah, L.C., Knoll, A.H., Loyd, S.J., Osburn, M.R., Planavsky, N.J., Wang, C., Zhou, X., Lyons, T.W. (2017) Perspectives on Proterozoic surface ocean redox from iodine contents in ancient and recent carbonate. Earth and Planetary Science Letters 463, 159–170.
Knoll, A.H., Swett, K. (1990) Carbonate deposition during the late Proterozoic era - an example from Spitsbergen. American Journal of Science 290A, 104–132.
Li, Z.X., Evans, D.A.D., Halverson, G.P. (2013) Neoproterozoic glaciations in a revised global palaeogeography from the breakup of Rodinia to the assembly of Gondwanaland. Sedimentary Geology 294, 219–232.
Macdonald, F.A., Schmitz, M.D., Crowley, J.L., Roots, C.F., Jones, D.S., Maloof, A.C., Strauss, J.V., Cohen, P.A., Johnston, D.T., Schrag, D.P. (2010) Calibrating the Cryogenian. Science 327, 1241–1243.
Swanson-Hysell, N.L., Maloof, A.C., Condon, D.J., Jenkin, G.R.T., Alene, M., Tremblay, M.M., Tesema, T., Rooney, A.D., Haileab, B. (2015) Stratigraphy and geochronology of the Tambien Group, Ethiopia: Evidence for globally synchronous carbon isotope change in the Neoproterozoic. Geology 43, 323–326.
Figures and Tables
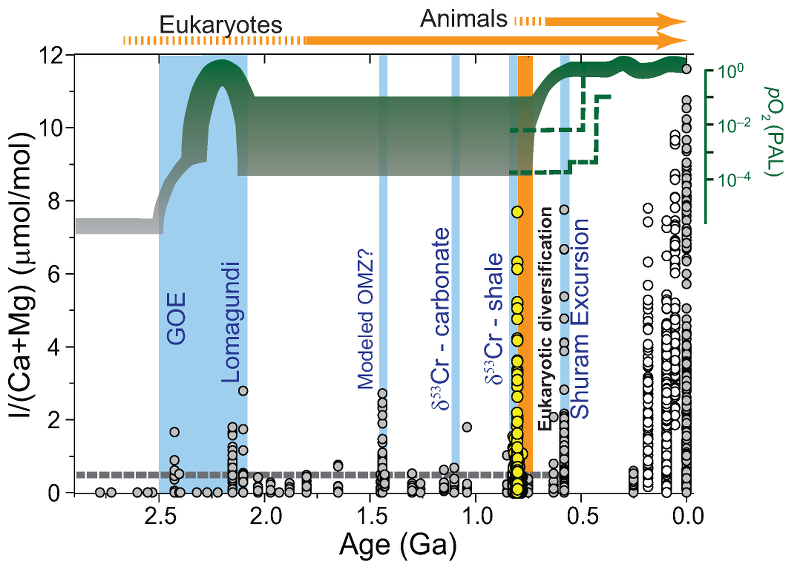
Figure 1 Secular trend of I/(Ca + Mg). White (I/Ca; limestone) and gray (I/(Ca + Mg); dolostone) dots are from Hardisty et al. (2017)
Hardisty, D.S., Lu, Z., Bekker, A., Diamond, C.W., Gill, B.C., Jiang, G., Kah, L.C., Knoll, A.H., Loyd, S.J., Osburn, M.R., Planavsky, N.J., Wang, C., Zhou, X., Lyons, T.W. (2017) Perspectives on Proterozoic surface ocean redox from iodine contents in ancient and recent carbonate. Earth and Planetary Science Letters 463, 159–170.
. Yellow dots are from this study. Blue bars mark intervals where there are data consistent with possible oxygenation events (Kendall et al., 2009Kendall, B., Creaser, R.A., Gordon, G.W., Anbar, A.D. (2009) Re–Os and Mo isotope systematics of black shales from the Middle Proterozoic Velkerri and Wollogorang Formations, McArthur Basin, northern Australia. Geochimica et Cosmochimica Acta 73, 2534–2558.
; Planavsky et al., 2014Planavsky, N.J., Reinhard, C.T., Wang, X.L., Thomson, D., McGoldrick, P., Rainbird, R.H., Johnson, T., Fischer, W.W., Lyons, T.W. (2014) Low Mid-Proterozoic atmospheric oxygen levels and the delayed rise of animals. Science 346, 635–638.
; Gilleaudeau et al., 2016Gilleaudeau, G.J., Frei, R., Kaufman, A.J., Kah, L.C., Azmy, K., Bartley, J.K., Chernyavskiy, P., Knoll, A.H. (2016) Oxygenation of the mid-Proterozoic atmosphere: clues from chromium isotopes in carbonates. Geochemical Perspectives Letters 2, 178–187.
) relative to the long term atmospheric pO2 curve (green shades from Lyons et al., 2014Lyons, T.W., Reinhard, C.T., Planavsky, N.J. (2014) The rise of oxygen in Earth's early ocean and atmosphere. Nature 506, 307–315.
; green dash line from Sperling et al., 2015Sperling, E.A., Wolock, C.J., Morgan, A.S., Gill, B.C., Kunzmann, M., Halverson, G.P., Macdonald, F.A., Knoll, A.H., Johnston, D.T. (2015) Statistical analysis of iron geochemical data suggests limited late Proterozoic oxygenation. Nature 523, 451–454.
) and major evolutionary events (orange) in biosphere. The grey dashed line at 0.5 μmol/mol is the Precambrian I/(Ca + Mg) baseline.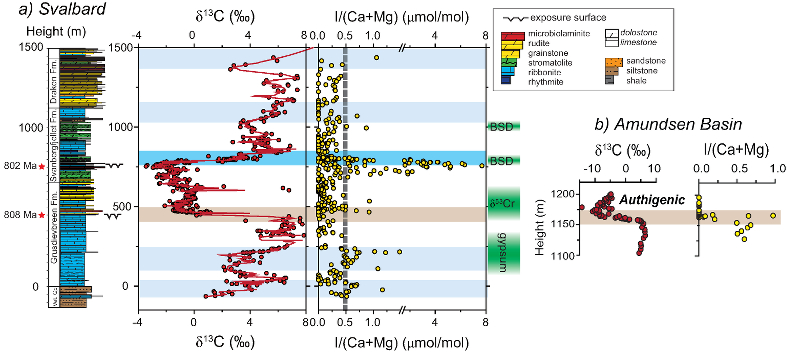
Figure 2 I/(Ca + Mg) data from (a) Svalbard and (b) Amundsen basin. Values above 0.5 μmol/mol (Fig. 1) are most commonly associated with the rise in δ13C (blue bar). Darker blue bar highlights the recovery phase of BSA with a major increase in δ13C. The decrease in δ13C that defines the base of the BSA is indicated with a brown bar, and data from Svalbard and the Amundsen Basin are lined up accordingly. Note the axis for I/(Ca + Mg) is broken at 1.50 to better illustrate stratigraphic trends below 2 μmol/mol. Green boxes show the timing of increases in O2 levels as stratigraphically correlated to the Svalbard section. Gypsum evaporite deposits are from Turner and Bekker (2016)
Turner, E.C., Bekker, A. (2016) Thick sulfate evaporite accumulations marking a mid-Neoproterozoic oxygenation event (Ten Stone Formation, Northwest Territories, Canada). Geological Society of America Bulletin 128, 203–222.
. δ53Cr signature is from Planavsky et al. (2014)Planavsky, N.J., Reinhard, C.T., Wang, X.L., Thomson, D., McGoldrick, P., Rainbird, R.H., Johnson, T., Fischer, W.W., Lyons, T.W. (2014) Low Mid-Proterozoic atmospheric oxygen levels and the delayed rise of animals. Science 346, 635–638.
. BSD stands for bacterial sulphur disproportionation, as recorded in multiple sulphur isotope data (Kunzmann et al., 2017Kunzmann, M., Bui, T.H., Crockford, P.W., Halverson, G.P., Scott, C., Lyons, T.W., Wing, B.A. (2017) Bacterial sulfur disproportionation constrains timing of Neoproterozoic oxygenation. Geology 45, 207–210.
).Back to article
Supplementary Figures and Tables
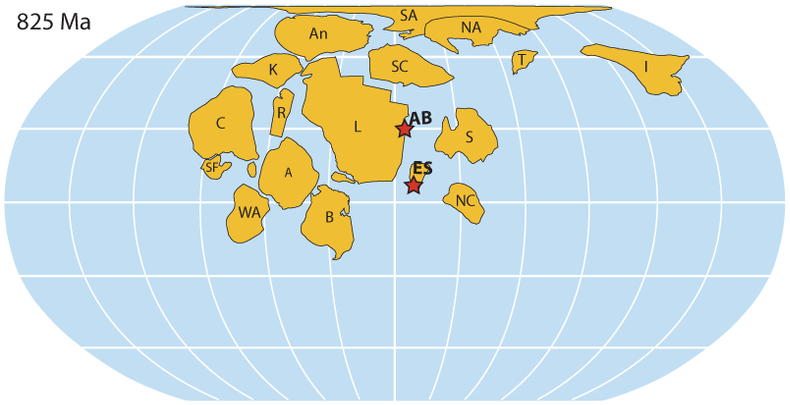
Figure S-1 Palaeogeographic reconstruction for 825 Ma (modified from Li et al., 2013). Stars mark sampled locations (ES = East Svalbard; AB = Amundsen Basin). Craton names: A = Amazon; An = Antarctica; B = Baltica; C = Congo; I = India; K = Kalahari; NA = northern Australia; R = Rio Plata; S = Siberia; SA = southern Australia; SC = South China; T = Tarim; WA = West Africa.
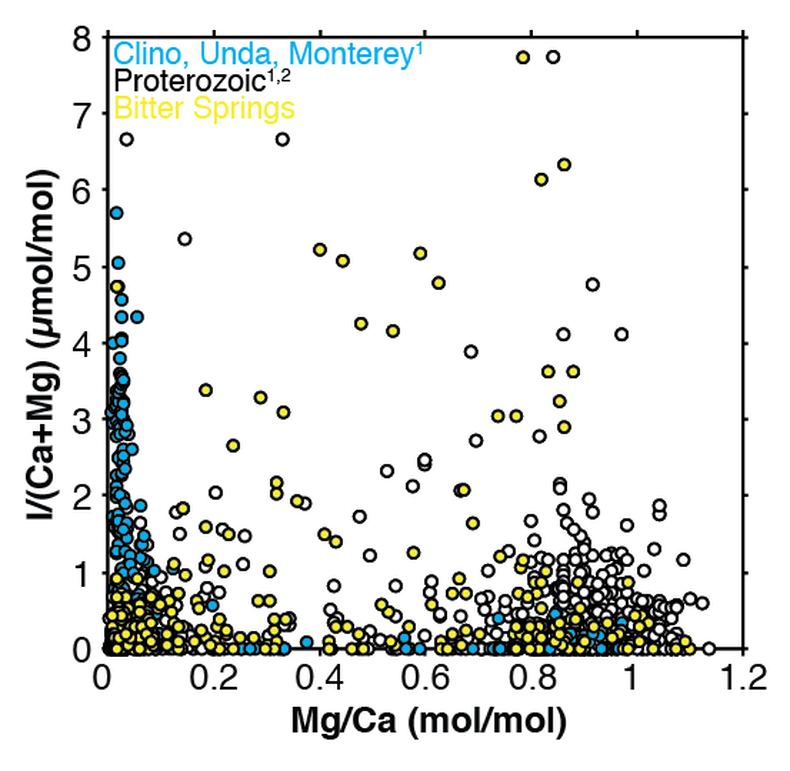
Figure S-2 I/(Ca + Mg) vs. Mg/Ca. Blue data points for multiple Neogene diagenetic scenarios (Hardisty et al., 2017). White circles for Proterozoic carbonates (Hardisty et al., 2017). Yellow points are from this study.
Table S-1 I/(Mg + Ca) and δ13C data from (a) Svalbard and (b) the Amundsen Basin.


