Direct sensing of total alkalinity profile in a stratified lake
Affiliations | Corresponding Author | Cite as | Funding informationKeywords: thin layer, acid-base titration, alkalinity sensor, ionophore-based membranes
- Share this article


Article views:8,595Cumulative count of HTML views and PDF downloads.
- Download Citation
- Rights & Permissions
Abstract

Figures and Tables
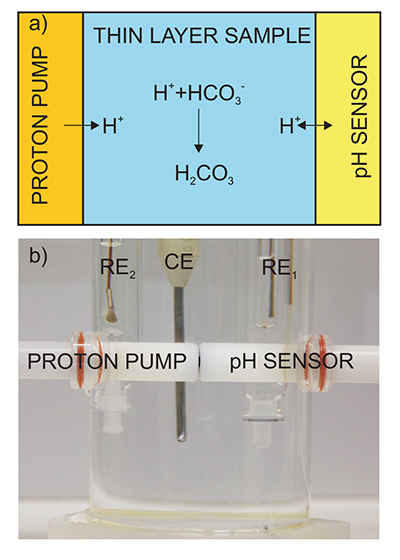 Figure 1 (a) Schematic illustration of the alkalinity probe. (b) Electrochemical cell composed of a proton pump and a pH probe placed directly opposite. The two reference electrodes (RE1 and RE2) and counter electrode (CE) are inserted in the bulk sample solution. The carbonate species are titrated with the hydrogen ions released from the proton pump. The resulting change of pH is subsequently assessed potentiometrically at the pH probe. | 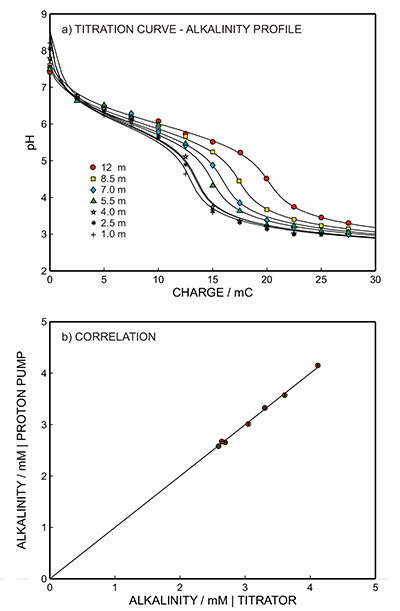 Figure 2 (a) The titration curve for various depths in the range of 1 to 12.5 m using the thin layer instrument. Solid line is theoretical. (b) Correlation between the thin layer chemical modulation method and volumetric acid-base titration reference method (ISO 9963-1:1994). Solid line shows ideality with unity slope and zero intercept. |  Figure 3 (a) Total alkalinity depth profile and (b) pH depth profile obtaining during field monitoring on the Lake Greifen (31 August 2015). |
| Figure 1 | Figure 2 | Figure 3 |
Supplementary Figures and Tables
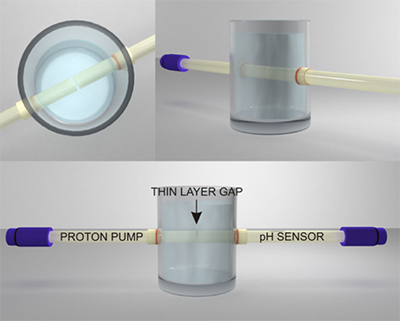 Figure S-1 Schematic illustration of the electrochemical cell. The proton pump was placed directly opposite the pH sensor while the thin layer sample gap was between the pH sensor and the proton pump. The counter electrode and reference electrode for the proton pump (not shown) were placed in the sample solution. The reference electrode for the pH sensor was also in the sample solution in the beaker. | 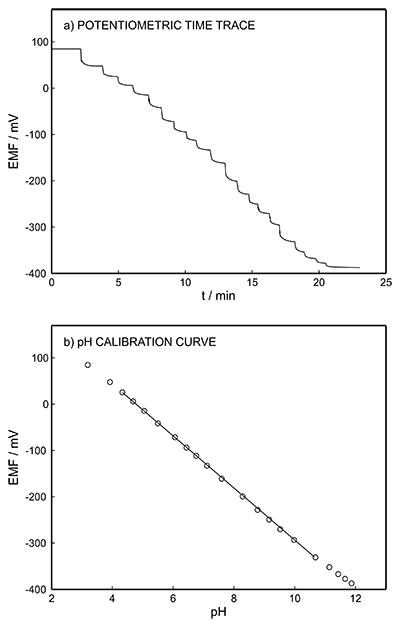 Figure S-2 (a) Potentiometric time trace for the pH sensor in the pH range of 3 to 12. (b) Corresponding pH calibration curve. The observed electrode slope was 57.3 mV. | 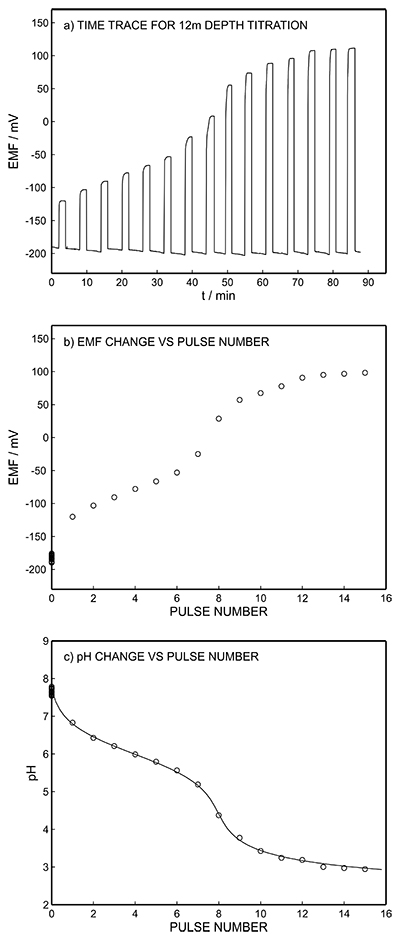 Figure S-3 (a) Potentiometric time trace at the pH probe for the titration of the Lake Greifen sample obtained at 12 m depth. (b) The obtained EMF value after applying each pulse as a function of the pulse number. (c) The calculated pH value at the pH sensor for each pulse. | 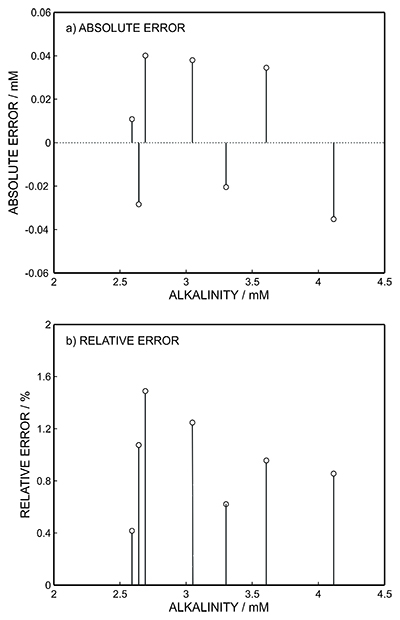 Figure S-4 (a) Absolute error for the alkalinity detection in mM. (b) Percentage relative error for the alkalinity determination. The average relative error of 0.95 % (less than 1 %) was obtained for the alkalinity detection by the methodology. | 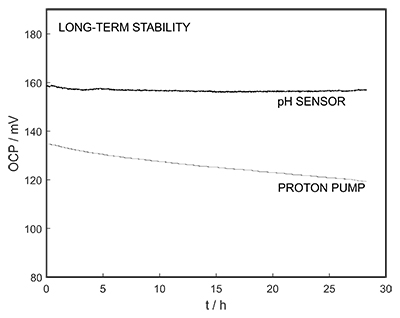 Figure S-5 Long-term stability for both pH sensor and proton pump. | 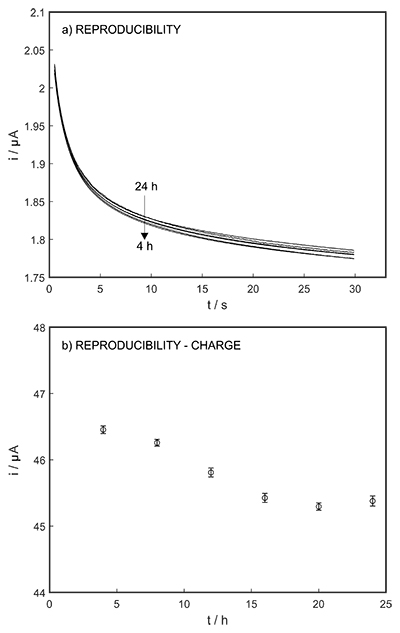 Figure S-6 (a) Reproducibility of the potential pulse by applying potential pulse of 300 mV vs. OCP for 30 s within one day. (b) Integrated charge of the potential pulse for every 4 hours. |
| Figure S-1 | Figure S-2 | Figure S-3 | Figure S-4 | Figure S-5 | Figure S-6 |
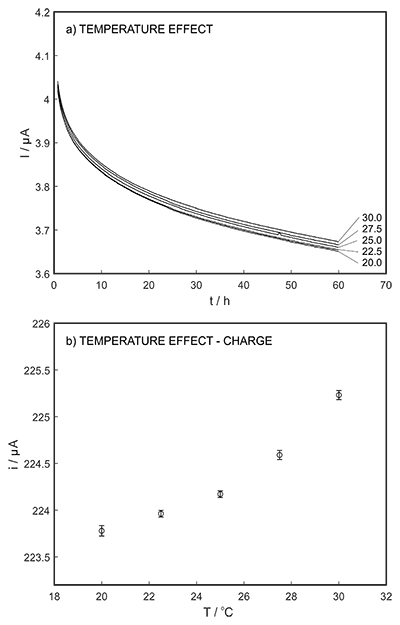 Figure S-7 (a) Influence of temperature on the released charge by applying potential pulse of 600 mV vs. OCP over 60 s. (b) The obtained charge value for various temperature within the range of 20 to 30 oC. | 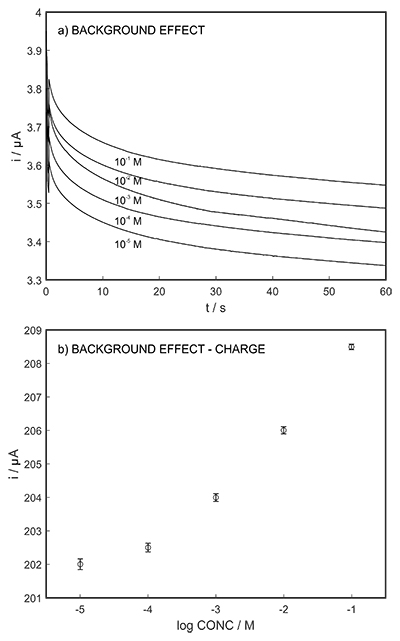 Figure S-8 (a) The influence of the background concentration on the released charge by applying potential pulse of 600 mV vs. OCP for 60 s. (b) Integrated charge for various sodium chloride concentrations within the range of 10-5 to 10-1 M as a background electrolyte. | 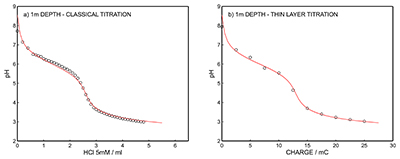 Figure S-9 (a) Classical acid-base titration for Lake Greifen sampled at 1 m depth. (b) Thin layer chemical titration for Lake Greifen sampled at 1 m depth. The alkalinity level at this depth is obtained as 2.59 mM. The red line is a theoretical fit. | 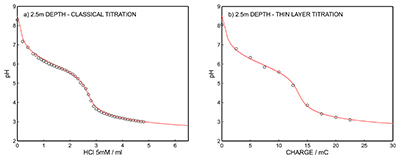 Figure S-10 (a) Classical acid-base titration for Lake Greifen sampled at 2.5 m depth. (b) Thin layer chemical titration for Lake Greifen sampled at 2.5 m depth. The alkalinity level at this depth is obtained as 2.64 mM. The red line is a theoretical fit. | 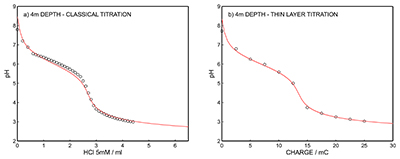 Figure S-11 (a) Classical acid-base titration for Lake Greifen sampled at 4 m depth. (b) Thin layer chemical titration for Lake Greifen sample at 4 m depth. The alkalinity level at this depth is obtained as 2.69 mM. The red line is a theoretical fit. |
| Figure S-7 | Figure S-8 | Figure S-9 | Figure S-10 | Figure S-11 |
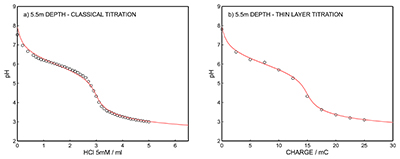 Figure S-12 (a) Classical acid-base titration for Lake Greifen sampled at 5.5 m depth. (b) Thin layer chemical titration for Lake Greifen sampled at 5.5 m depth. The alkalinity level at this depth is obtained as 3.04 mM. The red line is a theoretical fit. | 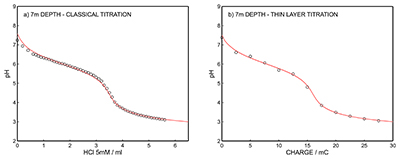 Figure S-13 (a) Classical acid-base titration for Lake Greifen sampled at 7 m depth. (b) Thin layer chemical titration for Lake Greifen sampled at 7 m depth. The alkalinity level at this depth is obtained as 3.30 mM. The red line is a theoretical fit. | 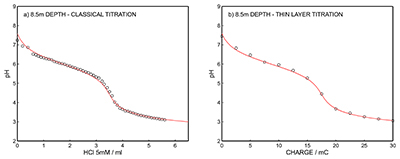 Figure S-14 (a) Classical acid-base titration for Lake Greifen sampled at 8.5 m depth. (b) Thin layer chemical titration for Lake Greifen sampled at 8.5 m depth. The alkalinity level at this depth is obtained as 3.60 mM. The red line is a theoretical fit. | 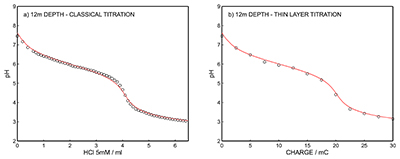 Figure S-15 (a) Classical acid-base titration for Lake Greifen sampled at 12 m depth. (b) Thin layer chemical titration for Lake Greifen sampled at 12 m depth. The alkalinity level at this depth is obtained as 4.11 mM. The red line is a theoretical fit. |
| Figure S-12 | Figure S-13 | Figure S-14 | Figure S-15 |
top
Introduction
Calcium carbonate precipitation in hard water lakes is triggered by blooms of algae and cyanobacteria (Dittrich et al., 2004
Dittrich, M., Kurz, P., Wehrli, B. (2004) The role of autotrophic picocyanobacteria in calcite precipitation in an oligotrophic lake. Geomicrobiology Journal 21, 45-53.
). The heterotrophic conditions in the deep water (Gruber et al., 2000Gruber, N., Wehrli, B., Wüest, A. (2000) The role of biogeochemical cycling for the formation and preservation of varved sediments in Soppensee (Switzerland). Journal of Paleolimnology 24, 277-291.
), and at the sediment-water interface, lead to the accumulation of dissolved CO2 and a decrease in pH accompanied by partial carbonate dissolution (Ramisch et al., 1999Ramisch, F., Dittrich, M., Mattenberger, C., Wehrli, B., Wüest, A. (1999) Calcite dissolution in two deep eutrophic lakes. Geochimica et Cosmochimica Acta 63, 3349-3356.
; Müller et al., 2003Müller, B., Wang, Y., Dittrich, M., Wehrli, B. (2003) Influence of organic carbon decomposition on calcite dissolution in surficial sediments of a freshwater lake. Water Research 37, 4524-4532.
). As a consequence, the concentration gradients of Ca2+ and HCO3- with depth are often increasing and thereby strengthen the stratification of the water column in summer (Gruber et al., 2000Gruber, N., Wehrli, B., Wüest, A. (2000) The role of biogeochemical cycling for the formation and preservation of varved sediments in Soppensee (Switzerland). Journal of Paleolimnology 24, 277-291.
). In anoxic systems, sulphate reduction in the sediments and the release of reduced substances like NH4+ further contribute to an increase of alkalinity with depth (Pasche et al., 2009Pasche, N., Dinkel, C., Schmid, M., Wehrli, B. (2009) Physical and biogeochemical limits to internal nutrient loading of meromictic Lake Kivu. Limnology and Oceanography 54, 1863-1873.
). Precise profiling of alkalinity (Stumm and Morgan, 1996Stumm, W., Morgan, J. (1996) Aquatic chemistry, chemical equilibra and rates in natural waters. Environmental Science and Technology Series. Third Edition, John Wiley & Sons, Inc., New York.
) in stratified waters is therefore essential to quantify the dynamics of the carbon cycle, to constrain the pathways of organic carbon mineralisation, and to understand the burial of carbonates in the sedimentary record (Schrag et al., 2013Schrag, D.P., Higgins, J.A., Macdonald, F.A., Johnston, D.T. (2013) Authigenic carbonate and the history of the global carbon cycle. Science 339, 540-543.
). Typically, alkalinity profiles are obtained from sub-sampling Niskin bottles followed by titration in the laboratory. This approach is cumbersome and offers only limited resolution in space and time and requires additional precautions for anoxic deep-waters where alkalinity changes can occur due to rapid oxidation of reduced components.Today, techniques have become available to generate the titrant electrochemically and thus provide the possibility of titrations in volumes of a few microlitres without the need for traditional sample manipulation. Early examples include the electrogeneration of hydroxide at an antimony/antimony oxide electrode (Karlmark et al., 1982
Karlmark, B., Jaeger, P., Fein, H., Giebisch, G. (1982) Coulometric acid-base titration in nanoliter samples with glass and antimony electrodes. American Journal of Physiology-Renal Physiology 242, F95-F99.
), while recent efforts used the direct electrochemical transformation of water to produce strong acid or base (van der Schoot et al., 2005van der Schoot, B., van der Wal, P., de Rooij, N., West, S. (2005) Titration-on-a-chip, chemical sensor–actuator systems from idea to commercial product. Sensors and Actuators B: Chemical 105, 88-95.
). Once integrated into microfluidic devices, these reagent generation principles were combined with a pH probe to realise a so-called flash titrator. Side reactions involving other electroactive species may lower the coulometric conversion efficiency of direct water electrolysis, rendering its use in complex samples problematic.Autonomous in situ detection of alkalinity in seawater samples has been demonstrated by Spaulding’s group, based on bulk titration and indicator colour change (Spaulding et al., 2014
Spaulding, R.S., DeGrandpre, M.D., Beck, J.C., Hart, R.D., Peterson, B., De Carlo, E.H., Drupp, P.S., Hammar, T.R. (2014) Autonomous in situ measurements of seawater alkalinity. Environmental Science and Technology 48, 9573-9581.
). Classical acid-base titration was also applied for alkalinity detection by Li’s group, where the indicator colour change was monitored spectroscopically to predict the endpoint (Li et al., 2013Li, Q., Wang, F., Wang, Z.A., Yuan, D., Dai, M., Chen, J., Dai, J., Hoering, K.A. (2013) Automated spectrophotometric analyzer for rapid single-point titration of seawater total alkalinity. Environmental Science and Technology 47, 11139-11146.
). In these reports, traditional volumetry was applied that requires reagents (indicator, acid and base) and complex instrumentation such as pumps, injection valves, and optical detectors.An alternative approach less prone to interferences involves the electrochemically driven transport of ions across ion-selective membranes (Nagy et al., 1977
Nagy, G., Fehér, Z., Tóth, K., Pungor, E. (1977) A novel titration technique for the analysis of streamed samples—the triangle-programmed titration technique: Part II. Argentimetric titrations. Analytica Chimica Acta 91, 97-106.
; Bhakthavatsalam et al., 2006Bhakthavatsalam, V., Shvarev, A., Bakker, E. (2006) Selective coulometric release of ions from ion selective polymeric membranes for calibration-free titrations. Analyst 131, 895-900.; Ghahraman Afshar et al., 2015
Afshar, M.G., Crespo, G.A., Bakker, E. (2015) Thin‐Layer Chemical Modulations by a Combined Selective Proton Pump and pH Probe for Direct Alkalinity Detection. Angewandte Chemie 127, 8228-8231.
; Ghahraman Afshar et al., 2014Ghahraman Afshar, M.G., Crespo, G.A., Xie, X., Bakker, E. (2014) Direct alkalinity detection with ion-selective chronopotentiometry. Analytical Chemistry 86, 6461-6470.
,2015aGhahraman Afshar, M.G., Crespo, G.A., Bakker, E. (2015a) Thin‐Layer Chemical Modulations by a Combined Selective Proton Pump and pH Probe for Direct Alkalinity Detection. Angewandte Chemie 127, 8228-8231.
bGhahraman Afshar, M., Crespo, G.A., Bakker, E. (2015b) Coulometric Calcium Pump for Thin Layer Sample Titrations. Analytical Chemistry 87, 10125-10130.
). They can be used for the direct detection of total alkalinity by applying a constant current across the membrane and measuring the time required for localised depletion of base to occur. This chronopotentiometric technique is limited by an influence of the diffusion coefficient of the base of interest on the signal (as does the flash titrator mentioned above) and so far exhibits a limited measuring range not suitable for environmental analysis (Crespo et al., 2012Crespo, G.A., Ghahraman Afshar, M., Bakker, E. (2012) Direct detection of acidity, alkalinity, and pH with membrane electrodes. Analytical Chemistry 84, 10165-10169.
; Ghahraman Afshar et al., 2014Ghahraman Afshar, M., Crespo, G.A., Xie, X., Bakker, E. (2014) Direct alkalinity detection with ion-selective chronopotentiometry. Analytical Chemistry 86, 6461-6470.
).Recently, our group used a selective proton pump membrane to inject hydrogen ions into a thin layer sample while measuring the resulting pH with a pH probe placed directly opposite to the proton pump (Ghahraman Afshar et al., 2015a
Ghahraman Afshar, M., Crespo, G.A., Bakker, E. (2015a) Thin‐Layer Chemical Modulations by a Combined Selective Proton Pump and pH Probe for Direct Alkalinity Detection. Angewandte Chemie 127, 8228-8231.
), thereby realising a direct alkalinity sensor. The thin sample layer (ca. 100 µm) ensures that the injected hydrogen ions are equilibrated after a short time (~2 min), thereby giving a sensor response directly analogous to a volumetric titration. This methodology was assessed here for the direct on site measurement of an alkalinity depth profile in Lake Greifen (Switzerland).top
Experimental Section
Reagents, materials and equipment. Potassium tetrakis[3,5-bis(trifluoromethyl)phenyl]borate (KTFPB), tetrakis(4-chlorophenyl)borate tetradodecylammonium salt (ETH 500), chromoionophore I, 2-nitrophenyloctylether (o-NPOE), tris(hydroxymethyl)aminomethane (Tris), acetic acid, sodium acetate, sodium chloride, sodium hydroxide (1 M), hydrochloridric acid (1 M), high molecular weight poly(vinyl chloride) (PVC) and tetrahydrofuran (THF) were purchased from Sigma-Aldrich (analytical grade). Porous polypropylene (PP) membranes (Celgard, 0.237 cm2 surface area, 25 µm thickness) were kindly provided by Membrana in Wuppertal, Germany.
Electrochemical equipment. A double-junction Ag/AgCl/3 M KCl/1 M LiOAc reference electrode was used in potentiometric and voltammetric measurements (6.0726.100 model, Metrohm, Switzerland). Electrode bodies (Oesch Sensor Technology, Sargans, Switzerland) were used to mount both the Celgard and PVC polymeric membranes. A platinum-working rod (3.2 cm2 surface area) was used as a counter electrode. Potentiometric measurements were performed using a high impedance input 16-channel EMF monitor (Lawson Laboratories, Inc., Malvern, PA). Voltammetric measurements were carried out with an Autolab PGSTAT101. Portable pH meter model 826 pH was applied for pH detection (Metrohm AG, Switzerland). A commercial submersible multiparameter CTD probe OCEAN SEVEN 305Plus (Idronaut, Brugherio, Italy) equipped with pH electrode (a combination of pH and reference electrodes in contact with electrolyte solution behind a gas permeable membrane) and appropriate software provided by the manufacturer (ITERM, REDAS) was used for in situ pH profiling. All the calibration solutions were prepared in 10 mM of NaCl as background electrolyte.
Membrane preparation. Proton pump membranes were fashioned from porous polypropylene (PP) membranes (Celgard, 0.237 cm2 surface area, 25 µm thickness) as supporting material. The membranes were washed with THF for 2-3 min to remove contaminants. An excess volume of 4 µL of the THF-free cocktail solution was deposited on the membrane when it was found to be completely dry (see cocktail preparation below). The impregnation of the cocktail was found to be instantaneous. The pore filling solution composition was assumed to remain identical to the initial THF-free cocktail. The membrane was conditioned in 0.01 M HCl for 40 min and mounted in the electrode body. The inner compartment was filled with 0.01 M HCl. The chemical composition of the proton pump membrane was 120 mmol kg-1 of Chromoionophore I (mmol per kg of cocktail), 60 mmol kg-1 of KTFPB, 90 mmol kg-1 of ETH 500, 150 mg of o-NPOE, total mass of 200 mg and 1 mL of THF. The THF was only used to solubilise the solid compounds into the plasticiser and was removed by evaporation before membrane casting membranes. The potentiometric pH probe membrane was based on a solvent cast PVC membrane, composed of 15 mmol kg-1 of Chromoionophore I, 5 mmol kg-1 of KTFPB, 135 mg of o-NPOE and 62 mg PVC, total mass of 200 mg, which was dissolved in 2 mL of THF and poured into a glass ring (10 mm ID) affixed onto a glass slide. The solution was allowed to evaporate overnight, giving membranes of ca. 0.15 mm thickness. This parent membrane was cut with a hole-puncher into disks of 8 mm diameter and mounted into Ostec electrode bodies. The inner compartment consisted of 0.01 M HCl.
Electrochemical cell setup. The cell consisted of a five electrode system in an acrylic container: a proton pump, a pH indicator electrode, a counter and two reference electrodes (Fig. 1b). A two-electrode arrangement (see Fig. S-1) with the reference and counter electrodes immersed in the outer contacting solution was used. The distance between indicator electrode and proton pump was defined by a 100 µm thick piece of paper tightly placed between them that was removed before filling the vessel with sample.
Electrochemical protocol. Coulometric pulses were applied at the proton pump while the potentiometric readout was recorded at the pH sensor. An automated method (NOVA, Autolab) consisted of i) open circuit potential determinations for 5 s at a sampling rate of 10 Hz (no current flow), ii) anodic potential pulses of varying duration (from 30 s to 210 s) at 500 Hz. Immediately afterwards, the pH was recorded potentiometrically at the pH probe.
The proton pump is an ion-selective electrode based on a hydrogen ion-selective membrane made from doped porous polypropylene instead of PVC owing to its faster mass transport properties (Malon et al., 2007
Malon, A., Bakker, E., Pretsch, E. (2007) Backside calibration potentiometry: Ion activity measurements with selective supported liquid membranes by calibrating from the inner side of the membrane. Analytical Chemistry 79, 632-638.
). An inner solution of 0.01 M HCl was used as a high concentration of acid is required to release hydrogen ions. The released proton concentration in the thin layer sample was calculated from the total released charge (current integration) and the thin layer volume. A volume of 40 µL is typically predicted for the thin layer sample, the value of which is determined by calibration using Faraday's law.Sample collection and in situ pH measurement. The samples from different depths were collected using a Niskin Water Sampler (Model 1010: General Oceanic, Miami, USA) and stored in polyethylene containers, used here because transition metals were assessed in the same field study. The containers were completely filled to minimise loss of CO2 and the containers were kept closed until measurement. All measurements were performed within a few hours after sampling. One lake-water profile consisted of seven depths: 1, 2.5, 4, 5.5, 7, 8.5 and 12.5 m. pH was detected in situ using an OCEAN SEVEN 305Plus multiparameter CTD probe. The calibration of the pH sensor was performed as requested by the manufacturer using one-point calibration (pH 7, non-stirring conditions).
Theoretical fit. Equilibrium theory was used to fit the titration curve of the lake water samples by considering carbonate and bicarbonate as major alkaline species using pKa1 of 6.30 for bicarbonate, pKa2 of 10.32 for carbonate and the initial pH value obtained by the in situ sensor.
top
Results and Discussion
Alkalinity depth profiles were investigated by the thin layer coulometric approach described recently (Ghahraman Afshar et al., 2015a
Ghahraman Afshar, M., Crespo, G.A., Bakker, E. (2015a) Thin‐Layer Chemical Modulations by a Combined Selective Proton Pump and pH Probe for Direct Alkalinity Detection. Angewandte Chemie 127, 8228-8231.
), marking the first time that this technique is applied for an environmental application. The electrochemical cell consisted of a membrane-based proton pump and pH probe (see Fig. S-2 for potentiometric response of the latter) separated by a thin layer sample (see Fig. 1 for scheme). The lower detection limit (DL) of the methodology is about 0.1 mM, obtained by monitoring the minimum detectable pH change in the absence of buffer. The upper DL is found to be at least 100 mM, predicted by the titration of the highest possible concentration of strong base (sodium hydroxide) solution. This makes the methodology applicable to environmental systems including highly buffered carbonate lakes (Müller et al., 2016Müller, B., Meyer, J.S., Gächter, R. (2016) Alkalinity regulation in calcium carbonate‐buffered lakes. Limnology and Oceanography 61, 341-352.
). The thin sample layer remained in physical contact with the bulk lake sample at all times (100 mL) and was therefore allowed to re-equilibrate after each perturbation step by convective stirring of the bulk sample. Alkalinity in the unfiltered lake water samples from depths of 1 to 12.5 m were determined from the inflection point of the titration curves using the thin layer electrochemical instrument (Figs. 2a, S-9b to S-15b). pH was monitored at the pH indicator electrode as a function of charge, and hence of the released proton concentration, at the proton pump for 11 consecutive excitation pulses of 300 mV (vs. OCP) of 10 to 110 s duration with 10 s increment (see Fig. S-3).
Figure 1 (a) Schematic illustration of the alkalinity probe. (b) Electrochemical cell composed of a proton pump and a pH probe placed directly opposite. The two reference electrodes (RE1 and RE2) and counter electrode (CE) are inserted in the bulk sample solution. The carbonate species are titrated with the hydrogen ions released from the proton pump. The resulting change of pH is subsequently assessed potentiometrically at the pH probe.
The potentiometric response of the pH electrode after each imposed pulse allowed the determination of the time required to reach equilibration of pH between the two opposite electrodes and re-equilibration of the thin layer with the natural sample. These values are similar to those determined previously from thin-layer electrochemical titrations in synthetic solutions (Ghahraman Afshar et al., 2015a
Ghahraman Afshar, M., Crespo, G.A., Bakker, E. (2015a) Thin‐Layer Chemical Modulations by a Combined Selective Proton Pump and pH Probe for Direct Alkalinity Detection. Angewandte Chemie 127, 8228-8231.
), suggesting the absence of matrix effects and/or fouling problems. This hypothesis was supported by the comparative alkalinity levels for the same samples obtained from traditional volumetry (reference method ISO 9963:1994, volumetric acid-base titration), which is in quantitative agreement with the values obtained with the alkalinity sensor. Figure 2b shows the correlation between the proposed and reference methods: solid line indicates ideality with unity slope and zero intercept. The two methods are in excellent agreement as the least squares fit gives a slope of almost unity and an intercept close to zero (y = 1.018x - 0.062, r2 = 0.997), giving an average relative error of 1 % (see Fig. S-4).
Figure 2 (a) The titration curve for various depths in the range of 1 to 12.5 m using the thin layer instrument. Solid line is theoretical. (b) Correlation between the thin layer chemical modulation method and volumetric acid-base titration reference method (ISO 9963-1:1994). Solid line shows ideality with unity slope and zero intercept.
The long-term stability of the pH sensor and proton pump were investigated, and a drift of 0.5 mV/h was obtained (Fig. S-5). The reproducibility of the proton pump was examined by applying repeated potential pulses of 300 mV for 30 s, finding an RSD of less than 1 % (n = 5), indicating a reproducible release system (Fig. S-6). The influence of temperature on the released charge was examined within the range of 20 to 30 oC. According to Figure S-7, the variation was negligible (RSD ≤ 2 %). Various sodium chloride concentrations between 10-5 to 0.1 M were examined as background (Fig. S-8), and the released charge was found to increase with higher background concentration. However, this should not affect the precision and accuracy of the technique as it is performed by stopping the potential pulse after reaching a predetermined charge value.
Figure 3b shows the alkalinity depth profiles together with the corresponding pH values (Fig. 3a) obtained in situ from the multiparameter CTD probe at the same depth. An alkalinity level in the range of 4 mM was observed below the bioactive surface layer, in agreement with earlier work (Müller et al., 2016
Müller, B., Meyer, J.S., Gächter, R. (2016) Alkalinity regulation in calcium carbonate‐buffered lakes. Limnology and Oceanography 61, 341-352.
). As observed in Figure 3b, alkalinity increases with depth while Figure 3a shows that this is accompanied by decreasing pH.
Figure 3 (a) Total alkalinity depth profile and (b) pH depth profile obtaining during field monitoring on the Lake Greifen (31 August 2015).
In surface waters and during the day, algae and other photosynthetic microorganisms consume CO2 by photosynthesis, which results in an increase of pH. In hard water systems, this promotes the precipitation of CaCO3 onto microorganisms and other microenvironments, which is eventually transported to greater depths by sedimentation, thereby reducing alkalinity at the surface (Gruber et al., 2000
Gruber, N., Wehrli, B., Wüest, A. (2000) The role of biogeochemical cycling for the formation and preservation of varved sediments in Soppensee (Switzerland). Journal of Paleolimnology 24, 277-291.
). On the other hand, the sediments of hard water lakes act as a source of alkalinity due to anaerobic mineralisation processes and partial calcite dissolution (Dittrich et al., 2009Dittrich, M., Wehrli, B., Reichert, P. (2009) Lake sediments during the transient eutrophication period: Reactive-transport model and identifiability study. Ecological Modelling 220, 2751-2769.
).We demonstrated that a thin layer proton pump may work efficiently as an alkalinity sensing tool for profiling lake water. As a case study, the alkalinity level of Lake Greifen at various depths was successfully determined. These results were obtained after sampling lake water and performing the analysis at an on-shore location, thus significantly reducing the time from sampling to analysis, which is a critical factor for anoxic waters. It is conceivable that the methodology may be applied as a single-point titration system by means of a theoretical fit from the initial pH value, acidity constant and a single titration point, thereby drastically increasing measurement frequency. Future development will focus on the realisation of an alkalinity sensor that is deployable in situ, in analogy to a CTD probe.
top
Acknowledgements
The authors thank the Swiss National Science Foundation and the European Union (FP7-GA 614002-SCHeMA project) for supporting this research.
Editor: Eric H. Oelkers
top
References
Bhakthavatsalam, V., Shvarev, A., Bakker, E. (2006) Selective coulometric release of ions from ion selective polymeric membranes for calibration-free titrations. Analyst 131, 895-900.
 Show in context
 An alternative approach less prone to interferences involves the electrochemically driven transport of ions across ion-selective membranes (Nagy et al., 1977; Bhakthavatsalam et al., 2006; Ghahraman Afshar et al., 2014,2015ab).
View in article
Crespo, G.A., Ghahraman Afshar, M., Bakker, E. (2012) Direct detection of acidity, alkalinity, and pH with membrane electrodes. Analytical Chemistry 84, 10165-10169.
 Show in context
 This chronopotentiometric technique is limited by an influence of the diffusion coefficient of the base of interest on the signal (as does the flash titrator mentioned above) and so far exhibits a limited measuring range not suitable for environmental analysis (Crespo et al., 2012; Ghahraman Afshar et al., 2014).
View in article
Dittrich, M., Kurz, P., Wehrli, B. (2004) The role of autotrophic picocyanobacteria in calcite precipitation in an oligotrophic lake. Geomicrobiology Journal 21, 45-53.
 Show in context
 Calcium carbonate precipitation in hard water lakes is triggered by blooms of algae and cyanobacteria (Dittrich et al., 2004).
View in article
Dittrich, M., Wehrli, B., Reichert, P. (2009) Lake sediments during the transient eutrophication period: Reactive-transport model and identifiability study. Ecological Modelling 220, 2751-2769.
 Show in context
 On the other hand, the sediments of hard water lakes act as a source of alkalinity due to anaerobic mineralisation processes and partial calcite dissolution (Dittrich et al., 2009).
View in article
Ghahraman Afshar, M.G., Crespo, G.A., Xie, X., Bakker, E. (2014) Direct alkalinity detection with ion-selective chronopotentiometry. Analytical Chemistry 86, 6461-6470.
 Show in context
 An alternative approach less prone to interferences involves the electrochemically driven transport of ions across ion-selective membranes (Nagy et al., 1977; Bhakthavatsalam et al., 2006; Ghahraman Afshar et al., 2014,2015ab).
View in article
This chronopotentiometric technique is limited by an influence of the diffusion coefficient of the base of interest on the signal (as does the flash titrator mentioned above) and so far exhibits a limited measuring range not suitable for environmental analysis (Crespo et al., 2012; Ghahraman Afshar et al., 2014).
View in article
Ghahraman Afshar, M.G., Crespo, G.A., Bakker, E. (2015a) Thin‐Layer Chemical Modulations by a Combined Selective Proton Pump and pH Probe for Direct Alkalinity Detection. Angewandte Chemie 127, 8228-8231.
 Show in context
An alternative approach less prone to interferences involves the electrochemically driven transport of ions across ion-selective membranes (Nagy et al., 1977; Bhakthavatsalam et al., 2006; Ghahraman Afshar et al., 2014,2015ab).
View in article
Recently, our group used a selective proton pump membrane to inject hydrogen ions into a thin layer sample while measuring the resulting pH with a pH probe placed directly opposite to the proton pump (Ghahraman Afshar et al., 2015a), thereby realising a direct alkalinity sensor.
View in article
Alkalinity depth profiles were investigated by the thin layer coulometric approach described recently (Ghahraman Afshar et al., 2015a), marking the first time that this technique is applied for an environmental application.
View in article
These values are similar to those determined previously from thin-layer electrochemical titrations in synthetic solutions (Ghahraman Afshar et al., 2015a), suggesting the absence of matrix effects and/or fouling problems.
View in article
Ghahraman Afshar, M., Crespo, G.A., Bakker, E. (2015b) Coulometric Calcium Pump for Thin Layer Sample Titrations. Analytical Chemistry 87, 10125-10130.
 Show in context
 An alternative approach less prone to interferences involves the electrochemically driven transport of ions across ion-selective membranes (Nagy et al., 1977; Bhakthavatsalam et al., 2006; Ghahraman Afshar et al., 2014,2015ab).
View in article
Gruber, N., Wehrli, B., Wüest, A. (2000) The role of biogeochemical cycling for the formation and preservation of varved sediments in Soppensee (Switzerland). Journal of Paleolimnology 24, 277-291.
 Show in context
 The heterotrophic conditions in the deep water (Gruber et al., 2000), and at the sediment-water interface, lead to the accumulation of dissolved CO2 and a decrease in pH accompanied by partial carbonate dissolution (Ramisch et al., 1999; Müller et al., 2003).
View in article
As a consequence, the concentration gradients of Ca2+ and HCO3- with depth are often increasing and thereby strengthen the stratification of the water column in summer (Gruber et al., 2000).
View in article
In hard water systems, this promotes the precipitation of CaCO3 onto microorganisms and other microenvironments, which is eventually transported to greater depths by sedimentation, thereby reducing alkalinity at the surface (Gruber et al., 2000).
View in article
Karlmark, B., Jaeger, P., Fein, H., Giebisch, G. (1982) Coulometric acid-base titration in nanoliter samples with glass and antimony electrodes. American Journal of Physiology-Renal Physiology 242, F95-F99.
 Show in context
 Early examples include the electrogeneration of hydroxide at an antimony/antimony oxide electrode (Karlmark et al., 1982), while recent efforts used the direct electrochemical transformation of water to produce strong acid or base (van der Schoot et al., 2005).
View in article
Li, Q., Wang, F., Wang, Z.A., Yuan, D., Dai, M., Chen, J., Dai, J., Hoering, K.A. (2013) Automated spectrophotometric analyzer for rapid single-point titration of seawater total alkalinity. Environmental Science and Technology 47, 11139-11146.
 Show in context
 Classical acid-base titration was also applied for alkalinity detection by Li’s group, where the indicator colour change was monitored spectroscopically to predict the endpoint (Li et al., 2013).
View in article
Malon, A., Bakker, E., Pretsch, E. (2007) Backside calibration potentiometry: Ion activity measurements with selective supported liquid membranes by calibrating from the inner side of the membrane. Analytical Chemistry 79, 632-638.
 Show in context
 The proton pump is an ion-selective electrode based on a hydrogen ion-selective membrane made from doped porous polypropylene instead of PVC owing to its faster mass transport properties (Malon et al., 2007).
View in article
Müller, B., Wang, Y., Dittrich, M., Wehrli, B. (2003) Influence of organic carbon decomposition on calcite dissolution in surficial sediments of a freshwater lake. Water Research 37, 4524-4532.
 Show in context
 The heterotrophic conditions in the deep water (Gruber et al., 2000), and at the sediment-water interface, lead to the accumulation of dissolved CO2 and a decrease in pH accompanied by partial carbonate dissolution (Ramisch et al., 1999; Müller et al., 2003).
View in article
Müller, B., Meyer, J.S., Gächter, R. (2016) Alkalinity regulation in calcium carbonate‐buffered lakes. Limnology and Oceanography 61, 341-352.
 Show in context
 This makes the methodology applicable to environmental systems including highly buffered carbonate lakes (Müller et al., 2016).
View in article
An alkalinity level in the range of 4 mM was observed below the bioactive surface layer, in agreement with earlier work (Müller et al., 2016).
View in article
Nagy, G., Fehér, Z., Tóth, K., Pungor, E. (1977) A novel titration technique for the analysis of streamed samples—the triangle-programmed titration technique: Part II. Argentimetric titrations. Analytica Chimica Acta 91, 97-106.
 Show in context
 An alternative approach less prone to interferences involves the electrochemically driven transport of ions across ion-selective membranes (Nagy et al., 1977; Bhakthavatsalam et al., 2006; Ghahraman Afshar et al., 2014,2015ab).
View in article
Pasche, N., Dinkel, C., Schmid, M., Wehrli, B. (2009) Physical and biogeochemical limits to internal nutrient loading of meromictic Lake Kivu. Limnology and Oceanography 54, 1863-1873.
 Show in context
 In anoxic systems, sulphate reduction in the sediments and the release of reduced substances like NH4+ further contribute to an increase of alkalinity with depth (Pasche et al., 2009).
View in article
Ramisch, F., Dittrich, M., Mattenberger, C., Wehrli, B., Wüest, A. (1999) Calcite dissolution in two deep eutrophic lakes. Geochimica et Cosmochimica Acta 63, 3349-3356.
 Show in context
 The heterotrophic conditions in the deep water (Gruber et al., 2000), and at the sediment-water interface, lead to the accumulation of dissolved CO2 and a decrease in pH accompanied by partial carbonate dissolution (Ramisch et al., 1999; Müller et al., 2003).
View in article
Schrag, D.P., Higgins, J.A., Macdonald, F.A., Johnston, D.T. (2013) Authigenic carbonate and the history of the global carbon cycle. Science 339, 540-543.
 Show in context
 Precise profiling of alkalinity (Stumm and Morgan, 1996) in stratified waters is therefore essential to quantify the dynamics of the carbon cycle, to constrain the pathways of organic carbon mineralisation, and to understand the burial of carbonates in the sedimentary record (Schrag et al., 2013).
View in article
Spaulding, R.S., DeGrandpre, M.D., Beck, J.C., Hart, R.D., Peterson, B., De Carlo, E.H., Drupp, P.S., Hammar, T.R. (2014) Autonomous in situ measurements of seawater alkalinity. Environmental Science and Technology 48, 9573-9581.
 Show in context
 Autonomous in situ detection of alkalinity in seawater samples has been demonstrated by Spaulding’s group, based on bulk titration and indicator colour change (Spaulding et al., 2014).
View in article
Stumm, W., Morgan, J. (1996) Aquatic chemistry, chemical equilibra and rates in natural waters. Environmental Science and Technology Series. Third Edition, John Wiley & Sons, Inc., New York.
 Show in context
 Precise profiling of alkalinity (Stumm and Morgan, 1996) in stratified waters is therefore essential to quantify the dynamics of the carbon cycle, to constrain the pathways of organic carbon mineralisation, and to understand the burial of carbonates in the sedimentary record (Schrag et al., 2013).
View in article
van der Schoot, B., van der Wal, P., de Rooij, N., West, S. (2005) Titration-on-a-chip, chemical sensor–actuator systems from idea to commercial product. Sensors and Actuators B: Chemical 105, 88-95.
 Show in context
 Early examples include the electrogeneration of hydroxide at an antimony/antimony oxide electrode (Karlmark et al., 1982), while recent efforts used the direct electrochemical transformation of water to produce strong acid or base (van der Schoot et al., 2005).
View in article
top
Supplementary Information

Figure S-1 Schematic illustration of the electrochemical cell. The proton pump was placed directly opposite the pH sensor while the thin layer sample gap was between the pH sensor and the proton pump. The counter electrode and reference electrode for the proton pump (not shown) were placed in the sample solution. The reference electrode for the pH sensor was also in the sample solution in the beaker.

Figure S-2 (a) Potentiometric time trace for the pH sensor in the pH range of 3 to 12. (b) Corresponding pH calibration curve. The observed electrode slope was 57.3 mV.

Figure S-3 (a) Potentiometric time trace at the pH probe for the titration of the Lake Greifen sample obtained at 12 m depth. (b) The obtained EMF value after applying each pulse as a function of the pulse number. (c) The calculated pH value at the pH sensor for each pulse.

Figure S-4 (a) Absolute error for the alkalinity detection in mM. (b) Percentage relative error for the alkalinity determination. The average relative error of 0.95 % (less than 1 %) was obtained for the alkalinity detection by the methodology.

Figure S-5 Long-term stability for both pH sensor and proton pump.

Figure S-6 (a) Reproducibility of the potential pulse by applying potential pulse of 300 mV vs. OCP for 30 s within one day. (b) Integrated charge of the potential pulse for every 4 hours.

Figure S-7 (a) Influence of temperature on the released charge by applying potential pulse of 600 mV vs. OCP over 60 s. (b) The obtained charge value for various temperature within the range of 20 to 30 oC.

Figure S-8 (a) The influence of the background concentration on the released charge by applying potential pulse of 600 mV vs. OCP for 60 s. (b) Integrated charge for various sodium chloride concentrations within the range of 10-5 to 10-1 M as a background electrolyte.

Figure S-9 (a) Classical acid-base titration for Lake Greifen sampled at 1 m depth. (b) Thin layer chemical titration for Lake Greifen sampled at 1 m depth. The alkalinity level at this depth is obtained as 2.59 mM. The red line is a theoretical fit.

Figure S-10 (a) Classical acid-base titration for Lake Greifen sampled at 2.5 m depth. (b) Thin layer chemical titration for Lake Greifen sampled at 2.5 m depth. The alkalinity level at this depth is obtained as 2.64 mM. The red line is a theoretical fit.

Figure S-11 (a) Classical acid-base titration for Lake Greifen sampled at 4 m depth. (b) Thin layer chemical titration for Lake Greifen sample at 4 m depth. The alkalinity level at this depth is obtained as 2.69 mM. The red line is a theoretical fit.

Figure S-12 (a) Classical acid-base titration for Lake Greifen sampled at 5.5 m depth. (b) Thin layer chemical titration for Lake Greifen sampled at 5.5 m depth. The alkalinity level at this depth is obtained as 3.04 mM. The red line is a theoretical fit.

Figure S-13 (a) Classical acid-base titration for Lake Greifen sampled at 7 m depth. (b) Thin layer chemical titration for Lake Greifen sampled at 7 m depth. The alkalinity level at this depth is obtained as 3.30 mM. The red line is a theoretical fit.

Figure S-14 (a) Classical acid-base titration for Lake Greifen sampled at 8.5 m depth. (b) Thin layer chemical titration for Lake Greifen sampled at 8.5 m depth. The alkalinity level at this depth is obtained as 3.60 mM. The red line is a theoretical fit.

Figure S-15 (a) Classical acid-base titration for Lake Greifen sampled at 12 m depth. (b) Thin layer chemical titration for Lake Greifen sampled at 12 m depth. The alkalinity level at this depth is obtained as 4.11 mM. The red line is a theoretical fit.
Figures and Tables
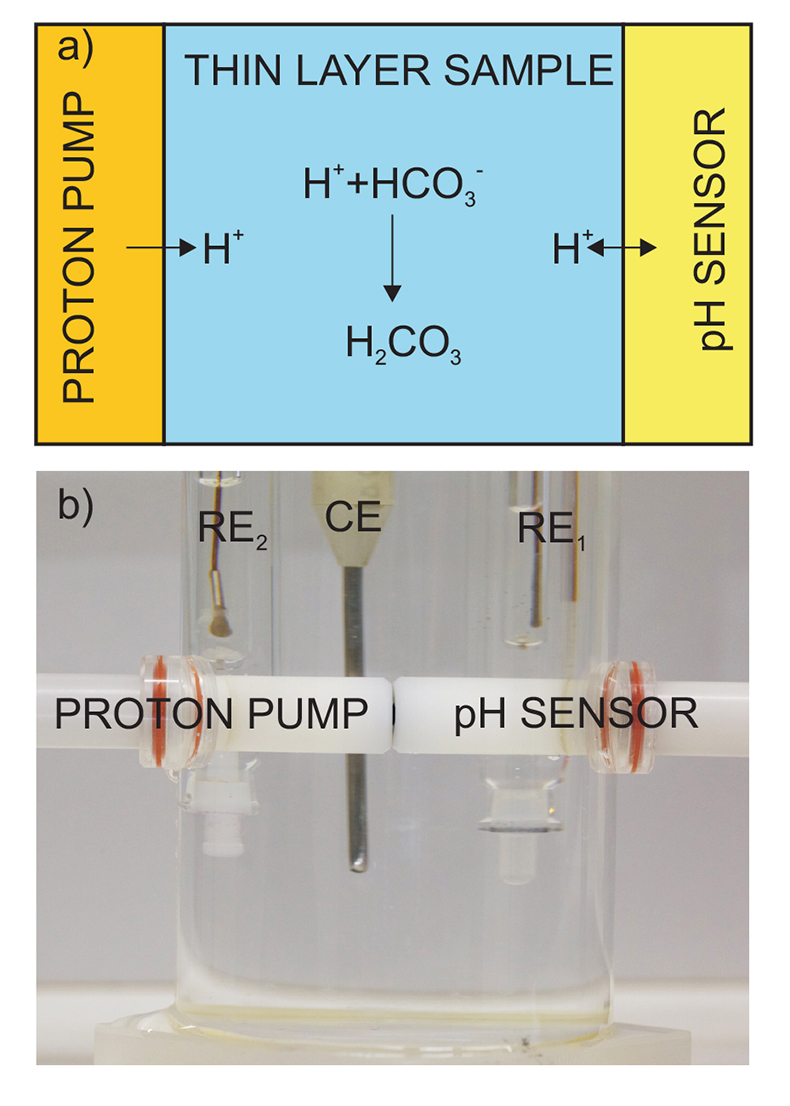
Figure 1 (a) Schematic illustration of the alkalinity probe. (b) Electrochemical cell composed of a proton pump and a pH probe placed directly opposite. The two reference electrodes (RE1 and RE2) and counter electrode (CE) are inserted in the bulk sample solution. The carbonate species are titrated with the hydrogen ions released from the proton pump. The resulting change of pH is subsequently assessed potentiometrically at the pH probe.
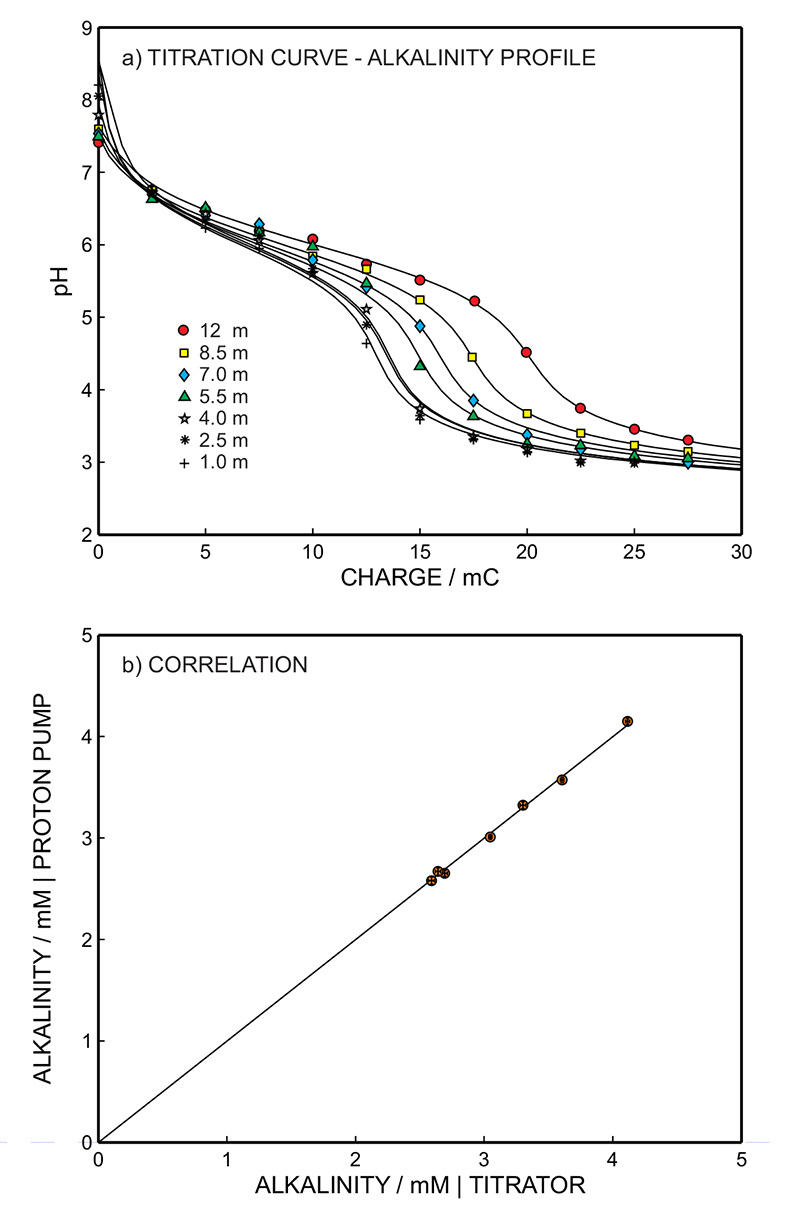
Figure 2 (a) The titration curve for various depths in the range of 1 to 12.5 m using the thin layer instrument. Solid line is theoretical. (b) Correlation between the thin layer chemical modulation method and volumetric acid-base titration reference method (ISO 9963-1:1994). Solid line shows ideality with unity slope and zero intercept.
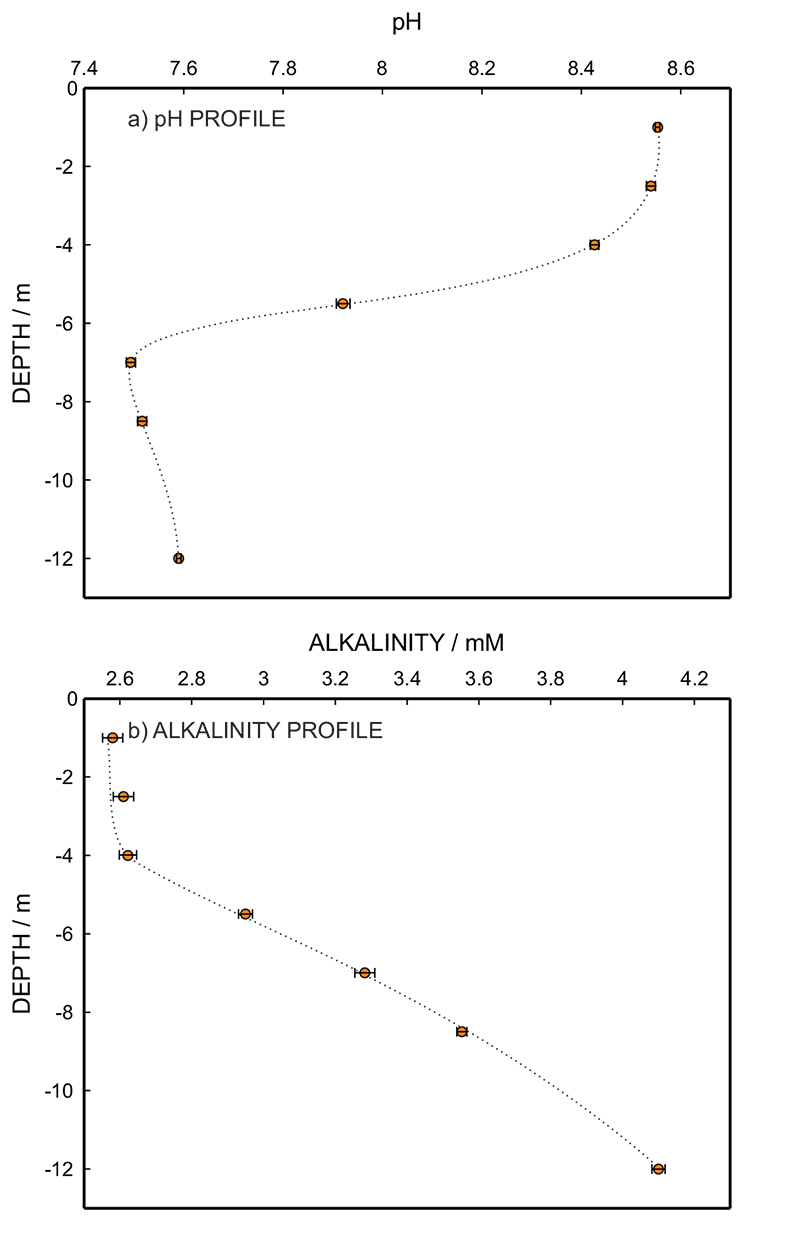
Figure 3 (a) Total alkalinity depth profile and (b) pH depth profile obtaining during field monitoring on the Lake Greifen (31 August 2015).
Back to article
Supplementary Figures and Tables
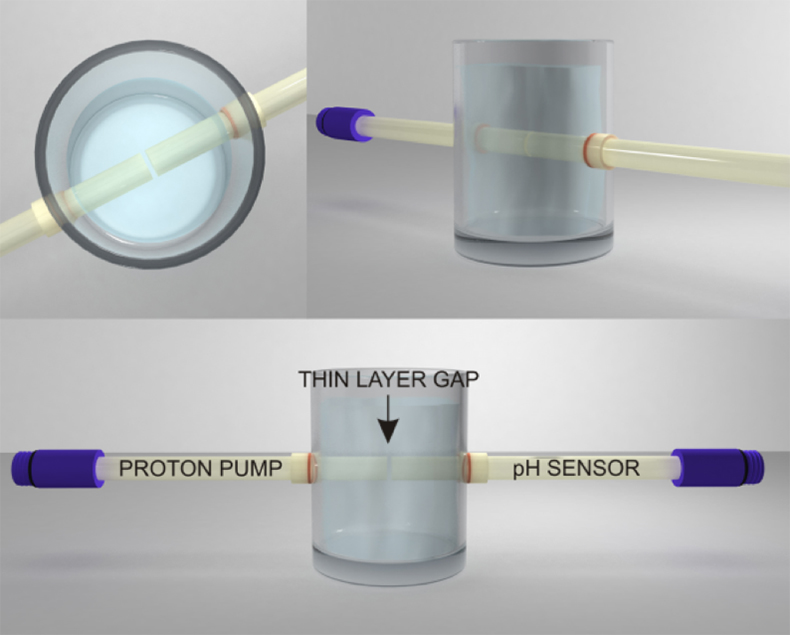
Figure S-1 Schematic illustration of the electrochemical cell. The proton pump was placed directly opposite the pH sensor while the thin layer sample gap was between the pH sensor and the proton pump. The counter electrode and reference electrode for the proton pump (not shown) were placed in the sample solution. The reference electrode for the pH sensor was also in the sample solution in the beaker.
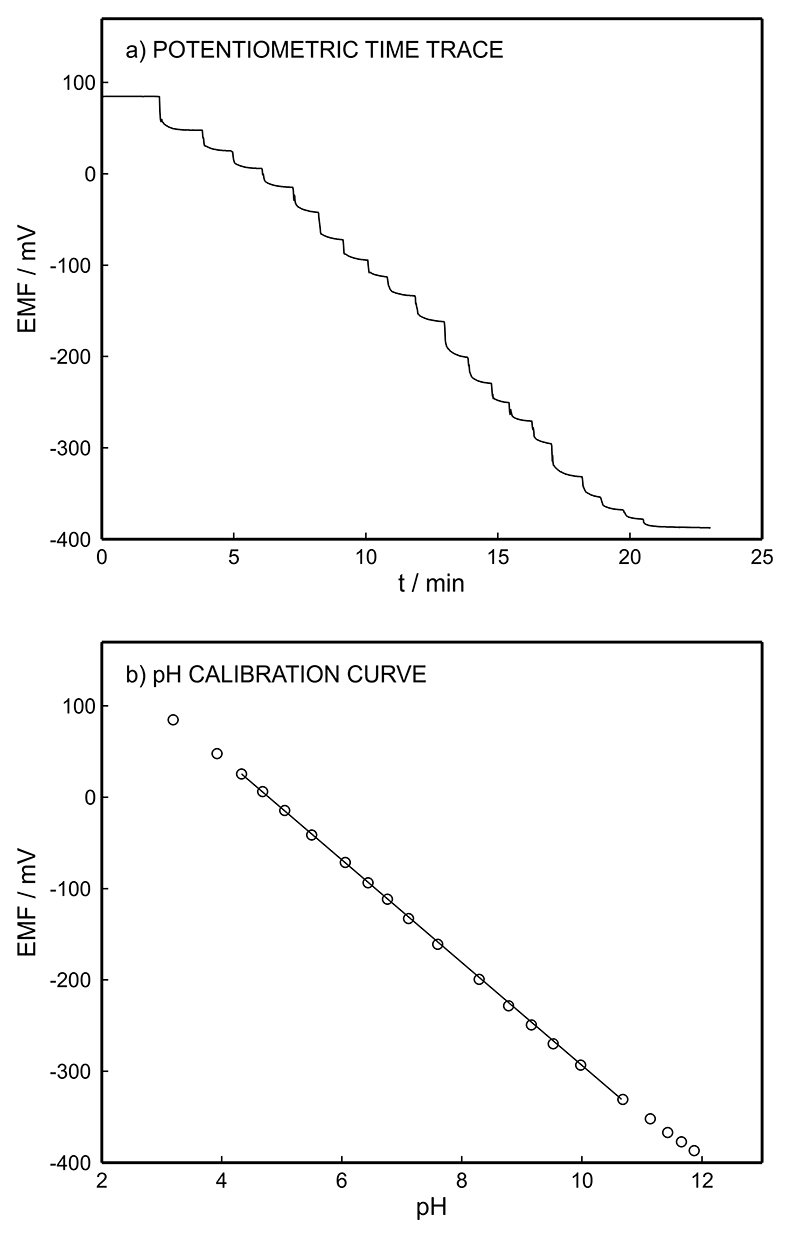
Figure S-2 (a) Potentiometric time trace for the pH sensor in the pH range of 3 to 12. (b) Corresponding pH calibration curve. The observed electrode slope was 57.3 mV.
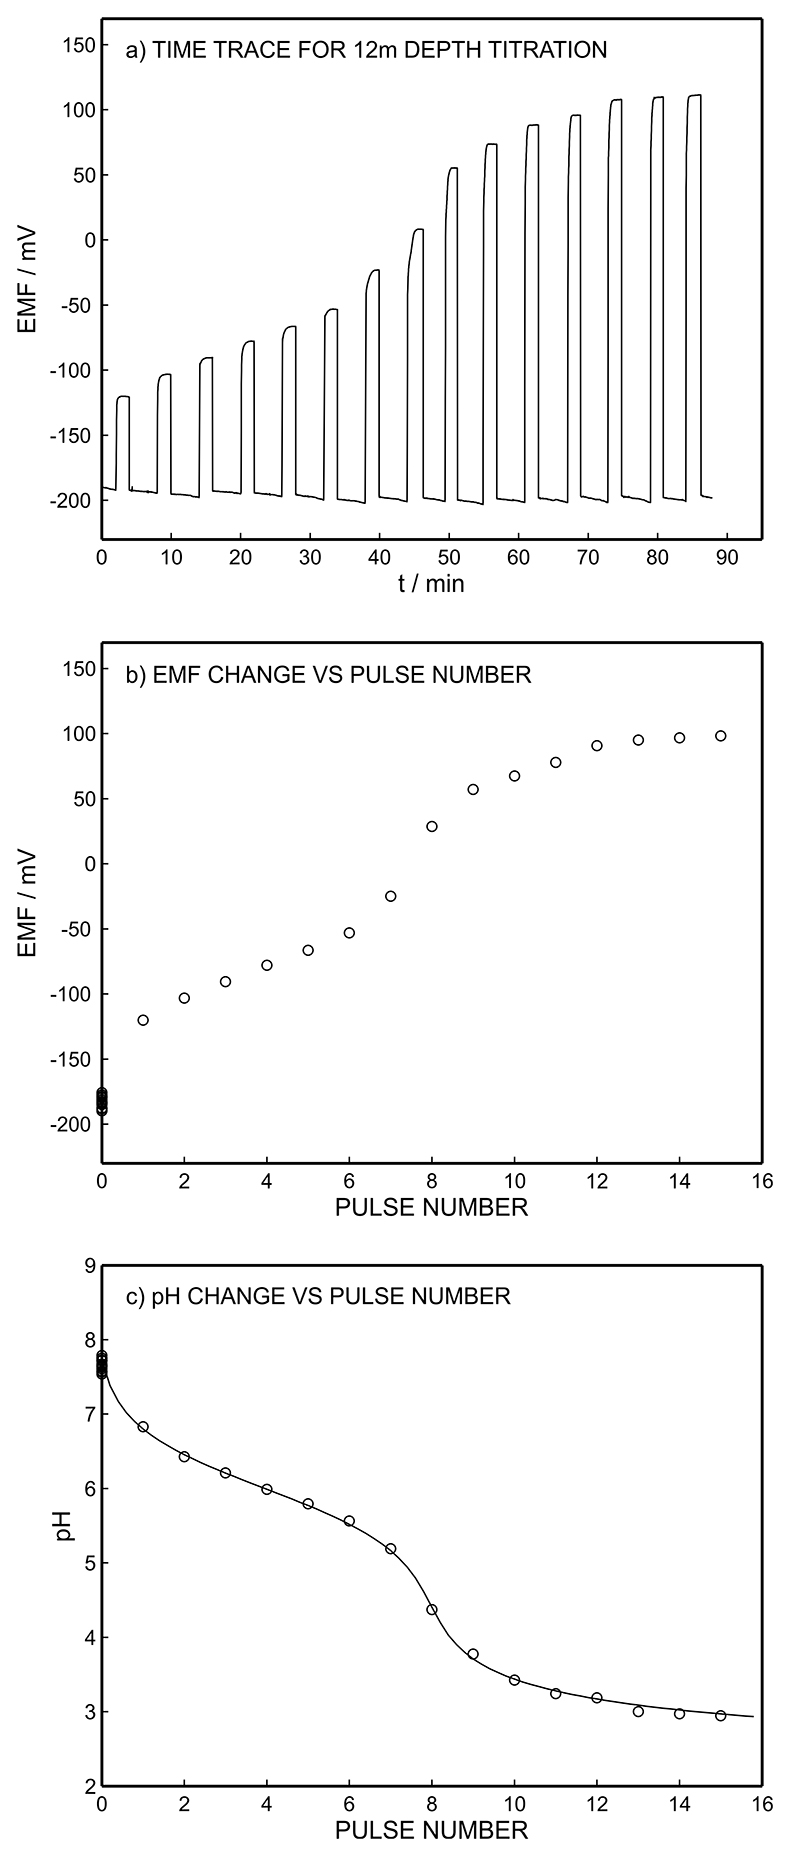
Figure S-3 (a) Potentiometric time trace at the pH probe for the titration of the Lake Greifen sample obtained at 12 m depth. (b) The obtained EMF value after applying each pulse as a function of the pulse number. (c) The calculated pH value at the pH sensor for each pulse.
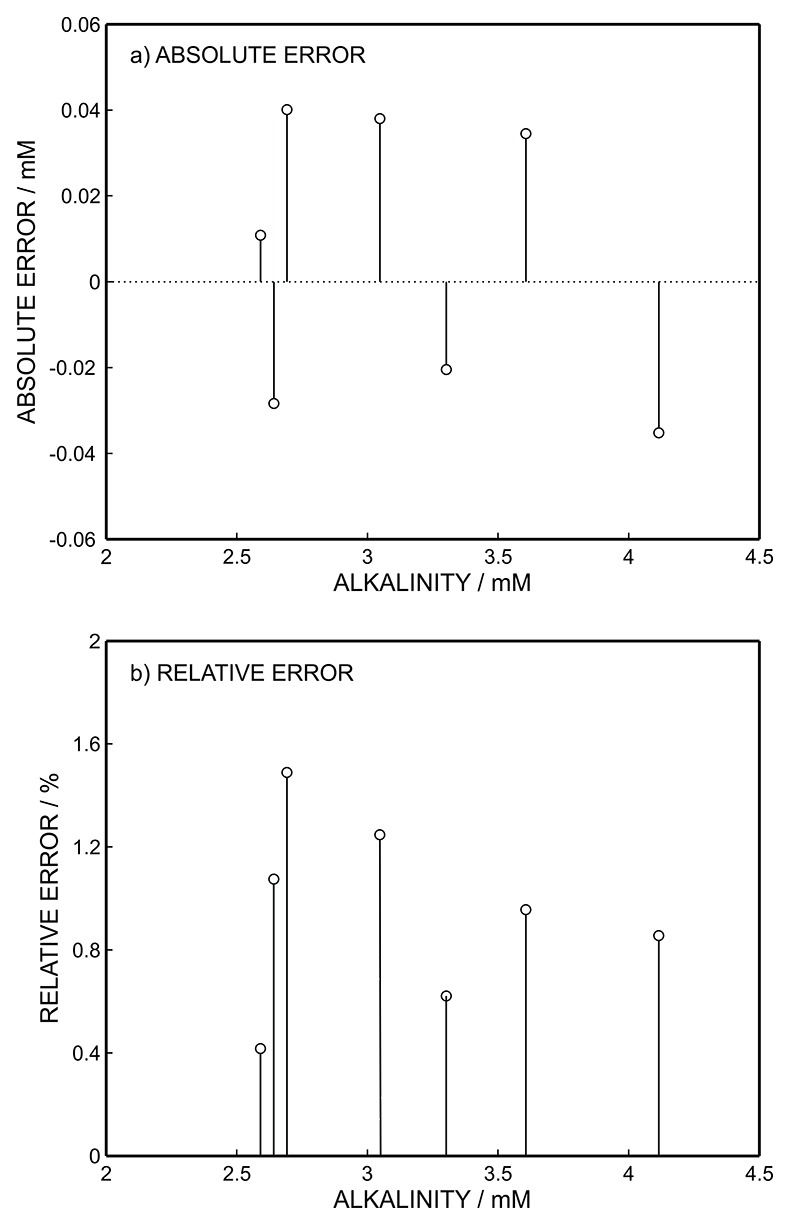
Figure S-4 (a) Absolute error for the alkalinity detection in mM. (b) Percentage relative error for the alkalinity determination. The average relative error of 0.95 % (less than 1 %) was obtained for the alkalinity detection by the methodology.
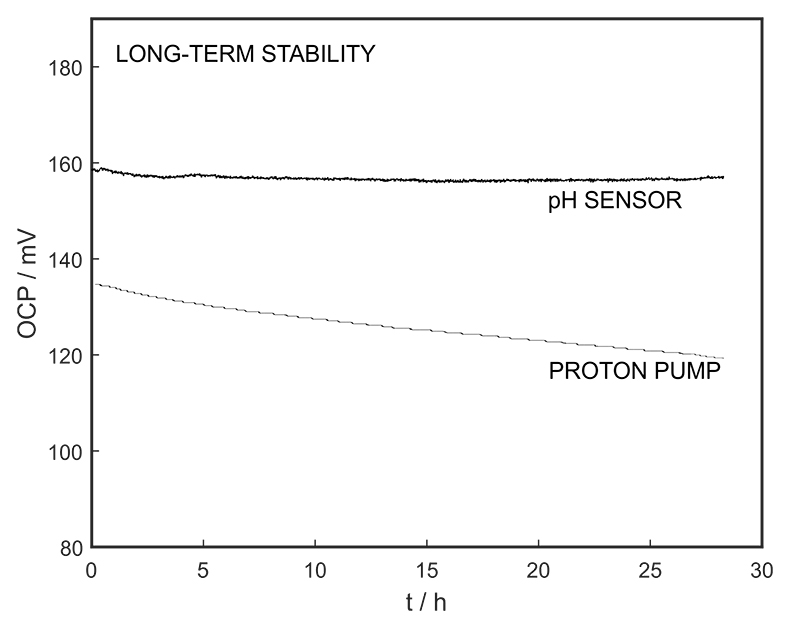
Figure S-5 Long-term stability for both pH sensor and proton pump.
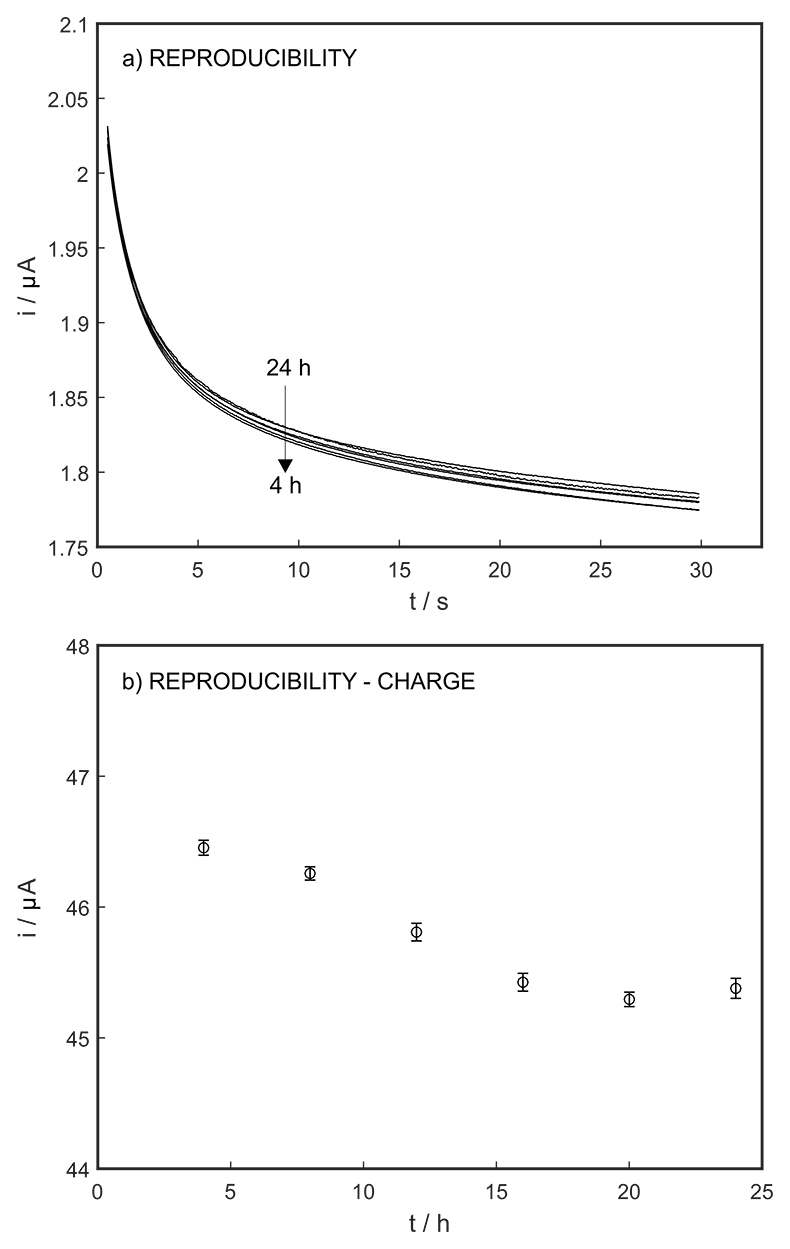
Figure S-6 (a) Reproducibility of the potential pulse by applying potential pulse of 300 mV vs. OCP for 30 s within one day. (b) Integrated charge of the potential pulse for every 4 hours.
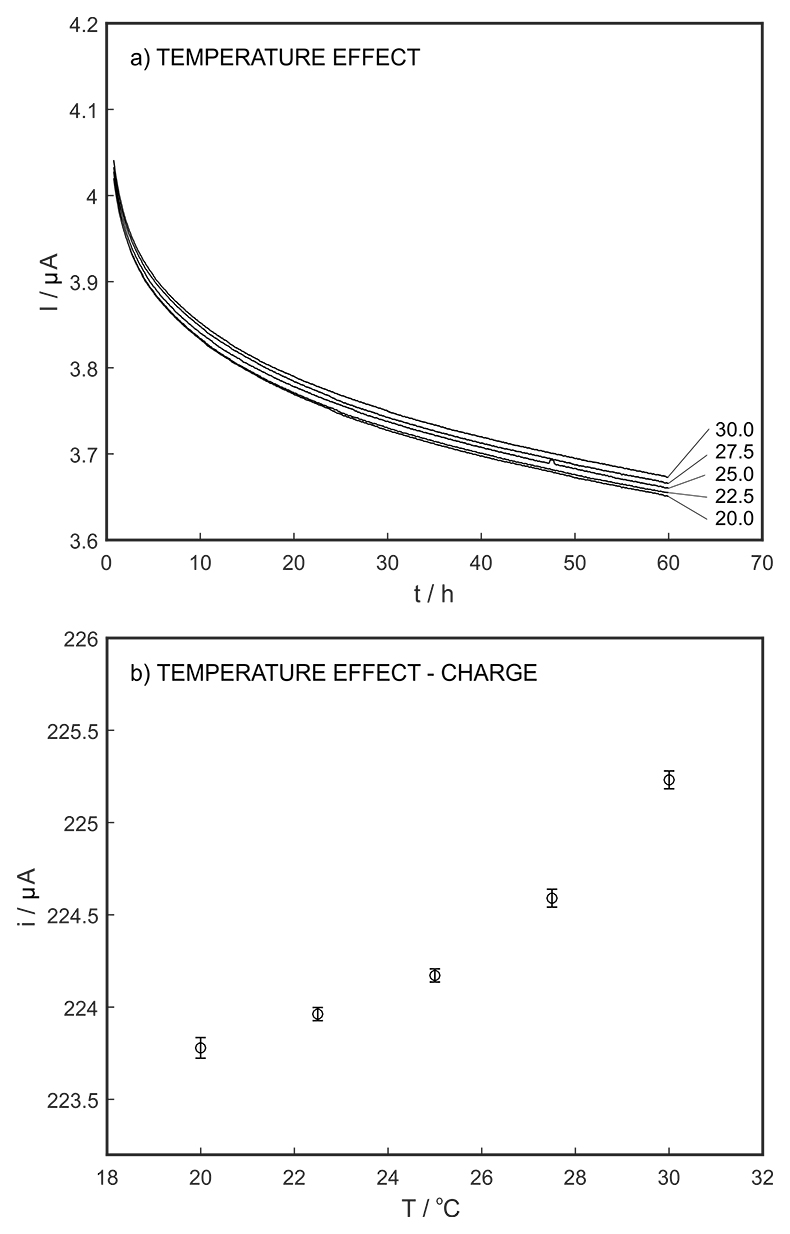
Figure S-7 (a) Influence of temperature on the released charge by applying potential pulse of 600 mV vs. OCP over 60 s. (b) The obtained charge value for various temperature within the range of 20 to 30 oC.
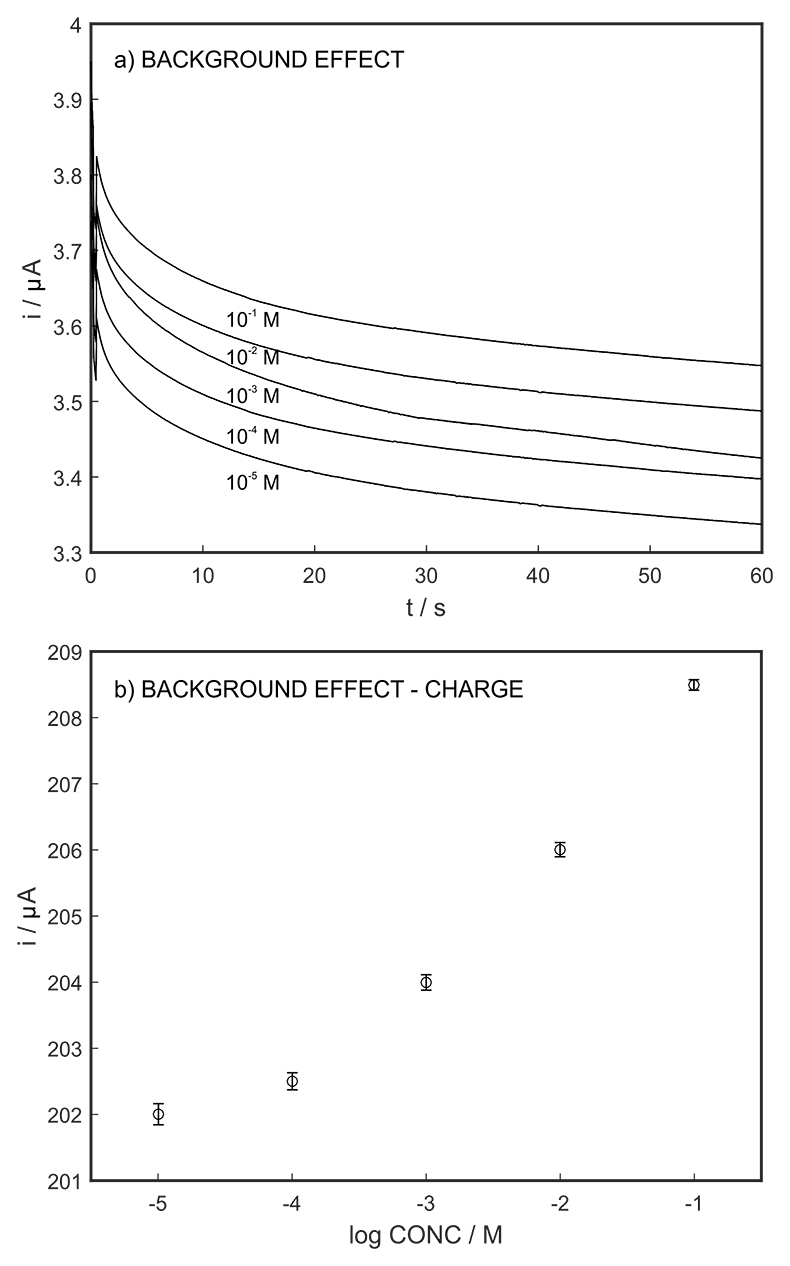
Figure S-8 (a) The influence of the background concentration on the released charge by applying potential pulse of 600 mV vs. OCP for 60 s. (b) Integrated charge for various sodium chloride concentrations within the range of 10-5 to 10-1 M as a background electrolyte.
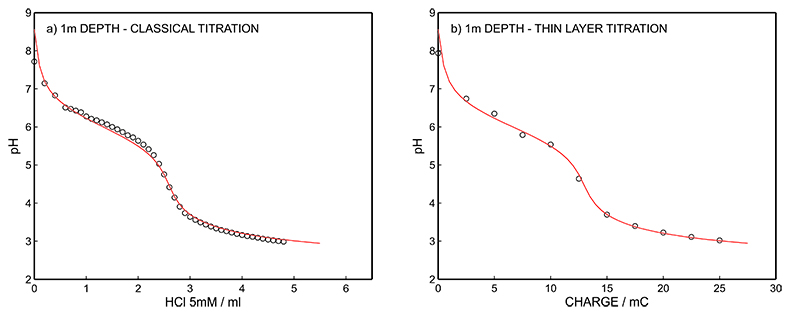
Figure S-9 (a) Classical acid-base titration for Lake Greifen sampled at 1 m depth. (b) Thin layer chemical titration for Lake Greifen sampled at 1 m depth. The alkalinity level at this depth is obtained as 2.59 mM. The red line is a theoretical fit.
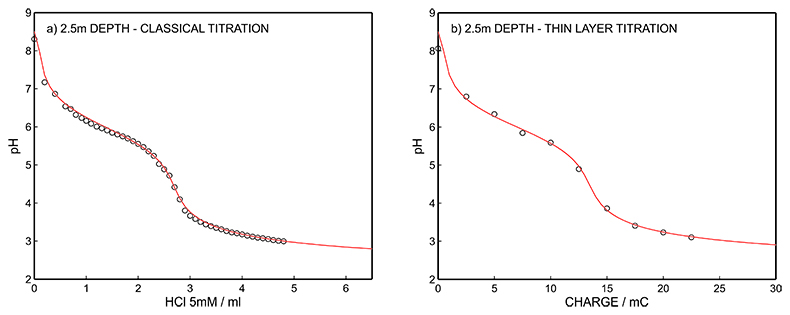
Figure S-10 (a) Classical acid-base titration for Lake Greifen sampled at 2.5 m depth. (b) Thin layer chemical titration for Lake Greifen sampled at 2.5 m depth. The alkalinity level at this depth is obtained as 2.64 mM. The red line is a theoretical fit.
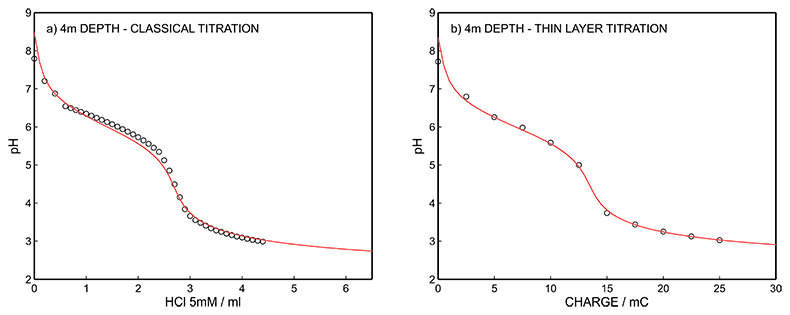
Figure S-11 (a) Classical acid-base titration for Lake Greifen sampled at 4 m depth. (b) Thin layer chemical titration for Lake Greifen sampled at 4 m depth. The alkalinity level at this depth is obtained as 2.69 mM. The red line is a theoretical fit.
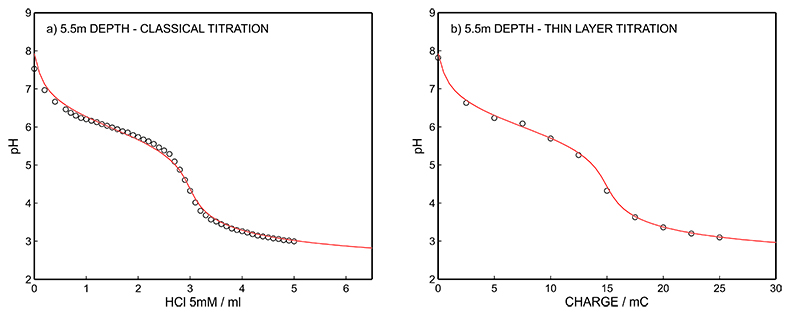
Figure S-12 (a) Classical acid-base titration for Lake Greifen sampled at 5.5 m depth. (b) Thin layer chemical titration for Lake Greifen sampled at 5.5 m depth. The alkalinity level at this depth is obtained as 3.04 mM. The red line is a theoretical fit.
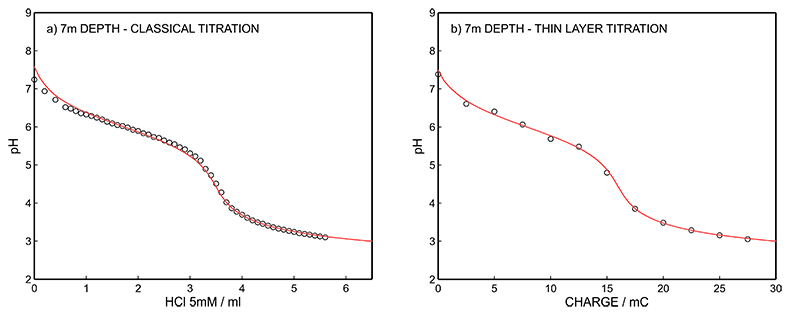
Figure S-13 (a) Classical acid-base titration for Lake Greifen sampled at 7 m depth. (b) Thin layer chemical titration for Lake Greifen sampled at 7 m depth. The alkalinity level at this depth is obtained as 3.30 mM. The red line is a theoretical fit.
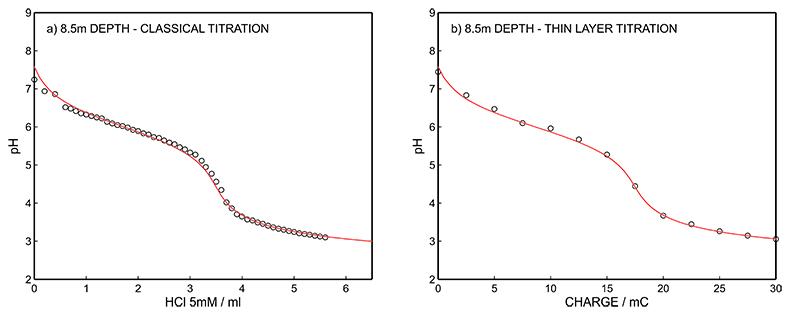
Figure S-14 (a) Classical acid-base titration for Lake Greifen sampled at 8.5 m depth. (b) Thin layer chemical titration for Lake Greifen sampled at 8.5 m depth. The alkalinity level at this depth is obtained as 3.60 mM. The red line is a theoretical fit.
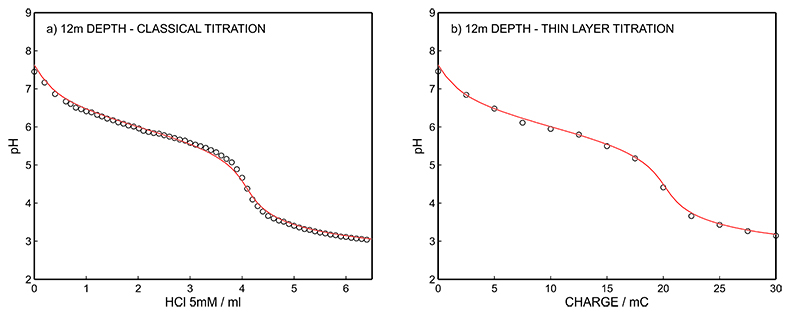
Figure S-15 (a) Classical acid-base titration for Lake Greifen sampled at 12 m depth. (b) Thin layer chemical titration for Lake Greifen sampled at 12 m depth. The alkalinity level at this depth is obtained as 4.11 mM. The red line is a theoretical fit.


