A magma mixing redox trap that moderates mass transfer of sulphur and metals
Affiliations | Corresponding Author | Cite as | Funding information
Keywords: magma-magma mixing, redox gradient, porphyry Cu-Au ore deposit formation, Fe XANES, dacite, andesite
- Share this article


- Article views:10,038
Cumulative count of HTML views and PDF downloads.
- Download Citation
- Rights & Permissions
Abstract
Figures and Tables
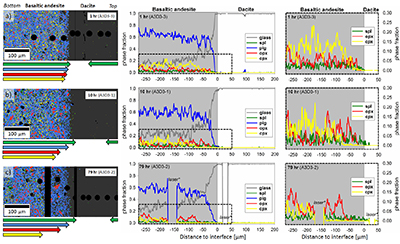 Figure 1 Maps and phase fraction plots illustrating the phase assemblages of the run products. The experiments were run vertically (top: dacite; bottom: basaltic andesite). (a) 1 hr run (experiment A3D3-3). (b) 10 hr (A3D3-1); (c) 79 hr (A3D3-2). Left column: WDS (Al, Fe, Mg, Ca, K) and EDS (Si, Na) maps were used to produce phase assemblage maps. The “glass only” area (grey) of each diffusion couple grows with time. The arrows below each map indicate the presence of a certain mineral phase away from the basaltic andesite or dacitic far side up until the tip of the respective arrow, where green = spinel (spl), blue = plagioclase (plag), red = orthopyroxene (opx), and yellow = clinopyroxene (cpx). Centre and right column: The phase fraction for a certain distance away from the interface was calculated using WDS/EDS maps. The right column is a magnification, displaying only the fractions for spl, opx, and cpx. | 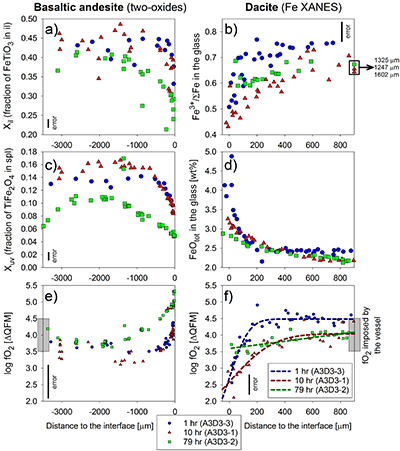 Figure 2 Redox profiles in the dacite and the basaltic andesite determined by Fe µ-XANES and two-oxide oxybarometry, respectively. (a) Fraction of TiFe2O4 in spl vs. distance to the interface. (b) Fe3+/ΣFe in dacitic glass vs. distance to the interface. (c) Fraction of FeTiO3 in il vs. distance to the interface. (d) Fetot concentrations in the melt on the dacitic side. (e) fO2 of the basaltic andesite side vs. distance to the interface; fO2 was calculated using Ghiorso and Evans (2008). (f) fO2 of the dacite side vs. distance to the interface; fO2 was predicted using Moretti (2005). For the calculations we used the Fe3+/ΣFe ratios determined via XANES and the local glass composition determined via EPMA (Supplementary Information A). | 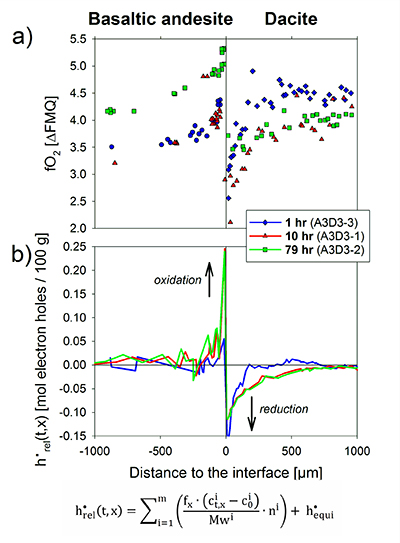 Figure 3 Diffusion-induced redox gradients and estimate of the electron hole disequilibrium of the melt across the interface. (a) Magnification of Figure 2e-f. (b) The trends are calculated using the equation below the figure, where h•rel(t,x) is the relative change in electron holes (mol/100 g) at a distance x to the interface and at a time t integrated diffusive flux, thus, the sum of the concentration differences for each element i with the oxidation state n (e.g., n = +1 for Na and n = -1 for Cl) from its initial concentration (ct,x -c0). Mw and ft,x are the molecular weight and the melt fraction, respectively. The melt composition at the far side of the basaltic andesite and the dacite was assumed to represent the zero-time melt composition (c0). The calculated trends probably represent the maximum diffusion-induced electron hole gradient because we do not account for the effects of simultaneous electron hole equilibration (h•equi), associated, e.g., with h• counter flux, H2 diffusion, and phase change (i.e. mineral dissolution); the latter process is presumably balanced, whereas the first two compensate h• gradients with time. The calculated h• gradients would allow the oxidation/reduction of up to 10 wt. % Fe near the interface, while we observe a maximum change by ~0.8 wt. % Fe (see Supplementary Information A.4.5). |
| Figure 1 | Figure 2 | Figure 3 |
Supplementary Figures and Tables
 Table S-A1 Composition of the bulk rock starting material and the anhydrous starting glass. | 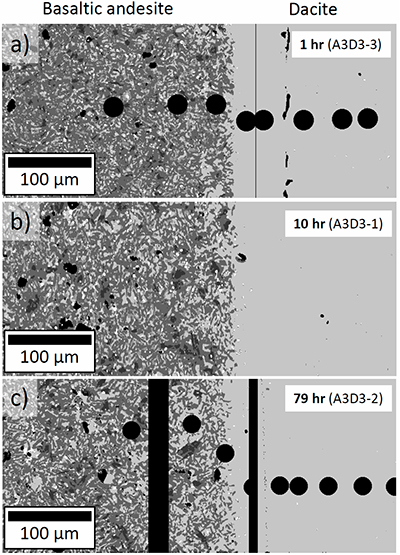 Figure S-A1 Back scattered electron (BSE) images of the run products of the diffusion couple experiments. |  Table S-A2 Centroid energies of the Fe pre-edge peak determined for felsic reference glasses. | 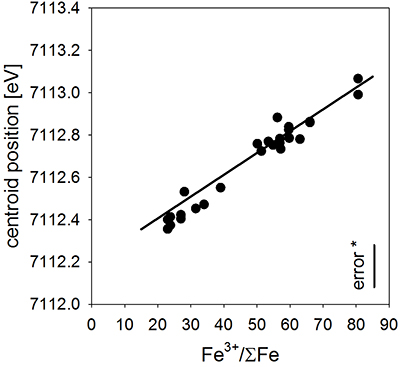 Figure S-A2 Results of the Fe µ-XANES calibration. The solid line represents the linear regression (Eq. S-A1). *conservative estimation for the overall analytical uncertainty of the Fe µ-XANES method (see Cottrell et al., 2009; Fiege et al., 2017). | 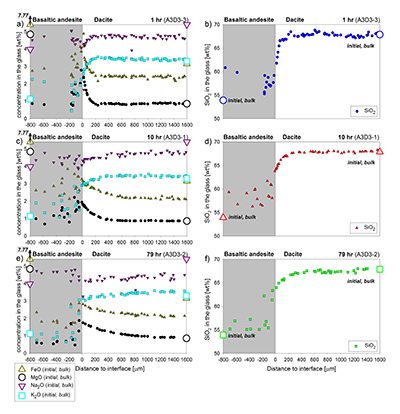 Figure S-A3 FeO, MgO, Na2O, K2O and SiO2 concentration profiles measured via EPMA in the glasses of the diffusion couple experiments. (a-b) 1 hr run duration (experiment A3D3-3). (c-d) 10 hr (A3D3-1). (e-f) 79 hr (A3D3-2). The larger, open symbols (with coloured edges) mark the initial contents measured in the anhydrous dacitic and basaltic andesite starting glasses. The black arrows indicate that the initial FeOtot content of the anhydrous basaltic andesite glass was 7.77 wt. % (see Table 1). The 1 σ error of the presented oxide concentrations are: ±0.2 wt. % FeO; ±0.1 wt. % MgO; ±0.2 wt. % Na2O; ±0.05 wt. % K2O; ±0.4 wt. % SiO2. The error of the distance is smaller than symbol size. |  Table S-B1 Sample registration |  Tables S-C EMPA, XANES, and Raman data. |  Tables S-D Phase fractions of the starting materials and experimental run products. |
| Table S-A1 | Figure S-A1 | Table S-A2 | Figure S-A2 | Figure S-A3 | Table S-B1 | Tables S-C | Tables S-D |
Introduction and Approach
Magmatic systems in Earth’s crust evolve through interplay between magma supply from the mantle and magma withdrawal feeding shallow reservoirs and, ultimately, volcanic eruptions (DePaolo, 1981
DePaolo, D.J. (1981) Trace element and isotopic effects of combined wallrock assimilation and fractional crystallization. Earth and Planetary Science Letters 53, 189–202.
; Hildreth and Moorbath, 1988
Hildreth, W., Moorbath, S. (1988) Crustal contributions to arc magmatism in the Andes of Central Chile. Contributions to Mineralogy and Petrology 98, 455–489.
Annen, C., Blundy, J.D., Sparks, R.S.J. (2006) The Genesis of Intermediate and Silicic Magmas in Deep Crustal Hot Zones. Journal of Petrology 47, 505–539.
). As a consequence, magma mixing is ubiquitous (Bacon and Metz, 1984
Bacon, C.R., Metz, J. (1984) Magmatic inclusions in rhyolites, contaminated basalts, and compositional zonation beneath the Coso volcanic field, California. Contributions to Mineralogy and Petrology 85, 346–365.
; Ruprecht and Bachmann, 2010
Ruprecht, P., Bachmann, O. (2010) Pre-eruptive reheating during magma mixing at Quizapu volcano and the implications for the explosiveness of silicic arc volcanoes. Geology 38, 919–922.
) and frequently invoked to explain geochemical records of, for example, volcanic gases (Wallace and Gerlach, 1994
Wallace, P., Gerlach, T.M. (1994) Magmatic vapor source for sulfur dioxide released during volcanic eruptions: Evidence from Mount Pinatubo. Science 265, 497-499
) and porphyry ore deposits (Audétat and Simon, 2012
Audétat, A., Simon, A. (2012) Magmatic controls on porphyry Cu genesis. In: Hedenquist, J.W., Harris, M., Camus, F. (Eds.) Economic Geology Monograph in honor of Richard Sillitoe. Society of Economic Geologists Special Publication No. 16, 553–572.
). Magma mixing processes are often discussed in the context of stirring and stretching (Bergantz, 2000
Bergantz, G.W. (2000) On the dynamics of magma mixing by reintrusion: implications for pluton assembly processes. Journal of Structural Geology 22, 1297–1309.
; Perugini et al., 2003
Perugini, D., Poli, G., Mazzuoli, R. (2003) Chaotic advection, fractals and diffusion during mixing of magmas: evidence from lava flows. Journal of Volcanology and Geothermal Research 124, 255–279.
; Ruprecht et al., 2008
Ruprecht, P., Bergantz, G.W., Dufek, J. (2008) Modeling of gas‐driven magmatic overturn: Tracking of phenocryst dispersal and gathering during magma mixing. Geochemistry, Geophysics, Geosystems 9, doi:10.1029/2008GC002022.
); however, homogenisation on all scales requires diffusive exchange along chemical gradients, especially in magma reservoirs with limited convection (Pichavant et al., 2007
Pichavant, M., Costa, F., Burgisser, A., Scaillet, B., Martel, C., Poussineau, S. (2007) Equilibration Scales in Silicic to Intermediate Magmas Implications for Experimental Studies. Journal of Petrology 48, 1955–1972.
). These mixing systems are typically characterised by multi-phase (crystal + melt + fluid) sub-liquidus conditions. To date, few experiments have explored the complex interplay of diffusion and phase change(s) at sub-liquidus temperatures (e.g., Watson, 1982
Watson, E.B. (1982) Basalt contamination by continental crust: Some experiments and models. Contributions to Mineralogy and Petrology 80, 73–87.
; Pistone et al., 2016
Pistone, M., Blundy, J.D., Brooker, R.A. (2016) Textural and chemical consequences of interaction between hydrous mafic and felsic magmas: an experimental study. Contributions to Mineralogy and Petrology 171, 8.
).
We performed sub-liquidus time-series experiments in rapid-quench, cold-seal TZM pressure vessels, which were investigated by micro X-ray absorption near-edge structure (µ-XANES) spectroscopy at Fe K-edge (Fiege et al., 2017
Fiege, A., Ruprecht, P., Simon, A.C., Bell, A.S., Göttlicher, J., Newville, M., Lanzirotti, T., Moore, G. (2017) Calibration of Fe XANES for high-precision determination of Fe oxidation state in glasses: Comparison of new and existing results obtained at different synchrotron radiation sources. American Mineralogist 102, 369–380.
), and two-oxide oxybarometry (Ghiorso and Evans, 2008
Ghiorso, M.S., Evans, B.W. (2008) Thermodynamics of Rhombohedral Oxide Solid Solutions and a Revision of the Fe-Ti Two-Oxide Geothermometer and Oxygen-Barometer. American Journal of Science 308, 957–1039.
), to document redox evolution near the magma-magma interface. Hydrous basaltic andesite and dacite cylinders were equilibrated separately at different conditions in gold capsules (basaltic andesite: 1030 °C, 1.1 wt. % H2O, 1000 ppm S, 500 ppm Cl; dacite: 950 °C, 3.9 wt. % H2O, 100 ppm S, 1500 ppm Cl; both at QFM + 4 and 150 MPa). The capsules were sliced, polished, and loaded into a gold capsule with the basaltic andesite on bottom and the dacite on top. The capsules were sealed with a lid on bottom and star crimped on top. Pre-compression of the capsules (~100 MPa) resulted in an ideal planar contact between both cylinders due to the star crimping technique. Subsequent mixing experiments (1000 °C, 150 MPa, QFM + 4, 1 to 79 hr) reveal a mostly crystal-free dacite. Minor amounts of Fe-Ti-oxides are consumed with time in a growing oxide-free zone near the interface (~50 to ~150 µm wide; Fig. 1). Meanwhile, crystallinity of the basaltic andesite near the interface (<150 µm) decreases continuously with time. During the mixing process, clinopyroxene (cpx) is the first completely resorbed silicate phase, followed by orthopyroxene (opx). Plagioclase (plg) is resorbed significantly near the interface in all experiments, but continues to constitute a rigid crystal network throughout the basaltic andesite. With increasing run duration, concentrations of felsic and mafic components decrease and increase, respectively, in the dacitic melt near the interface (Fig. S-A3). Diffusion profiles were observed for S (mafic to felsic) and Cl (felsic to mafic), whereas H2O remains constant away from the interface (Supplementary Information A and Supplementary Information C).

Figure 1 Maps and phase fraction plots illustrating the phase assemblages of the run products. The experiments were run vertically (top: dacite; bottom: basaltic andesite). (a) 1 hr run (experiment A3D3-3). (b) 10 hr (A3D3-1); (c) 79 hr (A3D3-2). Left column: WDS (Al, Fe, Mg, Ca, K) and EDS (Si, Na) maps were used to produce phase assemblage maps. The “glass only” area (grey) of each diffusion couple grows with time. The arrows below each map indicate the presence of a certain mineral phase away from the basaltic andesite or dacitic far side up until the tip of the respective arrow, where green = spinel (spl), blue = plagioclase (plag), red = orthopyroxene (opx), and yellow = clinopyroxene (cpx). Centre and right column: The phase fraction for a certain distance away from the interface was calculated using WDS/EDS maps. The right column is a magnification, displaying only the fractions for spl, opx, and cpx.
*Position of the vertical laser-ablation transect. For IGSN sample registration see Supplementary Information B. Phase fractions are provided in Supplementary Information D.
Determination of Redox Profiles
Redox-sensitive oxide-pairs (ilmenite, il; and spinel, spl) in the basaltic andesite reveal systematic compositional variations (Fig. 2, Table S-C9); the dacite lacks il, which prevents the application of two-oxide oxybarometry. In 1 hr and 10 hr experiments, Xil (fraction of FeTiO3 in il) and Xuv (fraction of TiFe2O4 in spl) decrease from ~0.45 and ~0.15 in the basaltic andesite far field to ~0.33 and ~0.10 near the interface, respectively. Far field oxide compositions are similar to those in the starting basaltic andesite (Xil ~0.44; Xuv ~0.13). The 79 hr experiment shows a more evolved profile, wherein the basaltic andesite interior contains oxides with compositions similar to the 1 hr and 10 hr experiment. A broad (>1500 µm) continuous decrease in Xil (~0.42 to ~0.24) and Xuv (~0.11 to ~0.05) emerges towards the interface. In contrast to the 1 hr and 10 hr profile, a decrease in Xil (~0.34) and Xuv (~0.06) was measured in the basaltic andesite far field (>2500 µm), which is directly related to the fO2 imposed by the experimental apparatus; i.e. an effect not expected in natural systems (see Supplementary Information A). These length scales of Xil and Xuv variations are significantly larger than the measured changes in crystallinity (<150 µm; Fig. 1), indicating that the observed redox gradient is largely decoupled from crystal resorption rate.
The µ-XANES analyses of the dacitic glass reveal significant changes in Fe oxidation state (Fig. 2b, Tables S-C11 to C13) that correlate spatially with FeOtot and other melt constituents (Fig. 2b,d). In the 1 hr and 10 hr experiments, Fe3+/ΣFe of the dacitic melt decreases by ~23 % from the far field to the interface. The Fe redox profile is relatively flat at 79 hr, with a minor decrease of Fe3+/ΣFe from ~68 % in the far field to ~60 % near the interface. At 200 µm (1 hr run) and 500 µm (10 hr and 79 hr) away from the interface, the profiles remain at constant Fe3+/ΣFe, whereas the far field of the 1 hr experiments is characterised by a ~6 % higher Fe3+/ΣFe compared to the 10 hr and 79 hr runs. The 6 % difference likely results from juxtaposing hotter mafic and cooler felsic magma at intermediate mixing temperatures, simulating nature. Here, fast thermal equilibration decreases Fe3+/ΣFe in the cooling mafic melt fraction and increases Fe3+/ΣFe within the heating felsic melt. This is confirmed by the far field results (Fig. 2), whereas the buffering capacity of the vessel eliminates this temperature effect with increasing run duration. The small quenched melt pools on the mafic side precluded precise XANES analyses.
Models for Fe3+/ΣFe (Fiege et al., 2017
Fiege, A., Ruprecht, P., Simon, A.C., Bell, A.S., Göttlicher, J., Newville, M., Lanzirotti, T., Moore, G. (2017) Calibration of Fe XANES for high-precision determination of Fe oxidation state in glasses: Comparison of new and existing results obtained at different synchrotron radiation sources. American Mineralogist 102, 369–380.
) and two-oxide oxybarometry (Ghiorso and Evans, 2008
Ghiorso, M.S., Evans, B.W. (2008) Thermodynamics of Rhombohedral Oxide Solid Solutions and a Revision of the Fe-Ti Two-Oxide Geothermometer and Oxygen-Barometer. American Journal of Science 308, 957–1039.
) reveal a zigzag redox trend near the interface (Fig. 2e-f). In particular, we observe a sudden fO2 drop at the interface that increases from ~1.3 log units fO2 after 1 hr and 10 hr to ~1.8 log units fO2 after 79 hr. Considering the temperature effect on fO2, the far sides of the longest run provide the best estimation of the accuracy of the two methods; i.e. both methods reproduce the local fO2 within 0.2 log units, considering the fO2 imposed by the vessel (QFM + 4; see Fig. 2e,f and Supplementary Information A.4.4). The oxide pairs are within ≤50 µm of each other relative to the interface and we only considered oxide pairs in Mg/Mn equilibrium (Bacon and Hirschmann, 1988
Bacon, C.R., Hirschmann, M.M. (1988) Mg/Mn partitioning as a test for equilibrium between coexisting Fe-Ti oxides. American Mineralogist 73, 57–61.
).

Figure 2 Redox profiles in the dacite and the basaltic andesite determined by Fe µ-XANES and two-oxide oxybarometry, respectively. (a) Fraction of TiFe2O4 in spl vs. distance to the interface. (b) Fe3+/ΣFe in dacitic glass vs. distance to the interface. (c) Fraction of FeTiO3 in il vs. distance to the interface. (d) Fetot concentrations in the melt on the dacitic side. (e) fO2 of the basaltic andesite side vs. distance to the interface; fO2 was calculated using Ghiorso and Evans (2008)
Ghiorso, M.S., Evans, B.W. (2008) Thermodynamics of Rhombohedral Oxide Solid Solutions and a Revision of the Fe-Ti Two-Oxide Geothermometer and Oxygen-Barometer. American Journal of Science 308, 957–1039.
. (f) fO2 of the dacite side vs. distance to the interface; fO2 was predicted using Moretti (2005)
Moretti, R. (2005) Polymerisation, basicity, oxidation state and their role in ionic modelling of silicate melts. Annales Geophysicae 48, 583–608.
. For the calculations we used the Fe3+/ΣFe ratios determined via XANES and the local glass composition determined via EPMA (Supplementary Information A).
The vertical black bars represent the average of 2σ errors (Fig. 2a-c); 1σ error of the FeOtot concentrations in the glasses is ±0.2 wt. % (Fig. 2d). The indicated errors for fO2 represent conservative estimations for the overall uncertainty of the two-oxides (±0.5 log units; Fig. 2e) and Fe µ-XANES (±0.2 log units; Fig. 2f) method, respectively. Both methods reproduce the fO2 imposed by the vessel within 0.2 log units for run duration ≥10 hr, providing an independent constraint for the high accuracy and comparability of the two datasets.
Discussion of the Redox Mechanism
Intriguingly, a significant redox gradient at the interface is observed in all run products, reaching ~1.8 log units fO2 after 79 hr. Thus, this transient redox gradient may initially grow with time and is of relevance for several days and possibly weeks. In the absence of water diffusion profiles (confirmed by Raman spectroscopy on the dacitic side; see Supplementary Information C), water exchange cannot be responsible for the redox gradient. In magmatic systems, the net redox gradient at the interface may grow with time, considering that our experiments are externally buffered, resulting in a fading redox gradient with increasing run duration, consistent with H2 diffusivities (see Zhang and Ni, 2010
Zhang, Y., Ni, H. (2010) Diffusion of H, C, and O Components in Silicate Melts. Reviews in Mineralogy and Geochemistry 72, 171-225.
; and Supplementary Information A.4.5).
We propose that the redox gradient reflects a transient electron hole gradient that emerges between two mixing magmas as mass is transferred across the interface. The observed mineral resorption sequence of cpx → opx → plg (→ oxides; Fig. 1) and concentration maxima at the interface for, e.g., Fe and Mg (Fig. S-A3) indicate that compatible elements are added to the melt near the interface, inducing a diffusive flux from mafic to felsic magma. Mass transfer of cations, and, in particular, of divalent network modifying cations, requires a counter flux of charge-compensating electron holes (h•, where the superscript dot indicates a single positive charge), which are the dominant mobile electronic species in Fe-bearing silicate melts (e.g., Cooper et al., 2010
Cooper, R.F., Everman, R.L., Hustoft, J.W., Dan Shim, S.H. (2010) Mechanism and kinetics of reduction of a FeO-Fe2O3-CaO-MgO aluminosilicate melt in a high-CO-activity environment. American Mineralogist 95, 810–824.
; Cooper, 2017
Cooper, R.F. (2017) Redox Thermodynamics and Kinetics in Silicate Melts and Glasses—and Related Morphology/Texture. In: Richet, P. (Ed.) Encyclopedia of Glass Science, Technology, History and Culture. In press.
). This coupled cation – electron hole flux in Fe-bearing silicate melts (Mode III redox; Cook and Cooper, 2000
Cook, G.B., Cooper, R.F. (2000) Iron concentration and the physical processes of dynamic oxidation in an alkaline earth aluminosilicate glass. American Mineralogist 85, 397–406.
) kinetically dominates redox control relative to other known mechanisms that involve flux of a neutral gas species (e.g., Mode I of Cook and Cooper, 2000
Cook, G.B., Cooper, R.F. (2000) Iron concentration and the physical processes of dynamic oxidation in an alkaline earth aluminosilicate glass. American Mineralogist 85, 397–406.
; see also Gaillard et al., 2003
Gaillard, F., Schmidt, B., Mackwell, S., McCammon, C. (2003) Rate of hydrogen–iron redox exchange in silicate melts and glasses. Geochimica et Cosmochimica Acta 67, 2427–2441.
) and oxygen flux (e.g., Mode II of Cook and Cooper, 2000
Cook, G.B., Cooper, R.F. (2000) Iron concentration and the physical processes of dynamic oxidation in an alkaline earth aluminosilicate glass. American Mineralogist 85, 397–406.
); the latter mechanism has mostly been ruled out as a diffusive redox control in silicate melts (Cooper et al., 1996
Cooper, R.F., Fanselow, J.B., Poker, D.B. (1996) The mechanism of oxidation of a basaltic glass: chemical diffusion of network-modifying cations. Geochimica et Cosmochimica Acta 60, 3253–3265.
; Gaillard et al., 2003
Gaillard, F., Schmidt, B., Mackwell, S., McCammon, C. (2003) Rate of hydrogen–iron redox exchange in silicate melts and glasses. Geochimica et Cosmochimica Acta 67, 2427–2441.
).
In a magma-magma mixing environment, the thermodynamic disequilibrium imposed by juxtaposing two chemically distinct systems results in a chemical potential that drives significant mass transfer between both systems (e.g., see Fig. S-A3). Thus, the formation of a redox gradient at a magma-magma interface suggests that the h• counter flux is insufficient to balance the significant mass flux across the interface, indicating rather low h• concentrations in the studied system (cf. Cooper et al., 2010
Cooper, R.F., Everman, R.L., Hustoft, J.W., Dan Shim, S.H. (2010) Mechanism and kinetics of reduction of a FeO-Fe2O3-CaO-MgO aluminosilicate melt in a high-CO-activity environment. American Mineralogist 95, 810–824.
). This hypothesis can be tested by performing simplified model calculations that consider the relative changes in melt composition on both sides of the diffusion couple as a function of distance to the interface, while ignoring simultaneous electron hole equilibration (h•equi; see Fig. 3, Supplementary Information A.4.5). The estimated h• gradients predict an electron hole enrichment zone (oxidation) in the basaltic andesite near the interface, and an electron hole depletion zone (reduction) in the dacite, mimicking the measured redox variations. Here, the melt Fe3+/ΣFe presumably responds immediately to the diffusion-induced electron hole imbalance, while the chemistry of the il-spl oxide pairs will follow those changes with a slight delay. Considering the small size of the oxides (typically <5 µm), equilibrium with the surrounding melt is reached within ≪10 hr (Freer and Hauptman, 1978
Freer, R., Hauptman, Z. (1978) Experimental-study of magnetite-titanomagnetite interdiffusion. Physics of the Earth and Planetary Interiors 16, 223–231.
). Hence, the redox profiles determined for the basaltic andesite side of the diffusion couples may represent minimum gradients for the 1 hr and the 10 hr experiments, while it probably closely reflects the prevailing redox conditions of the melt in close proximity to the respective crystal pair for the 79 hr experiment. The proposed mechanism is consistent with theoretical considerations of Evans (2006)
Evans, K.A. (2006) Redox decoupling and redox budgets: Conceptual tools for the study of earth systems. Geology 34, 489–492.
and studies of redox processes in Fe-bearing magnesium aluminosilicate glasses, and basaltic glasses and melts (e.g., Cooper et al., 1996
Cooper, R.F., Fanselow, J.B., Poker, D.B. (1996) The mechanism of oxidation of a basaltic glass: chemical diffusion of network-modifying cations. Geochimica et Cosmochimica Acta 60, 3253–3265.
, 2010
Cooper, R.F., Everman, R.L., Hustoft, J.W., Dan Shim, S.H. (2010) Mechanism and kinetics of reduction of a FeO-Fe2O3-CaO-MgO aluminosilicate melt in a high-CO-activity environment. American Mineralogist 95, 810–824.
).
We note that the release of predominantly ferrous Fe from resorbing cpx and opx (opx: Fe2+; cpx: low Fe3+/ΣFe) may decouple from the initial fO2 and may contribute to the observed Fe3+/ΣFe gradient on the dacitic side, but cannot explain the observed zigzag redox trend in full.

Figure 3 Diffusion-induced redox gradients and estimate of the electron hole disequilibrium of the melt across the interface. (a) Magnification of Figure 2e-f. (b) The trends are calculated using the equation below the figure, where h•rel(t,x) is the relative change in electron holes (mol/100 g) at a distance x to the interface and at a time t integrated diffusive flux, thus, the sum of the concentration differences for each element i with the oxidation state n (e.g., n = +1 for Na and n = -1 for Cl) from its initial concentration (ct,x -c0). Mw and ft,x are the molecular weight and the melt fraction, respectively. The melt composition at the far side of the basaltic andesite and the dacite was assumed to represent the zero-time melt composition (c0). The calculated trends probably represent the maximum diffusion-induced electron hole gradient because we do not account for the effects of simultaneous electron hole equilibration (h•equi), associated, e.g., with h• counter flux, H2 diffusion, and phase change (i.e. mineral dissolution); the latter process is presumably balanced, whereas the first two compensate h• gradients with time. The calculated h• gradients would allow the oxidation/reduction of up to 10 wt. % Fe near the interface, while we observe a maximum change by ~0.8 wt. % Fe (see Supplementary Information A.4.5).
Implications of a Magma-Magma Mixing Redox Trap
The experiments show that a redox gradient can form when two chemically distinct magmas mix across an evolving compositional and textural interface. The net gradient, the stability of the gradient, as well as the spatial extent of the gradient are probably significantly affected by the (pre-)mixing pressure and temperature conditions as well as by the compositions and fO2 of the two mixing magmas. Whether the observed effect of local magma reduction/oxidation is of importance on a larger scale during magma evolution depends on the timescale of fractionation of melts and the surface area of mafic-felsic interfaces. It presumably affects redox conditions recorded by melt inclusions entrapped near the boundary during an initial stage of mixing.
We suggest that the observed redox process has implications for the mass transfer of S from mafic to felsic magma during underplating and/or recharge events. Here, S mass transfer occurs by diffusive transport or as a component of a magmatic volatile phase (MVP), and both mechanisms are dependent on the oxidation state of S (e.g., Wallace, 2005
Wallace, P.J. (2005) Volatiles in subduction zone magmas: concentrations and fluxes based on melt inclusion and volcanic gas data. Journal of Volcanology and Geothermal Research 140, 217–240.
; Behrens and Stelling, 2011
Behrens, H., Stelling, J. (2011) Diffusion and redox reactions of sulfur in silicate melts. Reviews in Mineralogy and Geochemistry 73, 79–111.
; Audétat and Simon, 2012
Audétat, A., Simon, A. (2012) Magmatic controls on porphyry Cu genesis. In: Hedenquist, J.W., Harris, M., Camus, F. (Eds.) Economic Geology Monograph in honor of Richard Sillitoe. Society of Economic Geologists Special Publication No. 16, 553–572.
; Burgisser et al., 2015
Burgisser, A., Alletti, M., Scaillet, B. (2015) Simulating the behavior of volatiles belonging to the C–O–H–S system in silicate melts under magmatic conditions with the software D-Compress. Computers & Geosciences 79, 1–14.
; Parmigiani et al., 2016
Parmigiani, A., Fraroughi, S., Huber, C., Bachmann, O., Su, Y. (2016) Bubble accumulation and its role in the evolution of magma reservoirs in the upper crust. Nature 532, 492–495.
). Although more experiments are required, we also presume variations in fO2 at the magma-magma boundary layer under more reducing pre-mixing conditions, considering that the proposed mechanism, i.e. diffusion-induced electron hole imbalance, primarily depends on chemical differences, and less on the pre-mixing oxidation state of polyvalent elements (mainly Fe, S). In such systems, changes in the SO2/H2S ratio of the MVP are expected near the magma-magma interface (e.g., Burgisser et al., 2015
Burgisser, A., Alletti, M., Scaillet, B. (2015) Simulating the behavior of volatiles belonging to the C–O–H–S system in silicate melts under magmatic conditions with the software D-Compress. Computers & Geosciences 79, 1–14.
), modifying its ability to scavenge Au from the melt (Zajacz et al., 2012
Zajacz, Z., Candela, P.A., Piccoli, P.M., Wälle, M. Sanchez-Valle, C. (2012) Gold and copper in volatile saturated mafic to intermediate magmas: Solubilities, partitioning, and implications for ore deposit formation. Geochimica et Cosmochimica Acta 91, 140–159.
). On the contrary, Cu exists in the MVP as a neutral Cu-alkali-Cl complex and its MVP/melt partitioning is redox insensitive (Zajacz et al., 2012
Zajacz, Z., Candela, P.A., Piccoli, P.M., Wälle, M. Sanchez-Valle, C. (2012) Gold and copper in volatile saturated mafic to intermediate magmas: Solubilities, partitioning, and implications for ore deposit formation. Geochimica et Cosmochimica Acta 91, 140–159.
). Hence, the observed redox effects may moderate the Cu/Au ratio of porphyry-type ore deposits that ultimately form by advection of a MVP into the overlying environment (Audétat and Simon, 2012
Audétat, A., Simon, A. (2012) Magmatic controls on porphyry Cu genesis. In: Hedenquist, J.W., Harris, M., Camus, F. (Eds.) Economic Geology Monograph in honor of Richard Sillitoe. Society of Economic Geologists Special Publication No. 16, 553–572.
).
Acknowledgements
This project was supported by a US National Science Foundation Collaborative Research grant to A.C.S. (EAR 1250239) and P.R. (EAR 1250414). P.R. also acknowledges support through EAR 1347880. This research used resources of the Advanced Photon Source, a US Department of Energy (DOE) Office of Science User Facility operated for the DOE Office of Science by Argonne National Laboratory under Contract No. DE-AC02-06CH11357. Brief discussions with Paul Ratteron, Reid Cooper and Dave Walker were helpful to refine our model of the redox gradient. We are grateful to Bruno Scaillet, anonymous reviewers, and the editorial advice of Helen Williams who helped to improve this manuscript.
Editor: Helen Williams
References
Annen, C., Blundy, J.D., Sparks, R.S.J. (2006) The Genesis of Intermediate and Silicic Magmas in Deep Crustal Hot Zones. Journal of Petrology 47, 505–539.
Magmatic systems in Earth’s crust evolve through interplay between magma supply from the mantle and magma withdrawal feeding shallow reservoirs and, ultimately, volcanic eruptions (DePaolo, 1981; Hildreth and Moorbath, 1988; Annen et al., 2006).
Audétat, A., Simon, A. (2012) Magmatic controls on porphyry Cu genesis. In: Hedenquist, J.W., Harris, M., Camus, F. (Eds.) Economic Geology Monograph in honor of Richard Sillitoe. Society of Economic Geologists Special Publication No. 16, 553–572.
As a consequence, magma mixing is ubiquitous (Bacon and Metz, 1984; Ruprecht and Bachmann, 2010) and frequently invoked to explain geochemical records of, for example, volcanic gases (Wallace and Gerlach, 1994) and porphyry ore deposits (Audétat and Simon, 2012).
View in article
Here, S mass transfer occurs by diffusive transport or as a component of a magmatic volatile phase (MVP), and both mechanisms are dependent on the oxidation state of S (e.g., Wallace, 2005; Behrens and Stelling, 2011; Audétat and Simon, 2012; Burgisser et al., 2015; Parmigiani et al., 2016).
View in article
Hence, the observed redox effects may moderate the Cu/Au ratio of porphyry-type ore deposits that ultimately form by advection of a MVP into the overlying environment (Audétat and Simon, 2012).
Bacon, C.R., Hirschmann, M.M. (1988) Mg/Mn partitioning as a test for equilibrium between coexisting Fe-Ti oxides. American Mineralogist 73, 57–61.
The oxide pairs are within ≤50 µm of each other relative to the interface and we only considered oxide pairs in Mg/Mn equilibrium (Bacon and Hirschmann, 1988).
Bacon, C.R., Metz, J. (1984) Magmatic inclusions in rhyolites, contaminated basalts, and compositional zonation beneath the Coso volcanic field, California. Contributions to Mineralogy and Petrology 85, 346–365.
As a consequence, magma mixing is ubiquitous (Bacon and Metz, 1984; Ruprecht and Bachmann, 2010) and frequently invoked to explain geochemical records of, for example, volcanic gases (Wallace and Gerlach, 1994) and porphyry ore deposits (Audétat and Simon, 2012).
Behrens, H., Stelling, J. (2011) Diffusion and redox reactions of sulfur in silicate melts. Reviews in Mineralogy and Geochemistry 73, 79–111.
Here, S mass transfer occurs by diffusive transport or as a component of a magmatic volatile phase (MVP), and both mechanisms are dependent on the oxidation state of S (e.g., Wallace, 2005; Behrens and Stelling, 2011; Audétat and Simon, 2012; Burgisser et al., 2015; Parmigiani et al., 2016).
View in article
Bergantz, G.W. (2000) On the dynamics of magma mixing by reintrusion: implications for pluton assembly processes. Journal of Structural Geology 22, 1297–1309.
Magma mixing processes are often discussed in the context of stirring and stretching (Bergantz, 2000; Perugini et al., 2003; Ruprecht et al., 2008); however, homogenisation on all scales requires diffusive exchange along chemical gradients, especially in magma reservoirs with limited convection (Pichavant et al., 2007).
Burgisser, A., Alletti, M., Scaillet, B. (2015) Simulating the behavior of volatiles belonging to the C–O–H–S system in silicate melts under magmatic conditions with the software D-Compress. Computers & Geosciences 79, 1–14.
Here, S mass transfer occurs by diffusive transport or as a component of a magmatic volatile phase (MVP), and both mechanisms are dependent on the oxidation state of S (e.g., Wallace, 2005; Behrens and Stelling, 2011; Audétat and Simon, 2012; Burgisser et al., 2015; Parmigiani et al., 2016).
View in article
In such systems, changes in the SO2/H2S ratio of the MVP are expected near the magma-magma interface (e.g., Burgisser et al., 2015), modifying its ability to scavenge Au from the melt (Zajacz et al., 2012).
Cook, G.B., Cooper, R.F. (2000) Iron concentration and the physical processes of dynamic oxidation in an alkaline earth aluminosilicate glass. American Mineralogist 85, 397–406.
This coupled cation – electron hole flux in Fe-bearing silicate melts (Mode III redox; Cook and Cooper, 2000) kinetically dominates redox control relative to other known mechanisms that involve flux of a neutral gas species (e.g., Mode I of Cook and Cooper, 2000; see also Gaillard et al., 2003) and oxygen flux (e.g., Mode II of Cook and Cooper, 2000); the latter mechanism has mostly been ruled out as a diffusive redox control in silicate melts (Cooper et al., 1996; Gaillard et al., 2003).
Cooper, R.F. (2017) Redox Thermodynamics and Kinetics in Silicate Melts and Glasses—and Related Morphology/Texture. In: Richet, P. (Ed.) Encyclopedia of Glass Science, Technology, History and Culture. In press.
Mass transfer of cations, and, in particular, of divalent network modifying cations, requires a counter flux of charge-compensating electron holes (h•, where the superscript dot indicates a single positive charge), which are the dominant mobile electronic species in Fe-bearing silicate melts (e.g., Cooper et al., 2010; Cooper, 2017).
Cooper, R.F., Fanselow, J.B., Poker, D.B. (1996) The mechanism of oxidation of a basaltic glass: chemical diffusion of network-modifying cations. Geochimica et Cosmochimica Acta 60, 3253–3265.
This coupled cation – electron hole flux in Fe-bearing silicate melts (Mode III redox; Cook and Cooper, 2000) kinetically dominates redox control relative to other known mechanisms that involve flux of a neutral gas species (e.g., Mode I of Cook and Cooper, 2000; see also Gaillard et al., 2003) and oxygen flux (e.g., Mode II of Cook and Cooper, 2000); the latter mechanism has mostly been ruled out as a diffusive redox control in silicate melts (Cooper et al., 1996; Gaillard et al., 2003).
The proposed mechanism is consistent with theoretical considerations of Evans (2006) and studies of redox processes in Fe-bearing magnesium aluminosilicate glasses, and basaltic glasses and melts (e.g., Cooper et al., 1996, 2010).
Cooper, R.F., Everman, R.L., Hustoft, J.W., Dan Shim, S.H. (2010) Mechanism and kinetics of reduction of a FeO-Fe2O3-CaO-MgO aluminosilicate melt in a high-CO-activity environment. American Mineralogist 95, 810–824.
Mass transfer of cations, and, in particular, of divalent network modifying cations, requires a counter flux of charge-compensating electron holes (h•, where the superscript dot indicates a single positive charge), which are the dominant mobile electronic species in Fe-bearing silicate melts (e.g., Cooper et al., 2010; Cooper, 2017).
Thus, the formation of a redox gradient at a magma-magma interface suggests that the h• counter flux is insufficient to balance the significant mass flux across the interface, indicating rather low h• concentrations in the studied system (cf. Cooper et al., 2010).
View in article
The proposed mechanism is consistent with theoretical considerations of Evans (2006) and studies of redox processes in Fe-bearing magnesium aluminosilicate glasses, and basaltic glasses and melts (e.g., Cooper et al., 1996, 2010).
DePaolo, D.J. (1981) Trace element and isotopic effects of combined wallrock assimilation and fractional crystallization. Earth and Planetary Science Letters 53, 189–202.
Magmatic systems in Earth’s crust evolve through interplay between magma supply from the mantle and magma withdrawal feeding shallow reservoirs and, ultimately, volcanic eruptions (DePaolo, 1981; Hildreth and Moorbath, 1988; Annen et al., 2006).


 Show in context