The effect of warming climate on nutrient and solute export from the Greenland Ice Sheet
Affiliations | Corresponding Author | Cite asKeywords: glaciers, Greenland Ice Sheet, chemical weathering, nutrient export, nutrient cycling, silica, phosphorus, nitrogen, climate change
- Share this article


-
Article views:13,412Cumulative count of HTML views and PDF downloads.
- Download Citation
- Rights & Permissions
Abstract
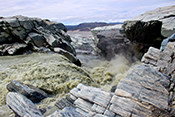
Figures and Tables
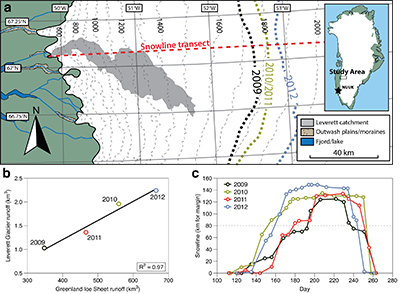 Figure 1 Field site and basic hydrological data. (a) Leverett Glacier with the snowline transect used to determine the point where snow covers the ice surface, derived from MODIS imagery. Dashed lines represent elevation contours. The catchment area was determined from a surface digitial elevation model (Palmer et al., 2011). (b) Leverett Glacier meltwater discharge (Table 1) versus modelled Greenland Ice Sheet runoff (Tedesco et al., 2013). (c) Leverett Glacier snowline; open circles represent observed position; connecting lines are linear estimates of retreat, interpolated between the measurements. Estimated catchment extent is represented by the dotted line at ~80 km. |  Table 1 Flux and hydrological data. | 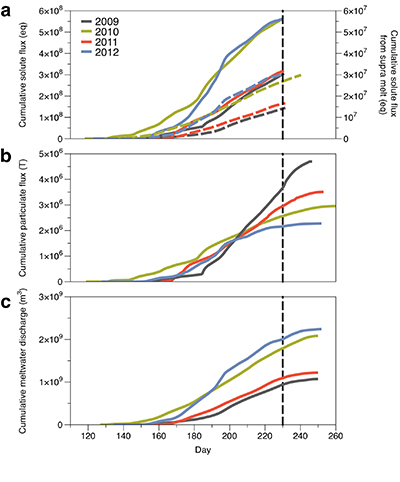 Figure 2 Cumulative solute and sediment flux. (a) Solid lines show solute flux (Ca2+, Mg2+, K+, Na+, Cl-, SO4-, HCO3-); dashed lines represent the estimated portion originating from supraglacial meltwater (right axis). (b) Cumulative particle borne flux. (c) Cumulative meltwater discharge. Day 230 (dashed line) was the limit of the dataset interpretation. Values at the dashed line correspond to data presented in Table 1 and Figure 1b. | 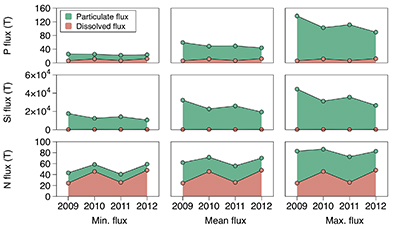 Figure 3 Estimated nutrient flux. Minimum (left column), mean (middle) and maximum (right) possible values give an impression of the range for phosphate, silicate and nitrogen compounds. Dissolved flux was determined using the electrical conductivity correlation. |
| Figure 1 | Table 1 | Figure 2 | Figure 3 |
Supplementary Figures and Tables
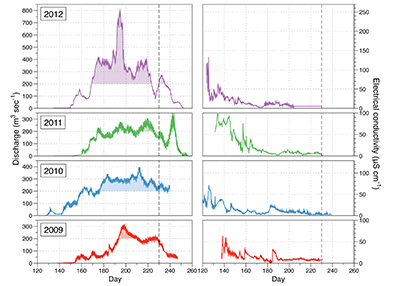 Figure S-1 Leverett Glacier discharge hydrographs and electrical conductivity. Shaded areas in the discharge plots show when discharge exceeded 200 m3 sec-1. The dashed line represents the cut off date used for flux estimates. | 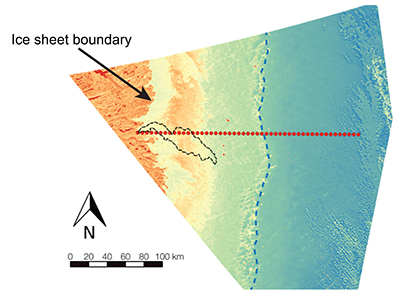 Figure S-2 An example of the MODIS satellite imagery used to determine snowline extent. Data are from surface reflectance bands 1-2 (Product Number MOD09GQ). Leverett Glacier moves from east to west. The estimated catchment area is outlined in black (Palmer et al., 2011) and the snowline transect is displayed by the red dotted line (space between each dot = 5 km). False colour imaging differentiates between snow (dark blue) and ice (light blue). The margin of the ice sheet is evident at the border of the red colouring (black arrow). The blue dashed line represents the interpreted position of the snowline. The image displayed is from 21 July 2012. Fig. 1a provides more information about the catchment. | 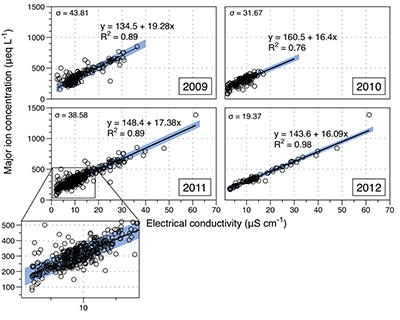 Figure S-3 Regression plots for major ions as a function of electrical conductivity. Shaded blue lines represent the standard error (σ, also written in the top left of plots). The 2011 regression plot (bottom left), which encompasess data from 2009, 2010 and 2012, is magnified to demonstrate the linear relationship of electrical conductivity with major ions in the dilute waters. | 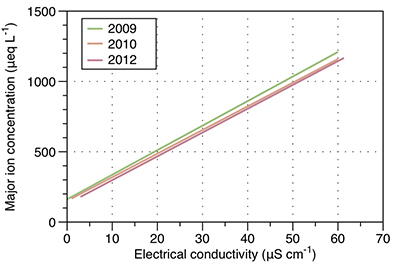 Figure S-4 Comparison of regression plots for the major ions for 2009, 2010 and 2012, where data are available. The differences in the regression equations used to determine major ion concentrations are very small. | 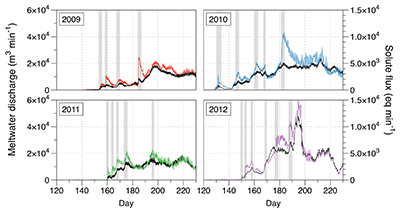 Figure S-5 Temporal variation in meltwater discharge and estimated solute flux. Coloured lines indicate solute flux calculated by the EC based method (eq min-1), and black lines, meltwater discharge (m3 min-1), during the 2009-2012 melt seasons. Shaded areas correspond to meltwater pulse events. These are associated with spring events, i.e. the annual opening of the subglacial drainage system, or rapid drainage of meltwater from supraglacial lake drainage events. These meltwater pulses flush concentrated waters from the subglacial drainage system (Bartholemew et al., 2011 and Hawkings et al., 2014). | 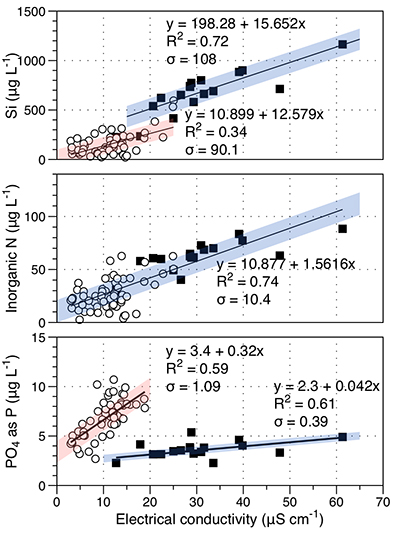 Figure S-6 Regression plots for nutrient concentrations as a function electrical conductivity. The regression plots for Si and PO43- represent early (blue) versus later season (red) hydrological and associated biogeochemical changes. Early season regressions are applied to time points before Day 153 in 2009, Day 128 in 2010, Day 160 in 2011 and Day 150 in 2012, which are before the initial change in drainage hydrology occurred, i.e. the spring event (Figs S-1 and S-5). Shaded areas show associated standard error. |
| Figure S-1 | Figure S-2 | Figure S-3 | Figure S-4 | Figure S-5 | Figure S-6 |
top
Introduction
Recent estimates predict global mean surface warming of up to 4.8 °C above the 1986-2005 mean by 2100, with the polar regions subject to more extreme increases (Collins et al., 2013
Collins, M., Knutti, R., Arblaster, J., Dufresne, J.-L., Fichefet, T., Friedlingstein, P., Gao, X., Gutowski, W.J., Johns, T., Krinner, G., Shongwe, M., Tebaldi, C., Weaver, A.J., Wehner, M. (2013) Long-term Climate Change: Projections, Commitments and Irreversibility. In: Stocker, T.F., Qin, D., Plattner, G.-K., Tignor, M., Allen, S.K., Boschung, J., Nauels, A., Xia, Y., Box, V., Midgley, P.M. (Eds.) Climate Change 2013: The Physical Science Basis. Contributions of Working Group I to the Fifth Assessment Report of the Intergovernmental Panel on Climate Change. Cambridge University Pess, Cambridge, UK and New York, NY, USA.
). Already, the Greenland Ice Sheet has experienced increased surface temperatures, with the five highest melt seasons on record occurring since 2000 (Tedesco et al., 2013Tedesco, M., Fettweis, X., Mote, T., Wahr, J., Alexander, P., Box, J.E., Wouters, B. (2013) Evidence and analysis of 2012 Greenland records from spaceborne observations, a regional climate model and reanalysis data. Cryosphere 7, 615-630.
). In 2012, surface melting was the most widespread in over 100 years (Tedesco et al., 2013Tedesco, M., Fettweis, X., Mote, T., Wahr, J., Alexander, P., Box, J.E., Wouters, B. (2013) Evidence and analysis of 2012 Greenland records from spaceborne observations, a regional climate model and reanalysis data. Cryosphere 7, 615-630.
). By 2100, the annual freshwater flux from the Greenland Ice Sheet could exceed 1000 km3 a-1, making it one of the world’s largest sources of freshwater (Fettweis et al., 2013Fettweis, X., Franco, B., Tedesco, M., van Angelen, J.H., Lenaerts, J.T.M., van den Broeke, M.R., Gallee, H. (2013) Estimating the Greenland ice sheet surface mass balance contribution to future sea level rise using the regional atmospheric climate model MAR. Cryosphere 7, 469-489.
).Currently, we lack information about the impact of meltwater on downstream biogeochemical cycles, even though the coastal waters surrounding the ice sheet harbour highly productive ecosystems, that are strong CO2 sinks (Rysgaard et al., 2012
Rysgaard, S., Mortensen, J., Juul-Pedersen, T., Sørensen, L.L., Lennert, K., Søgaard, D.H., Arendt, K.E., Blicher, M.E., Sejr, M.K., Bendtsen, J. (2012) High air–sea CO2 uptake rates in nearshore and shelf areas of Southern Greenland: Temporal and spatial variability. Marine Chemistry 128–129, 26-33.
). Recent work has highlighted the importance of glacier meltwater, including delivery of essential nutrients to the polar oceans (Bhatia et al., 2013Bhatia, M.P., Kujawinski, E.B., Das, S.B., Breier, C.F., Henderson, P.B., Charette, M.A. (2013) Greenland meltwater as a significant and potentially bioavailable source of iron to the ocean. Nature Geoscience 6, 274-278.
; Wadham et al., 2013Wadham, J., De'ath, R., Monteiro, F.M., Tranter, M., Ridgwell, A., Raiswell, R., Tulaczyk, S. (2013) The potential role of the Antarctic Ice Sheet in global biogeochemical cycles. Earth and Environmental Science Transactions of the Royal Society of Edinburgh 104, 55-67.
; Hawkings et al., 2014Hawkings, J.R., Wadham, J.L., Tranter, M., Raiswell, R., Benning, L.G., Statham, P.J., Tedstone, A., Nienow, P., Lee, K., Telling, J. (2014) Ice sheets as a significant source of highly reactive nanoparticulate iron to the oceans. Nature Communications 5.
; Lawson et al., 2014Lawson, E.C., Bhatia, M.P., Wadham, J.L., Kujawinski, E.B. (2014) Continuous summer export of nitrogen-rich organic matter from the Greenland Ice Sheet inferred by ultra high resolution mass spectrometry. Environmental Science & Technology 48, 14248-14257.
). However, whether glacier melting provides an important negative climate feedback through its effect on marine primary production and CO2 drawdown remains unknown.Future changes to Greenland Ice Sheet hydrology will probably impact the export of solute and reactive sediments to the polar oceans. Much of the meltwater drains from the surface to the ice sheet bed, chemically weathering the subglacial sediments (Bartholomew et al., 2011
Bartholomew, I., Nienow, P., Sole, A., Mair, D., Cowton, T., Palmer, S., Wadham, J. (2011) Supraglacial forcing of subglacial drainage in the ablation zone of the Greenland ice sheet. Geophysical Research Letters 38, L08502.
). Supraglacial lake drainage events are particularly important because they rapidly channel large quantities of meltwater to the ice sheet bed, flushing out stored, solute-rich, subglacial waters (Bartholomew et al., 2011Bartholomew, I., Nienow, P., Sole, A., Mair, D., Cowton, T., Palmer, S., Wadham, J. (2011) Supraglacial forcing of subglacial drainage in the ablation zone of the Greenland ice sheet. Geophysical Research Letters 38, L08502.
; Hawkings et al., 2014Hawkings, J.R., Wadham, J.L., Tranter, M., Raiswell, R., Benning, L.G., Statham, P.J., Tedstone, A., Nienow, P., Lee, K., Telling, J. (2014) Ice sheets as a significant source of highly reactive nanoparticulate iron to the oceans. Nature Communications 5.
). Supraglacial lake formation and the migration of drainage systems inland in a warming climate (Leeson et al., 2015Leeson, A.A., Shepherd, A., Briggs, K., Howat, I., Fettweis, X., Morlighem, M., Rignot, E. (2015) Supraglacial lakes on the Greenland ice sheet advance inland under warming climate. Nature Climate Change 5, 51-55.
) could expose new subglacial areas to meltwater flushing, potentially enhancing solute evacuation. Glaciers are effective at fracturing and grinding bedrock (Cowton et al., 2012Cowton, T., Nienow, P., Bartholomew, I., Sole, A., Mair, D. (2012) Rapid erosion beneath the Greenland ice sheet. Geology 40, 343-346.
), producing turbid meltwaters with abundant, very fine suspended particles, i.e. >1 g L-1 (Cowton et al., 2012Cowton, T., Nienow, P., Bartholomew, I., Sole, A., Mair, D. (2012) Rapid erosion beneath the Greenland ice sheet. Geology 40, 343-346.
). Suspended material has recently been identified as a potential source of labile nutrients to near coastal regions (Hodson et al., 2004Hodson, A.J., Mumford, P., Lister, D. (2004) Suspended sediment and phosphorus in proglacial rivers: bioavailability and potential impacts upon the P status of ice-marginal receiving waters. Hydrological Processes 18, 2409-2422.
; Bhatia et al., 2013Bhatia, M.P., Kujawinski, E.B., Das, S.B., Breier, C.F., Henderson, P.B., Charette, M.A. (2013) Greenland meltwater as a significant and potentially bioavailable source of iron to the ocean. Nature Geoscience 6, 274-278.
; Hawkings et al., 2014Hawkings, J.R., Wadham, J.L., Tranter, M., Raiswell, R., Benning, L.G., Statham, P.J., Tedstone, A., Nienow, P., Lee, K., Telling, J. (2014) Ice sheets as a significant source of highly reactive nanoparticulate iron to the oceans. Nature Communications 5.
; Wehrmann et al., 2014Wehrmann, L.M., Formolo, M.J., Owens, J.D., Raiswell, R., Ferdelman, T.G., Riedinger, N., Lyons, T.W. (2014) Iron and manganese speciation and cycling in glacially influenced high-latitude fjord sediments (West Spitsbergen, Svalbard): Evidence for a benthic recycling-transport mechanism. Geochimica et Cosmochimica Acta 141, 628-655.
) but data are sparse.In this study, we present a full suite of geochemical and hydrological data from Leverett Glacier, a large (~600 km2), land terminating, outlet glacier of the Greenland Ice Sheet (details in Supplementary Information). The data cover four years (2009-2012) where melting intensity varied (Fig. 1), including the two highest melt seasons on record. This is the most comprehensive dataset yet on major ion and nutrient concentrations from a glacial system.

Figure 1 Field site and basic hydrological data. (a) Leverett Glacier with the snowline transect used to determine the point where snow covers the ice surface, derived from MODIS imagery. Dashed lines represent elevation contours. The catchment area was determined from a surface digitial elevation model (Palmer et al., 2011
Palmer, S., Shepherd, A., Nienow, P., Joughin, I. (2011) Seasonal speedup of the Greenland Ice Sheet linked to routing of surface water. Earth and Planetary Science Letters 302, 423-428.
). (b) Leverett Glacier meltwater discharge (Table 1) versus modelled Greenland Ice Sheet runoff (Tedesco et al., 2013Tedesco, M., Fettweis, X., Mote, T., Wahr, J., Alexander, P., Box, J.E., Wouters, B. (2013) Evidence and analysis of 2012 Greenland records from spaceborne observations, a regional climate model and reanalysis data. Cryosphere 7, 615-630.
). (c) Leverett Glacier snowline; open circles represent observed position; connecting lines are linear estimates of retreat, interpolated between the measurements. Estimated catchment extent is represented by the dotted line at ~80 km.top
Results and Discussion
Hydrological data (discharge, electrical conductivity and suspended material concentration) were collected for all four years (2009-2012) at a stable bedrock section ~2.2 km downstream of the glacier mouth. Major ion data are available for 2009, 2010 and 2012 and we used them to interpolate concentrations for 2011. Nutrient flux for 2009, 2010 and 2011 was estimated from 2012 data using a correlation with electrical conductivity. Further details are provided below and in Supplementary Information.
Hydrology
The 2010 and 2012 ablation seasons produced the largest volumes of meltwater on record (Tedesco et al., 2013
Tedesco, M., Fettweis, X., Mote, T., Wahr, J., Alexander, P., Box, J.E., Wouters, B. (2013) Evidence and analysis of 2012 Greenland records from spaceborne observations, a regional climate model and reanalysis data. Cryosphere 7, 615-630.
). This is reflected in Leverett Glacier discharge (Fig. S-1), which was proportional to annual ice sheet runoff (R2 = 0.97; Fig. 1b). The snowline also reached maximum elevation in 2012, 14 km further inland than in 2010 and 2011 (Table 1; Fig. 1c). 2009 and 2011 can be considered "average" melt years, with discharge proportional to the mean meltwater flux over the past decade. 2010 and 2012, with significantly above average discharge, were "extreme" melt years. This characterisation provides a benchmark for evaluating future trends because the frequency of extreme seasons is likely to increase (Fettweis et al., 2013Fettweis, X., Franco, B., Tedesco, M., van Angelen, J.H., Lenaerts, J.T.M., van den Broeke, M.R., Gallee, H. (2013) Estimating the Greenland ice sheet surface mass balance contribution to future sea level rise using the regional atmospheric climate model MAR. Cryosphere 7, 469-489.
).Table 1 Flux and hydrological data.
| Year | |||||
| Units | 2009 | 2010 | 2011 | 2012 | |
| Greenland Ice Sheet runoff * | km3 | 348 | 559 | 466 | 665 |
| Leverett Glacier discharge | km3 | 0.94 | 1.79 | 1.1 | 2.03 |
| Snowline above catchment | est. days | 45 | 100 | 73 | 85 |
| Snowline retreat from margin | km | 125 | 135 | 135 | 149 |
| Solute Flux | eq | 3.0 × 10⁸ | 5.6 × 10⁸ | 3.2 × 10⁸ | 5.6 × 10⁸ |
| Sediment Flux | t | 3.7× 10⁶ | 2.6 × 10⁶ | 3.0 × 10⁶ | 2.2 × 10⁶ |
| Dissolved inorganic nitrogen † | t | 25 | 46 | 26 | 48 |
| Dissolved silica † | t | 130 | 230 | 120 | 230 |
| Dissolved inorganic phosphorus† | t | 6.2 | 12 | 6.7 | 12 |
| Dissolved inorganic nitrogen ‡ | t | 22 | 41 | 25 | 47 |
| Dissolved silica ‡ | t | 110 | 220 | 130 | 240 |
| Dissolved inorganic phosphorus‡ | t | 7.8 | 15 | 8.9 | 16 |
| Exchangeable NH4** | t | 19-58 | 13-41 | 15-47 | 11-35 |
| Amorphous silica** | t | 18.000-44.000 | 12.000-31.000 | 14.000-36.000 | 11.000-26.000 |
| NaOH extractable phosphorus** | t | 20-130 | 14-92 | 16-110 | 12-78 |
All estimates are shown to Decimal Day 230/231, i.e. 17 August.
Estimates are reported with 2 significant digits.
eq = molar equivalent
t = tons of dry element
Snowline: the boundary where snow covers the underlying ice. Down glacier from this point is exposed ice, where the snow cover has melted.
* Greenland Ice Sheet runoff estimates from Tedesco et al. (2013)Tedesco, M., Fettweis, X., Mote, T., Wahr, J., Alexander, P., Box, J.E., Wouters, B. (2013) Evidence and analysis of 2012 Greenland records from spaceborne observations, a regional climate model and reanalysis data. Cryosphere 7, 615-630..
** Sediment fluxes given as range based on minimum and maximum extractable nutrient concentrations.
† Fluxes estimated with electrical conductivity.
‡ Fluxes estimated using discharge weighted mean.
We estimated total solute export for all years from the electrical conductivity (EC) of the meltwater (Fig. S-3). The major ion (Ca2+, Mg2+, K+, Na+, Cl-, SO42-, HCO3-) concentrations are a linear function of conductivity with R2 = 0.87 (2009), 0.77 (2010) and 0.98 (2012) (Figs. S-3 and S-4). We have a full hydrological dataset (discharge, EC and suspended material) from 2011 but major ion data are missing so using the concentration-conductivity correlation for data from 2009, 2010 and 2012 (n = 368; R2 = 0.89), we estimated 2011 solute concentrations (Fig. S-3). Solute flux was estimated by cumulatively summing the total solute concentration at each conductivity measurement time step (Fig. 2). We differentiated supraglacial solute from the total solute flux to assess the importance of subglacial sources (Fig. 2a). The estimates suggest that flushing of stored subglacial waters and rapid weathering of subglacial sediments by dilute supraglacial meltwater account for >95 % of the solute export from the catchment.
A key discovery is that solute flux during the two extreme melt years was ~90 % higher than for the average years, indicating that solute export scales with discharge. Thus, it is likely that increased melting will increase solute fluxes from the Greenland Ice Sheet. Most of the solute is delivered during peak melt periods during the ablation season (Fig. S-5). Solute pulses are also released during supraglacial lake drainage events (Fig. S-5; Bartholomew et al., 2011
Bartholomew, I., Nienow, P., Sole, A., Mair, D., Cowton, T., Palmer, S., Wadham, J. (2011) Supraglacial forcing of subglacial drainage in the ablation zone of the Greenland ice sheet. Geophysical Research Letters 38, L08502.
). Enhanced solute discharge during extreme years likely results from i) drainage of concentrated subglacial waters stored in poorly connected regions, e.g., deeper into the ice sheet, ii) higher flushing rates and iii) rapid weathering of reactive subglacial sediments by large volumes of supraglacial meltwater. We next ascertain if nutrient fluxes follow the same trend.
Figure 2 Cumulative solute and sediment flux. (a) Solid lines show solute flux (Ca2+, Mg2+, K+, Na+, Cl-, SO42-, HCO3-); dashed lines represent the estimated portion originating from supraglacial meltwater (right axis). (b) Cumulative particle borne flux. (c) Cumulative meltwater discharge. Day 230 (dashed line) was the limit of the dataset interpretation. Values at the dashed line correspond to data presented in Table 1 and Figure 1b.
Dissolved nutrient fluxes
Nutrient fluxes for all years were estimated from the 2012 dataset, the only complete macronutrient record available. For the most common, namely NH4+, NO3-, Si and PO43-, we also estimated annual flux by correlation with conductivity, as for major ion concentrations. This is justified by the good correlation of conductivity with nutrient concentrations (Fig. S-6). If the function holds for 2012, we assume it also holds for the other years. Si and P are released during rock weathering and dissolved inorganic nitrogen is also enhanced by subglacial biogeochemical processes, such as microbially mediated nitrification (NO3-) and mineralisation of organic matter (NH4-; Wynn et al., 2007
Wynn, P.M., Hodson, A.J., Heaton, T.H.E., Chenery, S.R. (2007) Nitrate production beneath a High Arctic Glacier, Svalbard. Chemical Geology 244, 88-102.
). For example, mean nitrogen concentrations attributable to subglacial processes (~1 μM) are similar to supraglacial processes (~1.3 μM). Nitrogen correlates linearly with conductivity (R2 = 0.74; Fig. S-6). To account for the seasonal evolution in meltwater composition, we used two regressions (Fig. S-6) for dissolved silica (R2 = 0.72 for early season and R2 = 0.34 for bulk season runoff), and phosphate (R2 = 0.61 and 0.59, respectively). We propose that these differences arise from the change in source of the subglacial water as the melt season progresses, i.e. close to ice margins early in the season to more isolated inland subglacial waters as the season progresses. The source influences the subglacial flowpath length, hence water residence times and pH/redox conditions.Higher dissolved nutrient flux correlates with higher discharge years. Inorganic nitrogen (86 % ± 9.8 %), dissolved silica (85 % ± 0.1 %) and phosphate (86 % ± 11.9 %) are higher in extreme melt years than for average years. This is significant and demonstrates the potential for nutrient release by a warming climate.
A different approach for estimating nutrient flux is to combine discharge weighted mean concentrations and total discharge flux (Hawkings et al., 2014
Hawkings, J.R., Wadham, J.L., Tranter, M., Raiswell, R., Benning, L.G., Statham, P.J., Tedstone, A., Nienow, P., Lee, K., Telling, J. (2014) Ice sheets as a significant source of highly reactive nanoparticulate iron to the oceans. Nature Communications 5.
). Estimates from this method and the EC-based method are similar (Table 1). The weighted mean dissolved nitrogen and silica fluxes were marginally lower (~7 % and ~5 %) and phosphate flux was higher (~23 %), probably because of late melt season influence, when phosphate concentrations were high and where the bulk of the discharge occurred.An important assumption is that the correlation of nutrient concentration with conductivity is consistent over the years. We have a limited dataset for NO3- and Si from 2009. Results are sparse so estimates are crude but they serve as a benchmark for comparison. Flux derived from 2009 data for NO3-N is 12 tons, compared with 15 tons estimated using 2012 data. Flux for dissolved Si is 180 tons, compared with 130 tons estimated using 2012 measurements (Table 1). Both are well within an order of magnitude, which offers confidence that our estimates from 2012 data are reasonable.
Nutrient flux on particles
Glaciers effectively fracture and grind bedrock into high surface area, highly reactive, clay and silt sized particles, some of which are transported in runoff as suspended material (Gurnell and Clark, 1987
Gurnell, A.M., Clark, M.J. (1987) Glacio-fluvial sediment transfer: An Alpine Perspective. Wiley & Sons, Chichester.
; Brown et al., 1996Brown, G.H., Tranter, M., Sharp, M.J. (1996) Experimental investigations of the weathering of suspended sediment by Alpine glacial meltwater. Hydrological Processes 10, 579-597.
). By using data derived from the labile nutrients in the 2012 suspended material (n > 25), we estimated the range of nutrient concentrations associated with the particulate fraction (Table 1; Fig. 3). We assumed that the 2009-2011 mean extractable nutrient concentrations lie within the 2012 minimum and maximum concentrations, which is reasonable because the runoff comes from the same catchment and the mineral composition is relatively constant (Hawkings et al., 2014Hawkings, J.R., Wadham, J.L., Tranter, M., Raiswell, R., Benning, L.G., Statham, P.J., Tedstone, A., Nienow, P., Lee, K., Telling, J. (2014) Ice sheets as a significant source of highly reactive nanoparticulate iron to the oceans. Nature Communications 5.
).
Figure 3 Estimated nutrient flux. Minimum (left column), mean (middle) and maximum (right) possible values give an impression of the range for phosphate, silicate and nitrogen compounds. Dissolved flux was determined using the electrical conductivity correlation.
Particulate bound nutrients account for a large portion of the estimated nutrient flux (Table 1; Fig. 3), which is significant in all years. The particulate transported fraction correlates with the nutrient source (lithogenic or atmospheric) and the tendency for the ion to complex. Nutrients derived directly from rocks associate more with solids, i.e. for Si, >99 % and for P, ~80 % of the total flux. Nitrogen, which has a supraglacial component, is transported less on solids, i.e. <50 %. Our results are consistent with the low solubility of Si and the high affinity for P absorption onto solids, such as iron (oxyhyd)roxides. Ammonium is only weakly absorbed and nitrate remains preferentially in solution. This suggests that annual nitrogen flux is more sensitive to changes in ice sheet water discharge than particle flux.
We have demonstrated that, as in riverine systems (Mayer et al., 1998
Mayer, L.M., Keil, R.G., Macko, S.A., Joye, S.B., Ruttenberg, K.C., Aller, R.C. (1998) Importance of suspended particulates in riverine delivery of bioavailable nitrogen to coastal zones. Global Biogeochemical Cycles 12, 573-579.
; Ruttenberg, 2014Ruttenberg, K. (2014) The global phosphorus cycle. Treatise on Geochemistry 8, 499-558.
), a high fraction of ice sheet nutrient export is associated with suspended material. This is consistent with previous research from Arctic glaciers (Hodson et al., 2004Hodson, A.J., Mumford, P., Lister, D. (2004) Suspended sediment and phosphorus in proglacial rivers: bioavailability and potential impacts upon the P status of ice-marginal receiving waters. Hydrological Processes 18, 2409-2422.
) and supports recent assertions that the impact of terrigeneous material on the oceans is underestimated in global element cycling (Jeandel and Oelkers, 2015Jeandel, C., Oelkers, E.H. (2015) The influence of terrigenous particulate material dissolution on ocean chemistry and global element cycles. Chemical Geology 395, 50-66.
). Our results underline the need for more information about ice sheet sediment flux dynamics. As in previous studies, we observed highly variable annual sediment fluxes, which do not correlate well with discharge on a catchment basis (Fig. 2; Gurnell and Clark, 1987Gurnell, A.M., Clark, M.J. (1987) Glacio-fluvial sediment transfer: An Alpine Perspective. Wiley & Sons, Chichester.
). Sediment flux might be less influenced by total meltwater discharge and more sensitive to meltwater access to fresh, subglacial sediment sources (Cowton et al., 2012Cowton, T., Nienow, P., Bartholomew, I., Sole, A., Mair, D. (2012) Rapid erosion beneath the Greenland ice sheet. Geology 40, 343-346.
). However, evidence from past deglaciation events indicates that climate warming increases sediment export (Jeandel and Oelkers, 2015Jeandel, C., Oelkers, E.H. (2015) The influence of terrigenous particulate material dissolution on ocean chemistry and global element cycles. Chemical Geology 395, 50-66.
) and analysis of sediment plumes from meltwater rivers demonstrates a higher sediment flux in recent years (Hudson et al., 2014Hudson, B., Overeem, I., McGrath, D., Syvitski, J.P.M., Mikkelsen, A., Hasholt, B. (2014) MODIS observed increase in duration and spatial extent of sediment plumes in Greenland fjords. The Cryosphere 8, 1161-1176.
).The extent of biological consumption of the nutrients bound to particles before deposition and subsequent burial is unknown. Particulates from meltwater are extremely fine, e.g., >95 % of particles can be <32 μm in size (Brown et al., 1996
Brown, G.H., Tranter, M., Sharp, M.J. (1996) Experimental investigations of the weathering of suspended sediment by Alpine glacial meltwater. Hydrological Processes 10, 579-597.
), so surface area is high and nutrient transport in the buoyant, fresh water plumes in near coastal regions is likely to be significant. Evidence from recent polar studies shows that particle borne nutrients are carried far offshore (Schroth et al., 2014Schroth, A.W., Crusius, J., Hoyer, I., Campbell, R. (2014) Estuarine removal of glacial iron and implications for iron fluxes to the ocean. Geophysical Research Letters 41, 3951-3958.
; Wehrmann et al., 2014Wehrmann, L.M., Formolo, M.J., Owens, J.D., Raiswell, R., Ferdelman, T.G., Riedinger, N., Lyons, T.W. (2014) Iron and manganese speciation and cycling in glacially influenced high-latitude fjord sediments (West Spitsbergen, Svalbard): Evidence for a benthic recycling-transport mechanism. Geochimica et Cosmochimica Acta 141, 628-655.
) and nutrients deposited with glacial sediments in fjords can be resuspended in the water column (Wehrmann et al., 2014Wehrmann, L.M., Formolo, M.J., Owens, J.D., Raiswell, R., Ferdelman, T.G., Riedinger, N., Lyons, T.W. (2014) Iron and manganese speciation and cycling in glacially influenced high-latitude fjord sediments (West Spitsbergen, Svalbard): Evidence for a benthic recycling-transport mechanism. Geochimica et Cosmochimica Acta 141, 628-655.
). However, the scarcity of data means that the contribution of particle bound nutrients on oceanic productivity near Greenland remains uncertain.Terrestrial and marine studies have shown that large fractions (75-95 %) of amorphous Si can be dissolved and recycled (Treguer et al., 1995
Treguer, P., Nelson, D.M., Vanbennekom, A.J., Demaster, D.J., Leynaert, A., Queguiner, B. (1995) The silica balance in the world ocean - a reestimate. Science 268, 375-379.
; Gibson et al., 2000Gibson, C.E., Wang, G., Foy, R.H. (2000) Silica and diatom growth in Lough Neagh: the importance of internal recycling. Freshwater Biology 45, 285-293.
). Amorphous Si is an order of magnitude more soluble in saline solutions than in fresh water (Icenhower and Dove, 2000Icenhower, J.P., Dove, P.M. (2000) The dissolution kinetics of amorphous silica into sodium chloride solutions: Effects of temperature and ionic strength. Geochimica et Cosmochimica Acta 64, 4193-4203.
; Loucaides et al., 2008Loucaides, S., Van Cappellen, P., Behrends, T. (2008) Dissolution of biogenic silica from land to ocean: Role of salinity and pH. Limnology and Oceanography 53, 1614-1621.
) and recycling is favoured in estuaries (Loucaides et al., 2008Loucaides, S., Van Cappellen, P., Behrends, T. (2008) Dissolution of biogenic silica from land to ocean: Role of salinity and pH. Limnology and Oceanography 53, 1614-1621.
). NaOH extractable phosphate is commonly termed “algae available” (DePinto et al., 1981DePinto, J.V., Young, T.C., Martin, S.C. (1981) Algal-available phosphorus in suspended sediments from Lower Great Lakes Tributaries. Journal of Great Lakes Research 7, 311-325.
) and its bioavailability has previously been demonstrated (Bostrom et al., 1988Bostrom, B., Persson, G., Broberg, B. (1988) Bioavailability of different phosphorus forms in freshwater systems. Hydrobiologia 170, 133-155.
). High salinity in ocean and fjord waters also favours P and NH4 desorption (Gardner et al., 1991Gardner, W., Seitzinger, S., Malczyk, J. (1991) The effects of sea salts on the forms of nitrogen released from estuarine and freshwater sediments: Does ion pairing affect ammonium flux? Estuaries 14, 157-166.
; Hodson et al., 2004Hodson, A.J., Mumford, P., Lister, D. (2004) Suspended sediment and phosphorus in proglacial rivers: bioavailability and potential impacts upon the P status of ice-marginal receiving waters. Hydrological Processes 18, 2409-2422.
; Zhang and Huang, 2011Zhang, J.Z., Huang, X.L. (2011) Effect of temperature and salinity on phosphate sorption on marine sediments. Environmental Science & Technology 45, 6831-6837.
), enhancing their bioavailability. Thus, annual sediment flux is an important factor in downstream productivity.top
Conclusions
Changes in the hydrological output from the Greenland Ice Sheet in a warming climate could have significant effect on solute and nutrient delivery to near coastal regions. Our data, from Leverett Glacier, a large representative ice sheet catchment, indicate that bulk solute and dissolved nutrient fluxes will increase as “extreme” melt year frequency increases. A significant fraction of nutrients, especially silica and phosphorous, will be transported by suspended particles. The extent of their influence depends on desorption before burial, bioavailability and change in the ice sheet particulate flux, which are currently uncertain. Our study demonstrates that retreating snowline and higher meltwater input into less efficiently drained subglacial regions are likely to increase the dissolved macronutrient flux. Particle bound nutrients have been largely overlooked but contribute significant mass to nutrient cycling. Increased warming, thus increased meltwater runoff, will likely impact regional nutrient availability, and thus, the carbon cycle.
top
Acknowledgements
This research was part of the UK Natural Environment Research Council Project, DELVE (NERC grant NE/I008845/1) and the associated PhD studentship to JH. EL, AT, TC and IB were funded by NERC studentships and a MOSS scholarship. PN was supported by the Carnegie Trust for The University of Scotland and The University of Edinburgh Development Trust. Additional support was provided by the Leverhulme Trust, in a research fellowship to JLW. We thank all of those who assisted with fieldwork at Leverett Glacier and the technical staff in LOWTEX labs, School of Geographical Sciences, University of Bristol. We are grateful to our anonymous reviewers for constructive comments on the manuscript.
Editor: Susan S.L. Stipp
top
Author Contributions
All authors contributed. JLW and MT conceived the project. JRH, EL, AS, TC, IB, AT, PN, DC and JLW collected field data. JRH, JRH, EL and JT undertook the lab analysis. JRH, JLW and MT wrote the paper.
top
References
Bartholomew, I., Nienow, P., Sole, A., Mair, D., Cowton, T., Palmer, S., Wadham, J. (2011) Supraglacial forcing of subglacial drainage in the ablation zone of the Greenland ice sheet. Geophysical Research Letters 38, L08502.
 Show in context
 Much of the meltwater drains from the surface to the ice sheet bed, chemically weathering the subglacial sediments (Bartholomew et al., 2011)
View in article
Supraglacial lake drainage events are particularly important because they rapidly channel large quantities of meltwater to the ice sheet bed, flushing out stored, solute rich, subglacial waters (Bartholomew et al., 2011; Hawkings et al., 2014).
View in article
Solute pulses are also released during supraglacial lake drainage events (Fig. S-5; Bartholomew et al., 2011).
View in article
Bhatia, M.P., Kujawinski, E.B., Das, S.B., Breier, C.F., Henderson, P.B., Charette, M.A. (2013) Greenland meltwater as a significant and potentially bioavailable source of iron to the ocean. Nature Geoscience 6, 274-278.
 Show in context
 Recent work has highlighted the importance of glacier meltwater, including delivery of essential nutrients to the polar oceans (Bhatia et al., 2013; Wadham et al., 2013; Hawkings et al., 2014; Lawson et al., 2014).
View in article
Suspended material has recently been identified as a potential source of labile nutrients to near coastal regions (Hodson et al., 2004; Bhatia et al., 2013; Hawkings et al., 2014; Wehrmann et al., 2014) but data are sparse.
View in article
Bostrom, B., Persson, G., Broberg, B. (1988) Bioavailability of different phosphorus forms in freshwater systems. Hydrobiologia 170, 133-155.
 Show in context
 NaOH extractable phosphate is commonly termed “algae available” (DePinto et al., 1981) and its bioavailability has previously been demonstrated (Bostrom et al., 1988).
View in article
Brown, G.H., Tranter, M., Sharp, M.J. (1996) Experimental investigations of the weathering of suspended sediment by Alpine glacial meltwater. Hydrological Processes 10, 579-597.
 Show in context
 Glaciers effectively fracture and grind bedrock into high surface area, highly reactive, clay and silt sized particles, some of which are transported in runoff as suspended material (Gurnell and Clark, 1987; Brown et al., 1996).
View in article
Particulates from meltwater are extremely fine, e.g., >95 % of particles can be <32 μm in size (Brown et al., 1996), so surface area is high and nutrient transport in the buoyant, fresh water plumes in near coastal regions is likely to be significant.
View in article
Collins, M., Knutti, R., Arblaster, J., Dufresne, J.-L., Fichefet, T., Friedlingstein, P., Gao, X., Gutowski, W.J., Johns, T., Krinner, G., Shongwe, M., Tebaldi, C., Weaver, A.J., Wehner, M. (2013) Long-term Climate Change: Projections, Commitments and Irreversibility. In: Stocker, T.F., Qin, D., Plattner, G.-K., Tignor, M., Allen, S.K., Boschung, J., Nauels, A., Xia, Y., Box, V., Midgley, P.M. (Eds.) Climate Change 2013: The Physical Science Basis. Contributions of Working Group I to the Fifth Assessment Report of the Intergovernmental Panel on Climate Change. Cambridge University Pess, Cambridge, UK and New York, NY, USA.
 Show in context
 Recent estimates predict global mean surface warming of up to 4.8 °C above the 1986-2005 mean by 2100, with the polar regions subject to more extreme increases (Collins et al., 2013).
View in article
Cowton, T., Nienow, P., Bartholomew, I., Sole, A., Mair, D. (2012) Rapid erosion beneath the Greenland ice sheet. Geology 40, 343-346.
 Show in context
 Glaciers are effective at fracturing and grinding bedrock (Cowton et al., 2012), producing turbid meltwaters with abundant, very fine suspended particles, i.e. >1 g L-1 (Cowton et al., 2012).
View in article
Sediment flux might be less influenced by total meltwater discharge and more sensitive to meltwater access to fresh, subglacial sediment sources (Cowton et al., 2012).
View in article
DePinto, J.V., Young, T.C., Martin, S.C. (1981) Algal-available phosphorus in suspended sediments from Lower Great Lakes Tributaries. Journal of Great Lakes Research 7, 311-325.
 Show in context
 NaOH extractable phosphate is commonly termed “algae available” (DePinto et al., 1981) and its bioavailability has previously been demonstrated (Bostrom et al., 1988).
View in article
Fettweis, X., Franco, B., Tedesco, M., van Angelen, J.H., Lenaerts, J.T.M., van den Broeke, M.R., Gallee, H. (2013) Estimating the Greenland ice sheet surface mass balance contribution to future sea level rise using the regional atmospheric climate model MAR. Cryosphere 7, 469-489.
 Show in context
 By 2100, the annual freshwater flux from the Greenland Ice Sheet could exceed 1000 km3 a-1, making it one of the world’s largest sources of freshwater (Fettweis et al., 2013).
View in article
This characterisation provides a benchmark for evaluating future trends because the frequency of extreme seasons is likely to increase (Fettweis et al., 2013).
View in article
Gardner, W., Seitzinger, S., Malczyk, J. (1991) The effects of sea salts on the forms of nitrogen released from estuarine and freshwater sediments: Does ion pairing affect ammonium flux? Estuaries 14, 157-166.
 Show in context
 High salinity in ocean and fjord waters also favours P and NH4 desorption (Garner et al., 1991; Hodson et al., 2004; Zhang and Huang, 2011), enhancing their bioavailability.
View in article
Gibson, C.E., Wang, G., Foy, R.H. (2000) Silica and diatom growth in Lough Neagh: the importance of internal recycling. Freshwater Biology 45, 285-293.
 Show in context
 Terrestrial and marine studies have shown that large fractions (75-95 %) of amorphous Si can be dissolved and recycled (Treguer et al., 1995; Gibson et al., 2000).
View in article
Gurnell, A.M., Clark, M.J. (1987) Glacio-fluvial sediment transfer: An Alpine Perspective. Wiley & Sons, Chichester.
 Show in context
 Glaciers effectively fracture and grind bedrock into high surface area, highly reactive, clay and silt sized particles, some of which are transported in runoff as suspended material (Gurnell and Clark, 1987; Brown et al., 1996).
View in article
As in previous studies, we observed highly variable annual sediment fluxes, which do not correlate well with discharge on a catchment basis (Fig. 2; Gurnell and Clark, 1987).
View in article
Hawkings, J.R., Wadham, J.L., Tranter, M., Raiswell, R., Benning, L.G., Statham, P.J., Tedstone, A., Nienow, P., Lee, K., Telling, J. (2014) Ice sheets as a significant source of highly reactive nanoparticulate iron to the oceans. Nature Communications 5.
 Show in context
 Recent work has highlighted the importance of glacier meltwater, including delivery of essential nutrients to the polar oceans (Bhatia et al., 2013; Wadham et al., 2013; Hawkings et al., 2014; Lawson et al., 2014).
View in article
Supraglacial lake drainage events are particularly important because they rapidly channel large quantities of meltwater to the ice sheet bed, flushing out stored, solute rich, subglacial waters (Bartholomew et al., 2011; Hawkings et al., 2014).
View in article
Suspended material has recently been identified as a potential source of labile nutrients to near coastal regions (Hodson et al., 2004; Bhatia et al., 2013; Hawkings et al., 2014; Wehrmann et al., 2014) but data are sparse.
View in article
A different approach for estimating nutrient flux is to combine discharge weighted mean concentrations and total discharge flux (Hawkings et al., 2014).
View in article
We assumed that the 2009-2011 mean extractable nutrient concentrations lie within the 2012 minimum and maximum concentrations, which is reasonable because the runoff comes from the same catchment and the mineral composition is relatively constant (Hawkings et al., 2014).
View in article
Hodson, A.J., Mumford, P., Lister, D. (2004) Suspended sediment and phosphorus in proglacial rivers: bioavailability and potential impacts upon the P status of ice-marginal receiving waters. Hydrological Processes 18, 2409-2422.
 Show in context
Suspended material has recently been identified as a potential source of labile nutrients to near coastal regions (Hodson et al., 2004; Bhatia et al., 2013; Hawkings et al., 2014; Wehrmann et al., 2014) but data are sparse.
View in article
This is consistent with previous research from Arctic glaciers (Hodson et al., 2004) and supports recent assertions that the impact of terrigeneous material on the oceans is underestimated in global element cycling (Jeandel and Oelkers, 2015).
View in article
High salinity in ocean and fjord waters also favours P and NH4 desorption (Garner et al., 1991; Hodson et al., 2004; Zhang and Huang, 2011), enhancing their bioavailability.
View in article
Hudson, B., Overeem, I., McGrath, D., Syvitski, J.P.M., Mikkelsen, A., Hasholt, B. (2014) MODIS observed increase in duration and spatial extent of sediment plumes in Greenland fjords. The Cryosphere 8, 1161-1176.
 Show in context
 However, evidence from past deglaciation events indicates that climate warming increases sediment export (Jeandel and Oelkers, 2015) and analysis of sediment plumes from meltwater rivers demonstrates higher sediment flux in recent years (Hudson et al., 2014).
View in article
Icenhower, J.P., Dove, P.M. (2000) The dissolution kinetics of amorphous silica into sodium chloride solutions: Effects of temperature and ionic strength. Geochimica et Cosmochimica Acta 64, 4193-4203.
 Show in context
 Amorphous Si is an order of magnitude more soluble in saline solutions than in fresh water (Icenhower and Dove, 2000; Loucaides et al., 2008) and recycling is favoured in estuaries (Loucaides et al., 2008).
View in article
Jeandel, C., Oelkers, E.H. (2015) The influence of terrigenous particulate material dissolution on ocean chemistry and global element cycles. Chemical Geology 395, 50-66.
 Show in context
This is consistent with previous research from Arctic glaciers (Hodson et al., 2004) and supports recent assertions that the impact of terrigeneous material on the oceans is underestimated in global element cycling (Jeandel and Oelkers, 2015).
View in article
However, evidence from past deglaciation events indicates that climate warming increases sediment export (Jeandel and Oelkers, 2015) and analysis of sediment plumes from meltwater rivers demonstrates higher sediment flux in recent years (Hudson et al., 2014).
View in article
Lawson, E.C., Bhatia, M.P., Wadham, J.L., Kujawinski, E.B. (2014) Continuous summer export of nitrogen-rich organic matter from the Greenland Ice Sheet inferred by ultra high resolution mass spectrometry. Environmental Science & Technology 48, 14248-14257.
 Show in context
 Recent work has highlighted the importance of glacier meltwater, including delivery of essential nutrients to the polar oceans (Bhatia et al., 2013; Wadham et al., 2013; Hawkings et al., 2014; Lawson et al., 2014).
View in article
Leeson, A.A., Shepherd, A., Briggs, K., Howat, I., Fettweis, X., Morlighem, M., Rignot, E. (2015) Supraglacial lakes on the Greenland ice sheet advance inland under warming climate. Nature Climate Change 5, 51-55.
 Show in context
 Supraglacial lake formation and the migration of drainage systems inland in a warming climate (Leeson et al., 2015) could expose new subglacial areas to meltwater flushing, potentially enhancing solute evacuation.
View in article
Loucaides, S., Van Cappellen, P., Behrends, T. (2008) Dissolution of biogenic silica from land to ocean: Role of salinity and pH. Limnology and Oceanography 53, 1614-1621.
 Show in context
 Amorphous Si is an order of magnitude more soluble in saline solutions than in fresh water (Icenhower and Dove, 2000; Loucaides et al., 2008) and recycling is favoured in estuaries (Loucaides et al., 2008).
View in article
Mayer, L.M., Keil, R.G., Macko, S.A., Joye, S.B., Ruttenberg, K.C., Aller, R.C. (1998) Importance of suspended particulates in riverine delivery of bioavailable nitrogen to coastal zones. Global Biogeochemical Cycles 12, 573-579.
 Show in context
 We have demonstrated that, as in riverine systems (Mayer et al., 1998; Ruttenberg, 2014), a high fraction of ice sheet nutrient export is associated with suspended material.
View in article
Palmer, S., Shepherd, A., Nienow, P., Joughin, I. (2011) Seasonal speedup of the Greenland Ice Sheet linked to routing of surface water. Earth and Planetary Science Letters 302, 423-428.
 Show in context
 Figure 1 [...] The catchment area was determined from a surface digitial elevation model (Palmer et al., 2011).
View in article
Ruttenberg, K. (2014) The global phosphorus cycle. Treatise on Geochemistry 8, 499-558.
 Show in context
We have demonstrated that, as in riverine systems (Mayer et al., 1998; Ruttenberg, 2014), a high fraction of ice sheet nutrient export is associated with suspended material.
View in article
Rysgaard, S., Mortensen, J., Juul-Pedersen, T., Sørensen, L.L., Lennert, K., Søgaard, D.H., Arendt, K.E., Blicher, M.E., Sejr, M.K., Bendtsen, J. (2012) High air–sea CO2 uptake rates in nearshore and shelf areas of Southern Greenland: Temporal and spatial variability. Marine Chemistry 128–129, 26-33.
 Show in context
 Currently, we lack information about the impact of meltwater on downstream biogeochemical cycles, even though the coastal waters surrounding the ice sheet harbour highly productive ecosystems, that are strong CO2 sinks (Rysgaard et al., 2012).
View in article
Schroth, A.W., Crusius, J., Hoyer, I., Campbell, R. (2014) Estuarine removal of glacial iron and implications for iron fluxes to the ocean. Geophysical Research Letters 41, 3951-3958.
 Show in context
 Evidence from recent polar studies shows that particle borne nutrients are carried far offshore (Schroth et al., 2014; Wehrmann et al., 2014) and nutrients deposited with glacial sediments in fjords can be resuspended in the water column (Wehrmann et al., 2014).
View in article
Tedesco, M., Fettweis, X., Mote, T., Wahr, J., Alexander, P., Box, J.E., Wouters, B. (2013) Evidence and analysis of 2012 Greenland records from spaceborne observations, a regional climate model and reanalysis data. Cryosphere 7, 615-630.
 Show in context
 Already, the Greenland Ice Sheet has experienced increased surface temperatures, with the five highest melt seasons on record occurring since 2000 (Tedesco et al., 2013).
View in article
In 2012, surface melting was the most widespread in over 100 years (Tedesco et al., 2013).
View in article
Figure 1 [...] (b) Leverett Glacier meltwater discharge (Table 1) versus modelled Greenland Ice Sheet runoff (Tedesco et al., 2013).
View in article
The 2010 and 2012 ablation seasons produced the largest volumes of meltwater on record (Tedesco et al., 2013).
View in article
Table 1 [...] * Greenland Ice Sheet runoff estimates from Tedesco et al. (2013).
View in article
Treguer, P., Nelson, D.M., Vanbennekom, A.J., Demaster, D.J., Leynaert, A., Queguiner, B. (1995) The silica balance in the world ocean - a reestimate. Science 268, 375-379.
 Show in context
 Terrestrial and marine studies have shown that large fractions (75-95 %) of amorphous Si can be dissolved and recycled (Treguer et al., 1995; Gibson et al., 2000).
View in article
Wadham, J., De'ath, R., Monteiro, F.M., Tranter, M., Ridgwell, A., Raiswell, R., Tulaczyk, S. (2013) The potential role of the Antarctic Ice Sheet in global biogeochemical cycles. Earth and Environmental Science Transactions of the Royal Society of Edinburgh 104, 55-67.
 Show in context
Recent work has highlighted the importance of glacier meltwater, including delivery of essential nutrients to the polar oceans (Bhatia et al., 2013; Wadham et al., 2013; Hawkings et al., 2014; Lawson et al., 2014).
View in article
Wehrmann, L.M., Formolo, M.J., Owens, J.D., Raiswell, R., Ferdelman, T.G., Riedinger, N., Lyons, T.W. (2014) Iron and manganese speciation and cycling in glacially influenced high-latitude fjord sediments (West Spitsbergen, Svalbard): Evidence for a benthic recycling-transport mechanism. Geochimica et Cosmochimica Acta 141, 628-655.
 Show in context
 Suspended material has recently been identified as a potential source of labile nutrients to near coastal regions (Hodson et al., 2004; Bhatia et al., 2013; Hawkings et al., 2014; Wehrmann et al., 2014) but data are sparse.
View in article
Evidence from recent polar studies shows that particle borne nutrients are carried far offshore (Schroth et al., 2014; Wehrmann et al., 2014) and nutrients deposited with glacial sediments in fjords can be resuspended in the water column (Wehrmann et al., 2014).
View in article
Wynn, P.M., Hodson, A.J., Heaton, T.H.E., Chenery, S.R. (2007) Nitrate production beneath a High Arctic Glacier, Svalbard. Chemical Geology 244, 88-102.
 Show in context
Si and P are released during rock weathering and dissolved inorganic nitrogen is also enhanced by subglacial biogeochemical processes, such as microbially mediated nitrification (NO3-) and mineralisation of organic matter (NH4-; Wynn et al., 2007).
View in article
Zhang, J.Z., Huang, X.L. (2011) Effect of temperature and salinity on phosphate sorption on marine sediments. Environmental Science & Technology 45, 6831-6837.
 Show in context
 High salinity in ocean and fjord waters also favours P and NH4 desorption (Garner et al., 1991; Hodson et al., 2004; Zhang and Huang, 2011), enhancing their bioavailability.
View in article
top
Supplementary Information
Study Site and Methods
Study area
Research was conducted at Leverett Glacier (LG; Fig. 1a; 67.06 °N, 50.17 °W), a large, land terminating glacier on the southwestern margin of the Greenland Ice Sheet (GrIS). The catchment extends >80 km into the ice sheet and is estimated to cover an area of >600 km2 (Palmer et al., 2011
Palmer, S., Shepherd, A., Nienow, P., Joughin, I. (2011) Seasonal speedup of the Greenland Ice Sheet linked to routing of surface water. Earth and Planetary Science Letters 302, 423-428.
; Cowton et al., 2012Cowton, T., Nienow, P., Bartholomew, I., Sole, A., Mair, D. (2012) Rapid erosion beneath the Greenland ice sheet. Geology 40, 343-346.
). Leverett overlies bedrock of Archean gneiss and granite, common to much of Greenland (Henriksen et al., 2009Henriksen, N., Higgins, A.K., Kalsbeek, F., Pulvertaft, T.C.R. (2009) Greenland from Archaean to Quaternary Descriptive text to the 1995 Geological map of Greenland, 1:2 500 000. In: Garde, A.A. (Ed.) Geological Survey of Denmark and Greenland Bulletin, 2nd edition. 18, 9-116.
). Catchment hydrology is typical of large Greenland outlet glaciers and is described elsewhere (Chandler et al., 2013Chandler, D.M., Wadham, J.L., Lis, G.P., Cowton, T., Sole, A., Bartholomew, I., Telling, J., Nienow, P., Bagshaw, E.A., Mair, D., Vinen, S., Hubbard, A. (2013) Evolution of the subglacial drainage system beneath the Greenland Ice Sheet revealed by tracers. Nature Geoscience 6, 195-198.
). A catchment hydrological record was maintained during the 2009-2012 summer ablation seasons, with monitoring of discharge, electrical conductivity (EC) and turbidity (suspended material), recorded at 5-10 minute intervals (Fig. S-1).
Figure S-1 Leverett Glacier discharge hydrographs and electrical conductivity. Shaded areas in the discharge plots show when discharge exceeded 200 m3 sec-1. The dashed line represents the cut off date used for flux estimates.
Water sample collection and filtration
Bulk meltwater samples for geochemical analysis were collected at least once a day (2009, 2010, 2012), from a sampling site located ~1 km (2012) or ~2 km (2009, 2010) downstream from the Leverett Glacier terminus, throughout the main melt period (May-August). Our confidence that these waters represent the bulk discharge is based on the drainage of Leverett from a single portal. The composition of point samples taken there were within the uncertainty of those taken further downstream.
Grab samples were immediately passed through 47 mm 0.45 μm cellulose nitrate filters (Whatman®), mounted on a PES filtration stack (NalgeneTM), that had been rinsed 3 times with the sample. The filtrate was immediately frozen in clean HDPE 30 mL NalgeneTM bottles that had been rinsed 3 times with the filtered sample. Major ion analysis (Ca2+, Mg2+, K+, Na+, Cl-, SO4-, HCO3-) and NO3- was completed within three months of collection. We used a Thermo ScientificTM DionexTM DX-500 (2009, 2010) or a Thermo ScientificTM DionexTM capillary ICS-5000 (2012), fitted with simultaneous anion and cation columns. Measurement accuracy was ~ ±4 % and precision was ~ ±7 % for the DX-500, and ~ ±3 % and ~ ±3 % for the ICS-5000. Dissolved macronutrients were measured from the 2012 samples using a LaChat QuickChem® 8500 flow injection analyser system using low level detection methods (Si, PO4-) or by manual colormetric techniques (NH4+), as described by Le and Boyd (2012)
Le, P.T.T., Boyd, C.E. (2012) Comparison of phenate and salicylate methods for determination of total ammonia nitrogen in freshwater and saline water. Journal of the World Aquaculture Society 43, 885-889.
. All samples were field blank corrected where the blank concentrations were above the detection limit of the instrument. In total, 408 samples were analysed for major ions and 75 samples, for nutrient concentrations. In 2012, snow and supraglacial meltwaters draining into a moulin ~30 km from the catchment margin were sampled for geochemical analysis (n = 32), using the same methods as the bulk geochemical samples. Snow samples were placed in new Whirl-Pak® bags (Nasco) and left in a water bath to melt. Samples were filtered, as above, as soon as melting was complete.Sediment nutrient extractions
Particulate bound nutrient samples were taken during the 2012 melt season (n = 25 for P and Si, n = 39 for N). Briefly, a meltwater sample of 300-400 mL was filtered through a 0.45 μm cellulose nitrate filter (PSi and PP; Whatman®) or a 0.7 μm glass microfibre filter. Suspended particulate material was retained for the commonly used labile nutrient extractions, “algae available” P (Hodson et al., 2004
Hodson, A.J., Mumford, P., Lister, D. (2004) Suspended sediment and phosphorus in proglacial rivers: bioavailability and potential impacts upon the P status of ice-marginal receiving waters. Hydrological Processes 18, 2409-2422.
), exchangeable NH4 (PN; Maynard et al., 2007Maynard, D.G., Kalra, Y.P., Crumgaugh, J.A. (2007) Nitrate and exchangeable ammonium nitrogen. In: Carter, M.R., Gregorich, E.G. (Eds.) Soil Sampling and Methods of Analysis. CRC Press, Boca Raton, Florida, 25-38.
), and amorphous Si (PSi; DeMaster, 1981DeMaster, D.J. (1981) The supply and accumulation of silica in the marine-environment. Geochimica Et Cosmochimica Acta 45, 1715-1732.
). Particulate material was removed carefully by gentle scraping from the filter, and weighed. Mean extractable concentrations were combined with the total sediment flux from Leverett Glacier, to determine the labile particulate nutrient flux.“Algae available” phosphorus extraction
Owing to its importance as an essential nutrient, phosphorus extraction techniques are well documented in the literature (Dorich et al., 1980
Dorich, R.A., Nelson, D.W., Sommers, L.E. (1980) Algal availability of sediment phosphorus in drainage water of the Black Creek Watershed. Journal of Environmental Quality 9, 557-563.
; DePinto et al., 1981DePinto, J.V., Young, T.C., Martin, S.C. (1981) Algal-available phosphorus in suspended sediments from Lower Great Lakes Tributaries. Journal of Great Lakes Research 7, 311-325.
; Sharpley et al., 1991Sharpley, A.N., Troeger, W.W., Smith, S.J. (1991) The measurement of bioavailable phosphorus in agricultural runoff. Journal of Environmental Quality 20, 235-238.
; Ekholm and Krogerus, 2003Ekholm, P., Krogerus, K. (2003) Determining algal-available phosphorus of differing origin: routine phosphorus analyses versus algal assays. Hydrobiologia 492, 29-42.
; Hodson et al., 2004Hodson, A.J., Mumford, P., Lister, D. (2004) Suspended sediment and phosphorus in proglacial rivers: bioavailability and potential impacts upon the P status of ice-marginal receiving waters. Hydrological Processes 18, 2409-2422.
). Here we used a common extraction method that aims to determine the amount that is bioavailable (Bostrom et al., 1988Bostrom, B., Persson, G., Broberg, B. (1988) Bioavailability of different phosphorus forms in freshwater systems. Hydrobiologia 170, 133-155.
; Hodson et al., 2004Hodson, A.J., Mumford, P., Lister, D. (2004) Suspended sediment and phosphorus in proglacial rivers: bioavailability and potential impacts upon the P status of ice-marginal receiving waters. Hydrological Processes 18, 2409-2422.
). We adapted the standard method to allow for analysis of very small quantities of sediment, i.e. “microextraction”. Briefly, 1.5 mL of 0.1 M NaOH solution was added to ~50 mg of sediment, that was accurately measured to ±0.001 g using a high precision/accuracy balance. We used 2 mL microcentrifuge tubes, which allow similar sediment to extractant ratios to those used by others (Hodson et al., 2004Hodson, A.J., Mumford, P., Lister, D. (2004) Suspended sediment and phosphorus in proglacial rivers: bioavailability and potential impacts upon the P status of ice-marginal receiving waters. Hydrological Processes 18, 2409-2422.
). Microcentrifuge tubes were capped and placed on a reciprocating (rotary) shaker at 200 rpm for 16 hours. Tubes were then centrifuged at 2600 rpm for 10 minutes, the supernatant was transferred to new 2 mL tubes using a 1 mL plastic syringe (PP/PE) and filtered through a syringe filter (Whatman® Puradisc PP).Exchangeable ammonium extraction
We adopted the method described by Maynard et al. (2007)
Maynard, D.G., Kalra, Y.P., Crumgaugh, J.A. (2007) Nitrate and exchangeable ammonium nitrogen. In: Carter, M.R., Gregorich, E.G. (Eds.) Soil Sampling and Methods of Analysis. CRC Press, Boca Raton, Florida, 25-38.
and applied elsewhere (Telling et al., 2011Telling, J., Anesio, A.M., Tranter, M., Irvine-Fynn, T., Hodson, A., Butler, C., Wadham, J. (2011) Nitrogen fixation on Arctic glaciers, Svalbard. Journal of Geophysical Research 116, G03039.
, 2012Telling, J., Stibal, M., Anesio, A.M., Tranter, M., Nias, I., Cook, J., Bellas, C., Lis, G., Wadham, J.L., Sole, A., Nienow, P., Hodson, A. (2012) Microbial nitrogen cycling on the Greenland Ice Sheet. Biogeosciences 9, 2431-2442.
, 2014Telling, J., Anesio, A.M., Tranter, M., Fountain, A., Nylen, T., Hawkings, J., Singh, V.B., Kaur, P., Musilova, M., Wadham, J.L. (2014) Spring thaw ionic pulses boost nutrient availability and microbial growth in entombed Antarctic Dry Valley cryoconite holes. Frontiers in Microbiology 5, 694.
). 10 mL of 2.0 M KCl solution was added to 0.7 µm filters (GF/F Whatman®) in a 15 mL plastic centrifuge tube. Tubes were capped and placed on a reciprocating (rotary) shaker (160 rpm) for 30 minutes. Solutions were then decanted into fresh plastic tubes, centrifuged, filtered through a 0.45 µm syringe filter (Whatman® Puradisc PP) and frozen at -20 °C until analysis. All sediment from filters was retained, rinsed with Milli-Q deionised water (18.2 MΩ cm-1 Millipore) to remove extract solution and dried in an oven overnight at ~50 °C to provide dry sediment weights. These were cross checked against weights expected from hydrological suspended sediment records, i.e. 300 mL of water was filtered so an expected weight could be generated from the recorded meltwater suspended material. Nine blanks were treated in the same manner as the samples, using the same types of filter, to test for filter contamination.Amorphous silica extraction
This is the first study to present data on extraction of amorphous silica in glacial sediments. Here we use a method commonly employed in marine and riverine systems that was developed by DeMaster (1981)
DeMaster, D.J. (1981) The supply and accumulation of silica in the marine-environment. Geochimica Et Cosmochimica Acta 45, 1715-1732.
and validated for terrestrial soils and sediments (Sauer et al., 2006Sauer, D., Saccone, L., Conley, D.J., Herrmann, L., Sommer, M. (2006) Review of methodologies for extracting plant-available and amorphous Si from soils and aquatic sediments. Biogeochemistry 80, 89-108.
). The technique uses 0.1 M Na2CO3, a weak base, which maximises dissolution of amorphous Si, with minimal impact on crystalline material. About 30 mg of sediment was accurately weighed into a 60 mL HDPE bottle (Nalgene®) and 50 mL of 0.1 M Na2CO3 solution was added. Bottles were placed in a hot water bath (85 °C) and 1 mL aliquots were removed after 1, 2, 3 and 5 hours. Aliquots were refrigerated in 2 mL microcentrifuge tubes at 4 °C until analysis, less than 24 hours later. Just prior to analysis, 0.5 mL of sample was neutralised with 4.5 mL 0.021 M HCl in plastic centrifuge tubes. Three blanks were processed alongside the samples to check for method contamination. Amorphous silica was determined by using the intercept of the regression line drawn through Si concentrations obtained from the time series aliquots; amorphous silica dissolves within the first hour of the extraction procedure (DeMaster, 1981DeMaster, D.J. (1981) The supply and accumulation of silica in the marine-environment. Geochimica Et Cosmochimica Acta 45, 1715-1732.
).Analysis of extract solutions and filtered meltwater
Phosphorus and silica extraction solutions were measured on a LaChat QuickChem® 8500 flow injection analyser system (Method Numbers 31-115-01-1-I for P and 31-114-27-1D for Si). The coefficient of variation (CoV) for the method was ±0.5 % for silica (based on seven replicate standards) and ±3.2 % for dissolved orthophosphate (five replicate standards). Limits of detection were 0.3 µM (8.4 µg Si L-1) and 0.01 µM (0.3 µg P L-1). Ammonium was determined using a Bran and Luebbe Autoanalyzer 3 (for extractants) or by the manual salicylate method (Le and Boyd, 2012
Le, P.T.T., Boyd, C.E. (2012) Comparison of phenate and salicylate methods for determination of total ammonia nitrogen in freshwater and saline water. Journal of the World Aquaculture Society 43, 885-889.
). The Luebbe Autoanalyzer 3 method had a CoV of ±1.5 % (eight replicate standards) and a detection limit of 0.5 µM (6.4 µg N L-1). The manual method had a CoV of ±4.9 % (five replicate standards) and a limit of detection of 0.6 µM (8.4 µg N L-1). All samples were blank corrected where blank concentrations were higher than the detection limits.Contribution of supraglacial solute to total solute flux
Measured mean major ion concentration in supraglacial melt (snow and ice melt from 2012, n = 32) was 15 μeq L-1 (±7 μeq L-1). There is no reason to expect there to be significant annual variation in these concentrations, which are more than an order of magnitude lower than mean bulk meltwaters (~400 μeq L-1). The mean supraglacial major ion value of 15 μeq L-1 was multiplied by catchment discharge at each time step and cumulatively summed (Fig. 2) to derive solute fluxes from supraglacial sources.
Catchment hydrological monitoring and meltwater/sediment fluxes
Leverett Glacier runoff was hydrologically gauged throughout the 2009-2012 summer melt seasons, from late April or early May at the onset of melting, through to late August or early September. Briefly, the discharge, electrical conductivity and turbidity (suspended material concentration) of the meltwater river were logged every 5 minutes at a stable bedrock section ~2.2 km downstream from the glacier terminus (Cowton et al., 2012
Cowton, T., Nienow, P., Bartholomew, I., Sole, A., Mair, D. (2012) Rapid erosion beneath the Greenland ice sheet. Geology 40, 343-346.
). Discharge was determined using the method described by Bartholomew et al. (2011)Bartholomew, I., Nienow, P., Sole, A., Mair, D., Cowton, T., Palmer, S., Wadham, J. (2011) Supraglacial forcing of subglacial drainage in the ablation zone of the Greenland ice sheet. Geophysical Research Letters 38, L08502.
. A wired water pressure sensor monitored stage, which was converted into discharge using a (stage-discharge) rating curve of Rhodamine WT dye dilution injections. Twenty nine dye dilutions were used in 2009 and 2010, 26 in 2011 and 41 in 2012. Leverett meltwater and particulate material fluxes were determined by multiplying discharge and suspended material concentrations at the 5 minute time points by 300 (to derive values for each second over the 5 minute period between new recordings) and summed over the entire melt season. For comparison, modelled meltwater runoff data for the Greenland Ice Sheet were taken from Tedesco et al. (2013)Tedesco, M., Fettweis, X., Mote, T., Wahr, J., Alexander, P., Box, J.E., Wouters, B. (2013) Evidence and analysis of 2012 Greenland records from spaceborne observations, a regional climate model and reanalysis data. Cryosphere 7, 615-630.
.Snowline determination
Snowline retreat throughout the 2009-2012 melt seasons was monitored using MODIS (moderate resolution imaging spectroradiometer) on the Terra platform. Surface reflectance band 1-2 images (Product Number MOD09GQ) were processed using the QGIS analysis package, to determine snowline extent (Fig. S-2). Maximum snowline position from monitored years is shown in Figure 1. A minimum of 18 cloud free images were used per year to determine snowline migration.

Figure S-2 An example of the MODIS satellite imagery used to determine snowline extent. Data are from surface reflectance bands 1-2 (Product Number MOD09GQ). Leverett Glacier moves from east to west. The estimated catchment area is outlined in black (Palmer et al., 2011
Palmer, S., Shepherd, A., Nienow, P., Joughin, I. (2011) Seasonal speedup of the Greenland Ice Sheet linked to routing of surface water. Earth and Planetary Science Letters 302, 423-428.
) and the snowline transect is displayed by the red dotted line (space between each dot = 5 km). False colour imaging differentiates between snow (dark blue) and ice (light blue). The margin of the ice sheet is evident at the border of the red colouring (black arrow). The blue dashed line represents the interpreted position of the snowline. The image displayed is from 21 July 2012. Fig. 1a provides more information about the catchment.
Figure S-3 Regression plots for major ions as a function of electrical conductivity. Shaded blue lines represent the standard error (σ, also written in the top left of plots). The 2011 regression plot (bottom left), which encompasess data from 2009, 2010 and 2012, is magnified to demonstrate the linear relationship of electrical conductivity with major ions in the dilute waters.

Figure S-4 Comparison of regression plots for the major ions for 2009, 2010 and 2012, where data are available. The differences in the regression equations used to determine major ion concentrations are very small.

Figure S-5 Temporal variation in meltwater discharge and estimated solute flux. Coloured lines indicate solute flux calculated by the EC based method (eq min-1), and black lines, meltwater discharge (m3 min-1), during the 2009-2012 melt seasons. Shaded areas correspond to meltwater pulse events. These are associated with spring events, i.e. the annual opening of the subglacial drainage system, or rapid drainage of meltwater from supraglacial lake drainage events. These meltwater pulses flush concentrated waters from the subglacial drainage system (Bartholomew et al., 2011
Bartholomew, I., Nienow, P., Sole, A., Mair, D., Cowton, T., Palmer, S., Wadham, J. (2011) Supraglacial forcing of subglacial drainage in the ablation zone of the Greenland ice sheet. Geophysical Research Letters 38, L08502.
and Hawkings et al., 2014Hawkings, J.R., Wadham, J.L., Tranter, M., Raiswell, R., Benning, L.G., Statham, P.J., Tedstone, A., Nienow, P., Lee, K., Telling, J. (2014) Ice sheets as a significant source of highly reactive nanoparticulate iron to the oceans. Nature Communications 5.
).
Figure S-6 Regression plots for nutrient concentrations as a function of electrical conductivity. The regression plots for Si and PO43- represent early (blue) versus later season (red) hydrological and associated biogeochemical changes. Early season regressions are applied to time points before Day 153 in 2009, Day 128 in 2010, Day 160 in 2011 and Day 150 in 2012, which are before the initial change in drainage hydrology occurred, i.e. the spring event (Figs S-1 and S-5). Shaded areas show associated standard error.
Supplementary Information References
Bartholomew, I., Nienow, P., Sole, A., Mair, D., Cowton, T., Palmer, S., Wadham, J. (2011) Supraglacial forcing of subglacial drainage in the ablation zone of the Greenland ice sheet. Geophysical Research Letters 38, L08502.
 Show in context
 Discharge was determined using the method described by Bartholomew et al. (2011).
View in supplementary information
Figure S-5 [...] These meltwater pulses flush concentrated waters from the subglacial drainage system (Bartholomew et al., 2011, and Hawkings et al., 2014).
View in supplementary information
Bostrom, B., Persson, G., Broberg, B. (1988) Bioavailability of different phosphorus forms in freshwater systems. Hydrobiologia 170, 133-155.
 Show in context
 Here we used a common extraction method that aims to determine the amount that is bioavailable (Bostrom et al., 1988; Hodson et al., 2004).
View in supplementary information
Chandler, D.M., Wadham, J.L., Lis, G.P., Cowton, T., Sole, A., Bartholomew, I., Telling, J., Nienow, P., Bagshaw, E.A., Mair, D., Vinen, S., Hubbard, A. (2013) Evolution of the subglacial drainage system beneath the Greenland Ice Sheet revealed by tracers. Nature Geoscience 6, 195-198.
 Show in context
 Catchment hydrology is typical of large Greenland outlet glaciers and is described elsewhere (Chandler et al., 2013).
View in supplementary information
Cowton, T., Nienow, P., Bartholomew, I., Sole, A., Mair, D. (2012) Rapid erosion beneath the Greenland ice sheet. Geology 40, 343-346.
 Show in context
 The catchment extends >80 km into the ice sheet and is estimated to cover an area of >600 km2 (Palmer et al., 2011; Cowton et al., 2012).
View in supplementary information
Briefly, the discharge, electrical conductivity and turbidity (suspended material concentration) of the meltwater river were logged every 5 minutes at a stable bedrock section ~2.2 km downstream from the glacier terminus (Cowton et al., 2012).
View in supplementary information
DeMaster, D.J. (1981) The supply and accumulation of silica in the marine-environment. Geochimica Et Cosmochimica Acta 45, 1715-1732.
 Show in context
 Suspended particulate material was retained for the commonly used labile nutrient extractions, “algae available” P (Hodson et al., 2004), exchangeable NH4 (PN; Maynard et al., 2007), and amorphous Si (PSi; DeMaster, 1981).
View in supplementary information
Here we use a method commonly employed in marine and riverine systems that was developed by DeMaster (1981) and validated for terrestrial soils and sediments (Sauer et al., 2006).
View in supplementary information
Amorphous silica was determined by using the intercept of the regression line drawn through Si concentrations obtained from the time series aliquots; amorphous silica dissolves within the first hour of the extraction procedure (DeMaster, 1981).
View in supplementary information
DePinto, J.V., Young, T.C., Martin, S.C. (1981) Algal-available phosphorus in suspended sediments from Lower Great Lakes Tributaries. Journal of Great Lakes Research 7, 311-325.
 Show in context
 Owing to its importance as an essential nutrient, phosphorus extraction techniques are well documented in the literature (Dorich et al., 1980; DePinto et al., 1981; Sharpley et al., 1991; Ekholm and Krogerus, 2003; Hodson et al., 2004).
View in supplementary information
Dorich, R.A., Nelson, D.W., Sommers, L.E. (1980) Algal availability of sediment phosphorus in drainage water of the Black Creek Watershed. Journal of Environmental Quality 9, 557-563.
 Show in context
 Owing to its importance as an essential nutrient, phosphorus extraction techniques are well documented in the literature (Dorich et al., 1980; DePinto et al., 1981; Sharpley et al., 1991; Ekholm and Krogerus, 2003; Hodson et al., 2004).
View in supplementary information
Ekholm, P., Krogerus, K. (2003) Determining algal-available phosphorus of differing origin: routine phosphorus analyses versus algal assays. Hydrobiologia 492, 29-42.
 Show in context
 Owing to its importance as an essential nutrient, phosphorus extraction techniques are well documented in the literature (Dorich et al., 1980; DePinto et al., 1981; Sharpley et al., 1991; Ekholm and Krogerus, 2003; Hodson et al., 2004).
View in supplementary information
Hawkings, J.R., Wadham, J.L., Tranter, M., Raiswell, R., Benning, L.G., Statham, P.J., Tedstone, A., Nienow, P., Lee, K., Telling, J. (2014) Ice sheets as a significant source of highly reactive nanoparticulate iron to the oceans. Nature Communications 5.
 Show in context
 Figure S-5 [...] These meltwater pulses flush concentrated waters from the subglacial drainage system (Bartholomew et al., 2011, and Hawkings et al., 2014).
View in supplementary information
Henriksen, N., Higgins, A.K., Kalsbeek, F., Pulvertaft, T.C.R. (2009) Greenland from Archaean to Quaternary Descriptive text to the 1995 Geological map of Greenland, 1:2 500 000. In: Garde, A.A. (Ed.) Geological Survey of Denmark and Greenland Bulletin, 2nd edition. 18, 9-116.
 Show in context
 Leverett overlies bedrock of Archean gneiss and granite, common to much of Greenland (Henriksen et al., 2009).
View in supplementary information
Hodson, A.J., Mumford, P., Lister, D. (2004) Suspended sediment and phosphorus in proglacial rivers: bioavailability and potential impacts upon the P status of ice-marginal receiving waters. Hydrological Processes 18, 2409-2422.
 Show in context
 Suspended particulate material was retained for the commonly used labile nutrient extractions, “algae available” P (Hodson et al., 2004), exchangeable NH4 (PN; Maynard et al., 2007), and amorphous Si (PSi; DeMaster, 1981).
View in supplementary information
Owing to its importance as an essential nutrient, phosphorus extraction techniques are well documented in the literature (Dorich et al., 1980; DePinto et al., 1981; Sharpley et al., 1991; Ekholm and Krogerus, 2003; Hodson et al., 2004).
View in supplementary information
Here we used a common extraction method that aims to determine the amount that is bioavailable (Bostrom et al., 1988; Hodson et al., 2004).
View in supplementary information
We used 2 mL microcentrifuge tubes, which allow similar sediment to extractant ratios of those used by others (Hodson et al., 2004).
View in supplementary information
Le, P.T.T., Boyd, C.E. (2012) Comparison of phenate and salicylate methods for determination of total ammonia nitrogen in freshwater and saline water. Journal of the World Aquaculture Society 43, 885-889.
 Show in context
 Dissolved macronutrients were measured from the 2012 samples using a LaChat QuickChem® 8500 flow injection analyser system using low level detection methods (Si, PO4-) or by manual colormetric techniques (NH4+), as described by Le and Boyd (2012).
View in supplementary information
Ammonium was determined using a Bran and Luebbe Autoanalyzer 3 (for extractants) or by the manual salicylate method (Le and Boyd, 2012).
View in supplementary information
Maynard, D.G., Kalra, Y.P., Crumgaugh, J.A. (2007) Nitrate and exchangeable ammonium nitrogen. In: Carter, M.R., Gregorich, E.G. (Eds.) Soil Sampling and Methods of Analysis. CRC Press, Boca Raton, Florida, 25-38.
 Show in context
 Suspended particulate material was retained for the commonly used labile nutrient extractions, “algae available” P (Hodson et al., 2004), exchangeable NH4 (PN; Maynard et al., 2007), and amorphous Si (PSi; DeMaster, 1981).
View in supplementary information
We adopted the method described by Maynard et al. (2007) and applied elsewhere (Telling et al., 2011, 2012, 2014). 10 mL of 2.0 M KCl solution was added to 0.7 µm filters (GF/F Whatman®) in a 15 mL plastic centrifuge tube.
View in supplementary information
Palmer, S., Shepherd, A., Nienow, P., Joughin, I. (2011) Seasonal speedup of the Greenland Ice Sheet linked to routing of surface water. Earth and Planetary Science Letters 302, 423-428.
 Show in context
 The catchment extends >80 km into the ice sheet and is estimated to cover an area of >600 km2 (Palmer et al., 2011; Cowton et al., 2012).
View in supplementary information
Figure S-2 [...] The estimated catchment area is outlined in black (Palmer et al., 2011) and the snowline transect is displayed by the red dotted line (space between each dot = 5 km).
View in supplementary information
Sauer, D., Saccone, L., Conley, D.J., Herrmann, L., Sommer, M. (2006) Review of methodologies for extracting plant-available and amorphous Si from soils and aquatic sediments. Biogeochemistry 80, 89-108.
 Show in context
 Here we use a method commonly employed in marine and riverine systems that was developed by DeMaster (1981) and validated for terrestrial soils and sediments (Sauer et al., 2006).
View in supplementary information
Sharpley, A.N., Troeger, W.W., Smith, S.J. (1991) The measurement of bioavailable phosphorus in agricultural runoff. Journal of Environmental Quality 20, 235-238.
 Show in context
 Owing to its importance as an essential nutrient, phosphorus extraction techniques are well documented in the literature (Dorich et al., 1980; DePinto et al., 1981; Sharpley et al., 1991; Ekholm and Krogerus, 2003; Hodson et al., 2004).
View in supplementary information
Tedesco, M., Fettweis, X., Mote, T., Wahr, J., Alexander, P., Box, J.E., Wouters, B. (2013) Evidence and analysis of 2012 Greenland records from spaceborne observations, a regional climate model and reanalysis data. Cryosphere 7, 615-630.
 Show in context
 For comparison, modelled meltwater runoff data for the Greenland Ice Sheet were taken from Tedesco et al. (2013).
View in supplementary information
Telling, J., Anesio, A.M., Tranter, M., Irvine-Fynn, T., Hodson, A., Butler, C., Wadham, J. (2011) Nitrogen fixation on Arctic glaciers, Svalbard. Journal of Geophysical Research 116, G03039.
 Show in context
 We adopted the method described by Maynard et al. (2007) and applied elsewhere (Telling et al., 2011, 2012, 2014). 10 mL of 2.0 M KCl solution was added to 0.7 µm filters (GF/F Whatman®) in a 15 mL plastic centrifuge tube.
View in supplementary information
Telling, J., Stibal, M., Anesio, A.M., Tranter, M., Nias, I., Cook, J., Bellas, C., Lis, G., Wadham, J.L., Sole, A., Nienow, P., Hodson, A. (2012) Microbial nitrogen cycling on the Greenland Ice Sheet. Biogeosciences 9, 2431-2442.
 Show in context
 We adopted the method described by Maynard et al. (2007) and applied elsewhere (Telling et al., 2011, 2012, 2014). 10 mL of 2.0 M KCl solution was added to 0.7 µm filters (GF/F Whatman®) in a 15 mL plastic centrifuge tube.
View in supplementary information
Telling, J., Anesio, A.M., Tranter, M., Fountain, A., Nylen, T., Hawkings, J., Singh, V.B., Kaur, P., Musilova, M., Wadham, J.L. (2014) Spring thaw ionic pulses boost nutrient availability and microbial growth in entombed Antarctic Dry Valley cryoconite holes. Frontiers in Microbiology 5, 694.
 Show in context
 We adopted the method described by Maynard et al. (2007) and applied elsewhere (Telling et al., 2011, 2012, 2014). 10 mL of 2.0 M KCl solution was added to 0.7 µm filters (GF/F Whatman®) in a 15 mL plastic centrifuge tube.
View in supplementary information
Figures and Tables
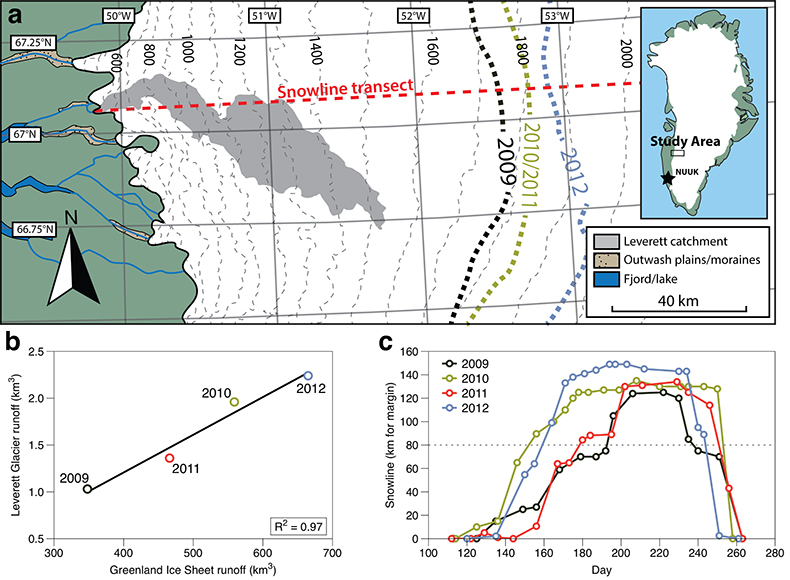
Figure 1 Field site and basic hydrological data. (a) Leverett Glacier with the snowline transect used to determine the point where snow covers the ice surface, derived from MODIS imagery. Dashed lines represent elevation contours. The catchment area was determined from a surface digitial elevation model (Palmer et al., 2011
Palmer, S., Shepherd, A., Nienow, P., Joughin, I. (2011) Seasonal speedup of the Greenland Ice Sheet linked to routing of surface water. Earth and Planetary Science Letters 302, 423-428.
). (b) Leverett Glacier meltwater discharge (Table 1) versus modelled Greenland Ice Sheet runoff (Tedesco et al., 2013Tedesco, M., Fettweis, X., Mote, T., Wahr, J., Alexander, P., Box, J.E., Wouters, B. (2013) Evidence and analysis of 2012 Greenland records from spaceborne observations, a regional climate model and reanalysis data. Cryosphere 7, 615-630.
). (c) Leverett Glacier snowline; open circles represent observed position; connecting lines are linear estimates of retreat, interpolated between the measurements. Estimated catchment extent is represented by the dotted line at ~80 km.Table 1 Flux and hydrological data.
| Year | |||||
| Units | 2009 | 2010 | 2011 | 2012 | |
| Greenland Ice Sheet runoff * | km3 | 348 | 559 | 466 | 665 |
| Leverett Glacier discharge | km3 | 0.94 | 1.79 | 1.1 | 2.03 |
| Snowline above catchment | est. days | 45 | 100 | 73 | 85 |
| Snowline retreat from margin | km | 125 | 135 | 135 | 149 |
| Solute Flux | eq | 3.0 × 10⁸ | 5.6 × 10⁸ | 3.2 × 10⁸ | 5.6 × 10⁸ |
| Sediment Flux | t | 3.7× 10⁶ | 2.6 × 10⁶ | 3.0 × 10⁶ | 2.2 × 10⁶ |
| Dissolved inorganic nitrogen † | t | 25 | 46 | 26 | 48 |
| Dissolved silica † | t | 130 | 230 | 120 | 230 |
| Dissolved inorganic phosphorus† | t | 6.2 | 12 | 6.7 | 12 |
| Dissolved inorganic nitrogen ‡ | t | 22 | 41 | 25 | 47 |
| Dissolved silica ‡ | t | 110 | 220 | 130 | 240 |
| Dissolved inorganic phosphorus‡ | t | 7.8 | 15 | 8.9 | 16 |
| Exchangeable NH4** | t | 19-58 | 13-41 | 15-47 | 11-35 |
| Amorphous silica** | t | 18.000-44.000 | 12.000-31.000 | 14.000-36.000 | 11.000-26.000 |
| NaOH extractable phosphorus** | t | 20-130 | 14-92 | 16-110 | 12-78 |
All estimates are shown to Decimal Day 230/231, i.e. 17 August.
Estimates are reported with 2 significant digits.
eq = molar equivalent
t = tons of dry element
Snowline: the boundary where snow covers the underlying ice. Down glacier from this point is exposed ice, where the snow cover has melted.
* Greenland Ice Sheet runoff estimates from Tedesco et al. (2013)Tedesco, M., Fettweis, X., Mote, T., Wahr, J., Alexander, P., Box, J.E., Wouters, B. (2013) Evidence and analysis of 2012 Greenland records from spaceborne observations, a regional climate model and reanalysis data. Cryosphere 7, 615-630..
** Sediment fluxes given as range based on minimum and maximum extractable nutrient concentrations.
† Fluxes estimated with electrical conductivity.
‡ Fluxes estimated using discharge weighted mean.
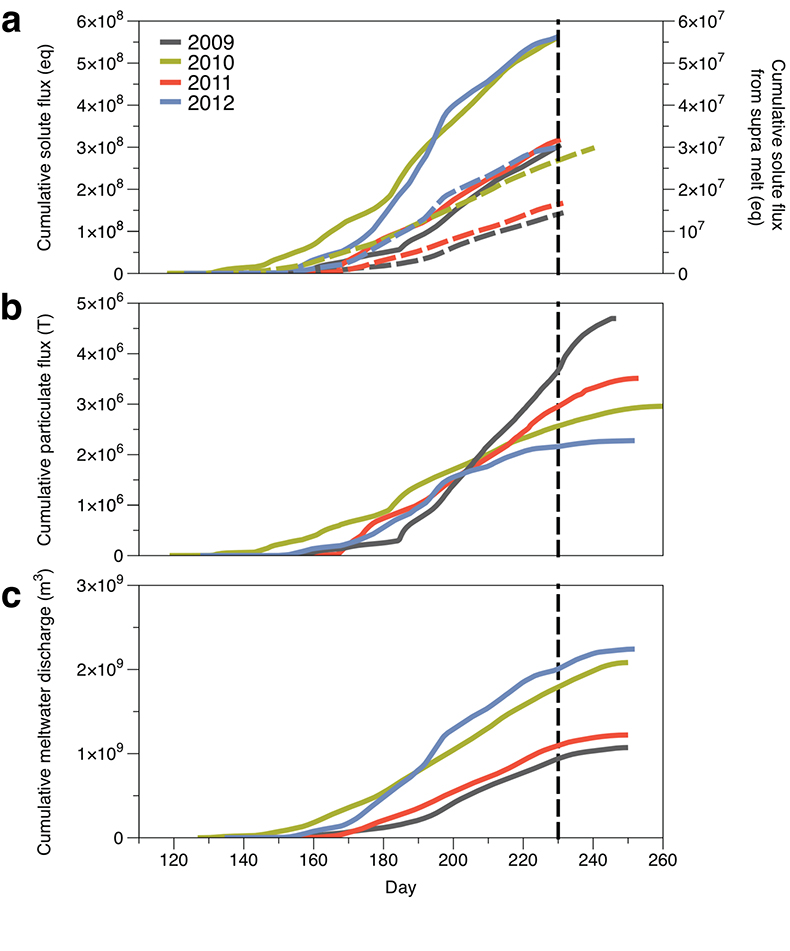
Figure 2 Cumulative solute and sediment flux. (a) Solid lines show solute flux (Ca2+, Mg2+, K+, Na+, Cl-, SO42-, HCO3-); dashed lines represent the estimated portion originating from supraglacial meltwater (right axis). (b) Cumulative particle borne flux. (c) Cumulative meltwater discharge. Day 230 (dashed line) was the limit of the dataset interpretation. Values at the dashed line correspond to data presented in Table 1 and Figure 1b.
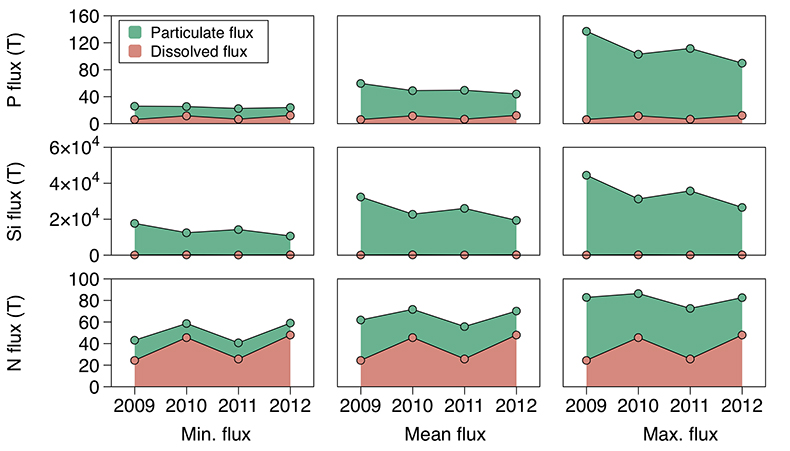
Figure 3 Estimated nutrient flux. Minimum (left column), mean (middle) and maximum (right) possible values give an impression of the range for phosphate, silicate and nitrogen compounds. Dissolved flux was determined using the electrical conductivity correlation.
Back to article
Supplementary Figures and Tables
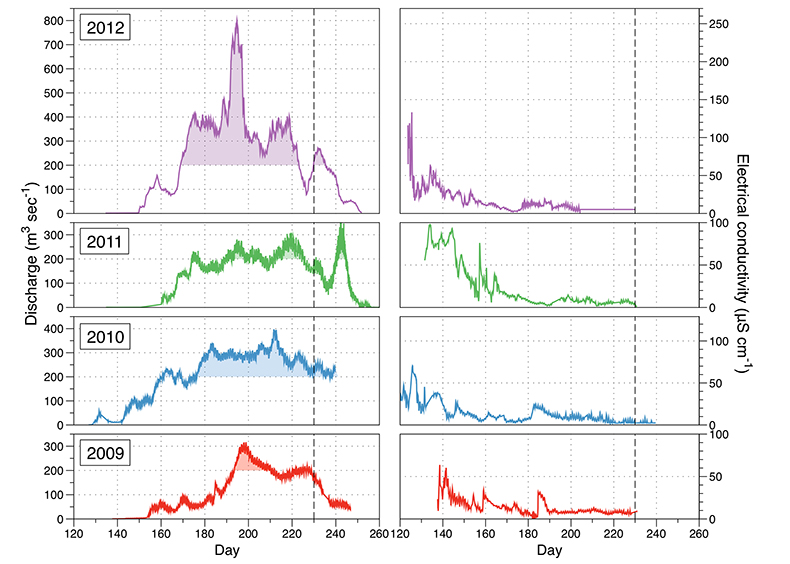
Figure S-1 Leverett Glacier discharge hydrographs and electrical conductivity. Shaded areas in the discharge plots show when discharge exceeded 200 m3 sec-1. The dashed line represents the cut off date used for flux estimates.
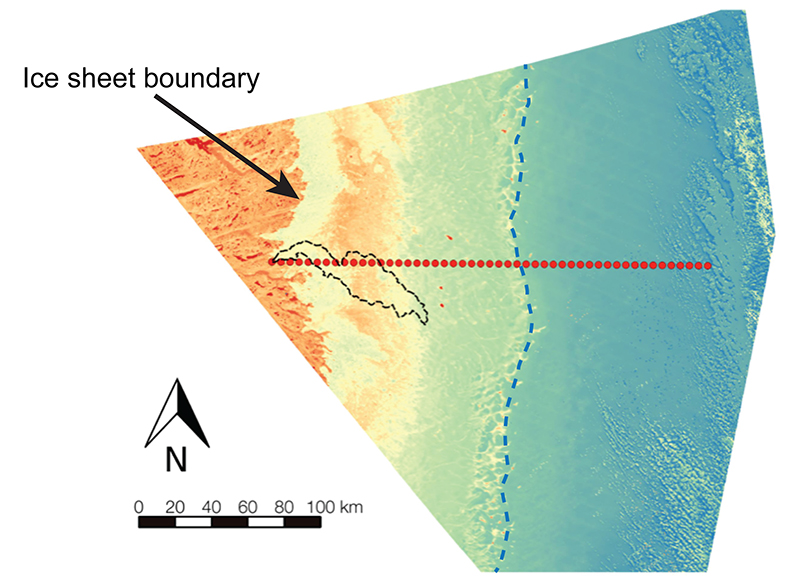
Figure S-2 An example of the MODIS satellite imagery used to determine snowline extent. Data are from surface reflectance bands 1-2 (Product Number MOD09GQ). Leverett Glacier moves from east to west. The estimated catchment area is outlined in black (Palmer et al., 2011
Palmer, S., Shepherd, A., Nienow, P., Joughin, I. (2011) Seasonal speedup of the Greenland Ice Sheet linked to routing of surface water. Earth and Planetary Science Letters 302, 423-428.
) and the snowline transect is displayed by the red dotted line (space between each dot = 5 km). False colour imaging differentiates between snow (dark blue) and ice (light blue). The margin of the ice sheet is evident at the border of the red colouring (black arrow). The blue dashed line represents the interpreted position of the snowline. The image displayed is from 21 July 2012. Fig. 1a provides more information about the catchment.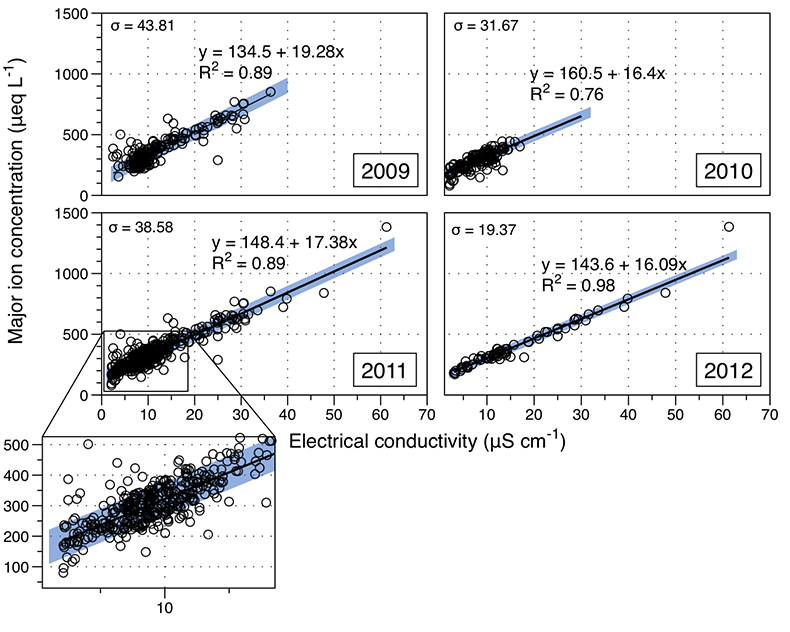
Figure S-3 Regression plots for major ions as a function of electrical conductivity. Shaded blue lines represent the standard error (σ, also written in the top left of plots). The 2011 regression plot (bottom left), which encompasess data from 2009, 2010 and 2012, is magnified to demonstrate the linear relationship of electrical conductivity with major ions in the dilute waters.

Figure S-4 Comparison of regression plots for the major ions for 2009, 2010 and 2012, where data are available. The differences in the regression equations used to determine major ion concentrations are very small.
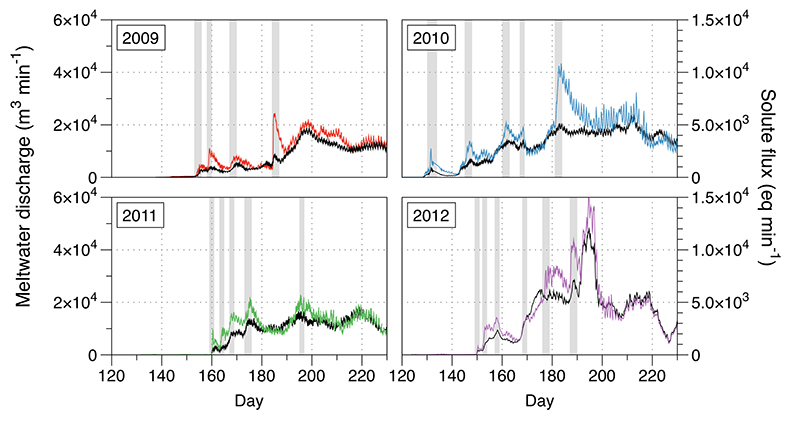
Figure S-5 Temporal variation in meltwater discharge and estimated solute flux. Coloured lines indicate solute flux calculated by the EC based method (eq min-1), and black lines, meltwater discharge (m3 min-1), during the 2009-2012 melt seasons. Shaded areas correspond to meltwater pulse events. These are associated with spring events, i.e. the annual opening of the subglacial drainage system, or rapid drainage of meltwater from supraglacial lake drainage events. These meltwater pulses flush concentrated waters from the subglacial drainage system (Bartholomew et al., 2011
Bartholomew, I., Nienow, P., Sole, A., Mair, D., Cowton, T., Palmer, S., Wadham, J. (2011) Supraglacial forcing of subglacial drainage in the ablation zone of the Greenland ice sheet. Geophysical Research Letters 38, L08502.
and Hawkings et al., 2014Hawkings, J.R., Wadham, J.L., Tranter, M., Raiswell, R., Benning, L.G., Statham, P.J., Tedstone, A., Nienow, P., Lee, K., Telling, J. (2014) Ice sheets as a significant source of highly reactive nanoparticulate iron to the oceans. Nature Communications 5.
).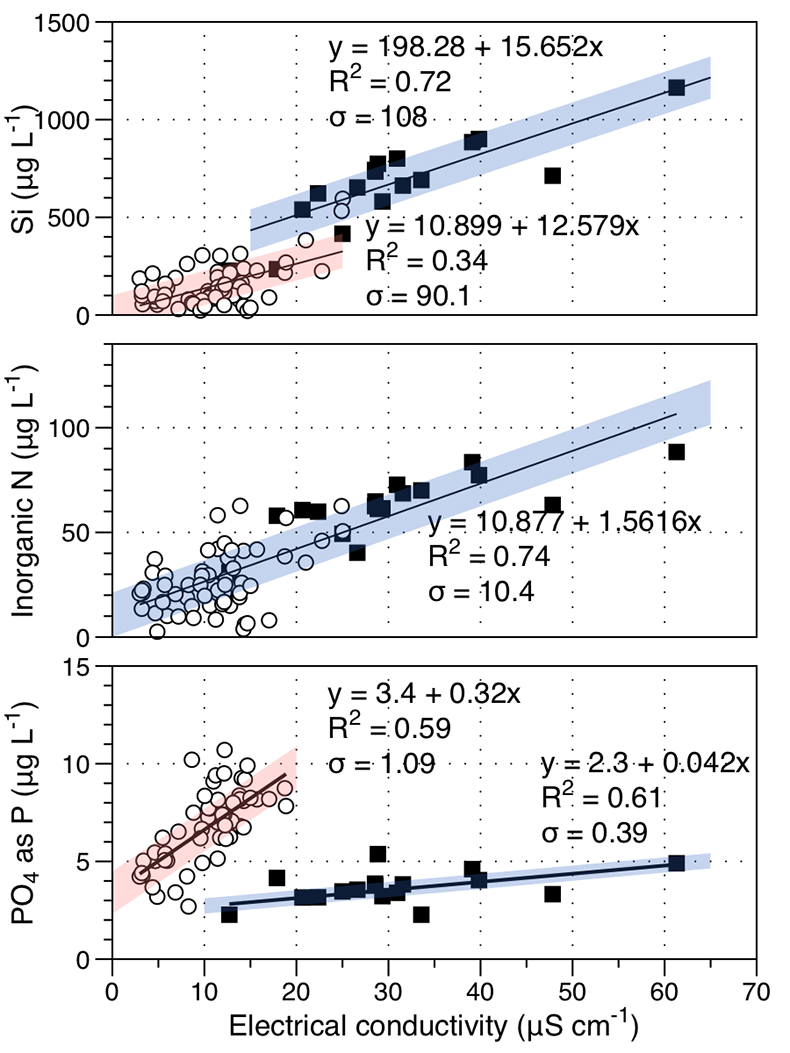
Figure S-6 Regression plots for nutrient concentrations as a function electrical conductivity. The regression plots for Si and PO43- represent early (blue) versus later season (red) hydrological and associated biogeochemical changes. Early season regressions are applied to time points before Day 153 in 2009, Day 128 in 2010, Day 160 in 2011 and Day 150 in 2012, which are before the initial change in drainage hydrology occurred, i.e. the spring event (Figs S-1 and S-5). Shaded areas show associated standard error.


