Rapid response of silicate weathering rates to climate change in the Himalaya
Affiliations | Corresponding Author | Cite as | Funding informationKeywords: lithium isotopes, Himalaya, chemical weathering, monsoon, Pleistocene, Holocene
- Share this article


-
Article views:16,823Cumulative count of HTML views and PDF downloads.
- Download Citation
- Rights & Permissions
top
Abstract
Walker, J.C.G., Hays, P.B., Kasting, J.F. (1981) A negative feedback mechanism for the long-term stabilization of Earth's surface temperature. Journal of Geophysical Research 86, 9776-9782.
; Berner et al., 1983Berner, R.A., Lassaga, A.C., Garrels, R.M. (1983) The carbone-silicate geochemical cycle and its effect on atmospheric carbon dioxide over the past 100 million years. American Journal of Science 283, 641-683.
), accounting for nearly half the consumption of atmospheric carbon dioxide globally (Beaulieu et al., 2012)Beaulieu, E., Godderis, Y., Donnadieu, Y., Labat, D., Roelandt, C. (2012) High sensitivity of the continental-weathering carbon dioxide sink to future climate change. Nature Climate Change 2, 346-349.
. However, the role of climate variability on chemical weathering is still strongly debated. Here we focus on the Himalayan range and use the lithium isotopic composition of clays in fluvial terraces to show a tight coupling between climate change and chemical weathering over the past 40 ka. Between 25 and 10 ka ago, weathering rates decrease despite temperature increase and monsoon intensification. This suggests that at this timescale, temperature plays a secondary role compared to runoff and physical erosion, which inhibit chemical weathering by accelerating sediment transport and act as fundamental controls in determining the feedback between chemical weathering and atmospheric carbon dioxide.Figures and Tables
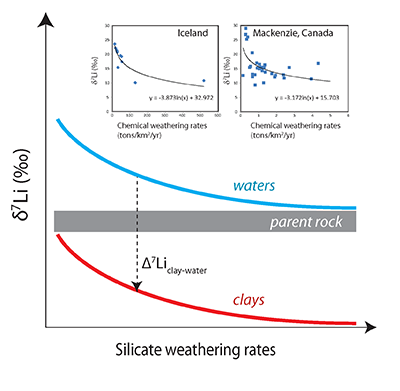 Figure 1 Relationship between δ7Li values of waters and clay minerals, and silicate weathering rates - estimated independently (δ7Li = [(7Li/6Li) / (sup>7Li/6Li)L-SVEC – 1]x1000) where L-SVEC is the standard). Most published studies highlight an inverse correlation between water δ7Li and weathering rates at the watershed scale. For a given Li isotope fractionation between clay and water (Δ7Liclay-water), clay δ7Li is expected to follow the same pattern with silicate weathering rates. Thus, low δ7Li values are indicative of fast weathering rates. Insets show data for river waters from the Mackenzie basin in Canada (Millot et al., 2010) and from the basaltic basins of Iceland (Vigier et al., 2009). The curves in the insets show a logarithmic regression through the data. | 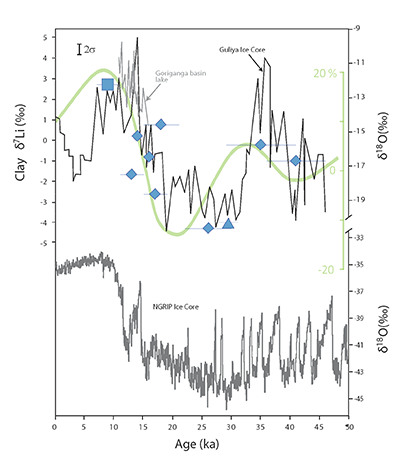 Figure 2 Clay δ7Li as a function of terrace deposition ages (square: Yamuna, triangle: Donga Fan and diamonds: Alaknanda). The vertical bracket in the top left corner shows the external uncertainty for δ7Li. The light green curve represents the precipitation changes in the SW Indian Monsoon for South Asia (green axis graduated from -20 to 20 %; Sanyal and Sinha, 2010 and references therein). The black curve represents the δ18OSMOW record from the Guliya ice core on the Qinghai-Tibetan Plateau (right y-axis) (Thompson et al., 1997). The grey curve is the δ18OVPDB record from lacustrine sediments in the Goriganga basin (right y-axis), 100 km east of the study area (Beukema et al., 2011). Records from the Guliya ice core and the lacustrine sediments from the Goriganga basin show that relative changes in climatic conditions were consistent on both sides of the divide, at least for this period. Comparison with a global palaeo-climatic record is illustrated with the grey curve, showing the NGRIP ice core δ18O record from Greenland for the same period (North Greenland Ice Core Project members, 2004). | 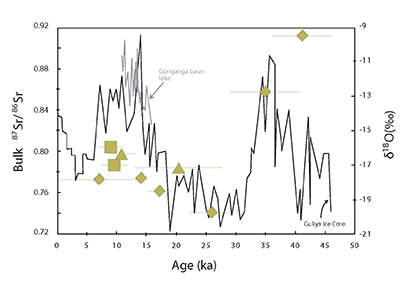 Figure 3 87Sr/86Sr ratios of bulk sediments as a function of terrace deposition ages (same symbols as in Fig. 2). The error on 87Sr/86Sr ratios is smaller than the symbol size. The black curve represents the δ18OSMOW record from the Guliya ice core on the Qinghai-Tibetan Plateau (right y-axis) (Thompson et al., 1997). The grey curve is the δ118OVPDB record from lacustrine sediments in the Goriganga basin (right y-axis) (Beukema et al., 2011). |
| Figure 1 | Figure 2 | Figure 3 |
Supplementary Figures and Tables
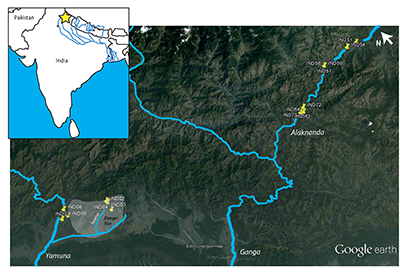 Figure S-1 Map of the study area. Yellow pushpins show the sample locations. The grey area shows the Donga Fan. The yellow star in the inset represents the location of the study area in India. Satellite image source: Cnes/Spot image from Google Earth™. | 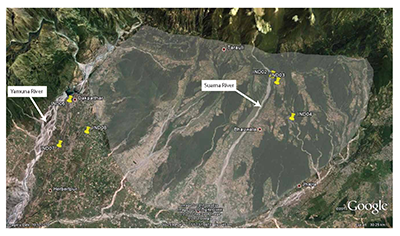 Figure S-2 Google Earth™ image of Donga Fan and Yamuna River sampling locations. The grey area shows the Donga Fan. Flow is from the top to the bottom of the image. Vertical exaggeration is 3x. | 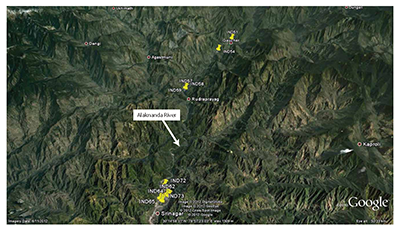 Figure S-3 Google Earth™ image of the Alaknanda River terrace sampling locations. From top to bottom: Gaucher (IND51), Nagrasu (IND54), Rudraprayag (IND57-59) and Srinagar (IND62, 64, 65, 72 and 73). Flow is from top to bottom of the image. Vertical exaggeration is 3x. | 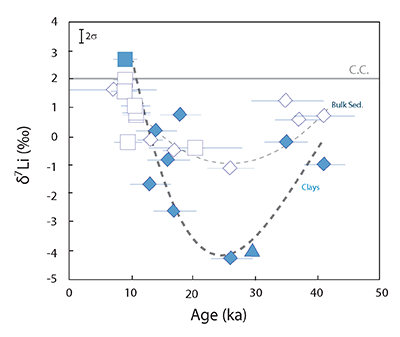 Figure S-4 δ7Li values in clay-sized fractions (full symbols) and bulk sediments (open symbols). Clay-sized fractions show that δ7Li values reach a minimum shortly before the Last Glacial Maximum. This is supported by bulk sediments, although variations are much more dampened. Diamonds: Alakanda, squares: Yamuna, triangles: Donga Fan. The thick dark and light grey curves represent the schematic variation of δ7Li compositions with time for the clay-sized fraction and the bulk sediments, respectively. The horizontal grey line shows the average δ7Li value for the continental crust (Teng et al., 2004; Teng et al., 2009). | 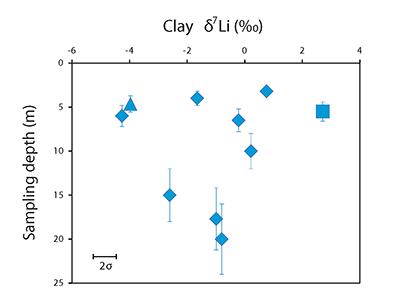 Figure S-5 δ7Li values in clay-sized fractions as a function of sampling depth. No significant trend can be highlighted, supporting the lack of significant post-deposition alteration for the studied samples. |
| Figure S-1 | Figure S-2 | Figure S-3 | Figure S-4 | Figure S-5 |
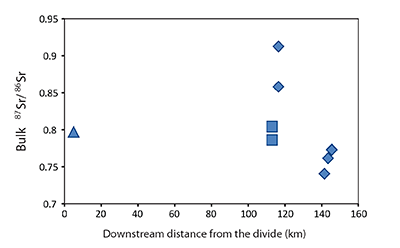 Figure S-6 87Sr/86Sr ratios in bulk sediment as a function of the distance from the divide for the Donga Fan (triangle), Yamuna (squares) and Alaknanda (diamonds). If 87Sr/86Sr ratios were controlled by sediment provenance only, i.e. which rock types they are derived from, Donga Fan sediments should display the highest 87Sr/86Sr values because they only originate from the LH where rocks are characterised by high 87Sr/86Sr ratios (see text for details). Similarly, the 87Sr/86Sr ratio should increase downstream for the Alaknanda as the river flows from the moderately radiogenic HHC into the very radiogenic LH. However the opposite is observed. | 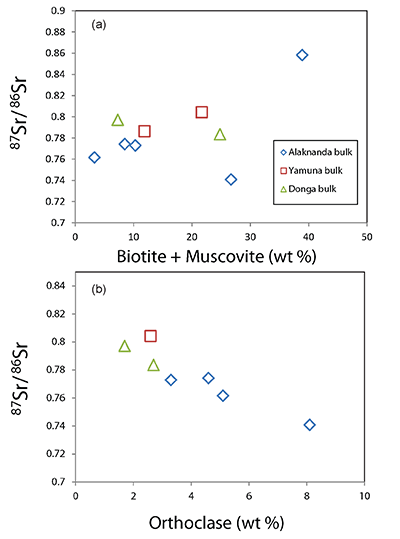 Figure S-7 87Sr/86Sr ratios vs (a) micas and (b) orthoclase contents in bulk sediments. The correlations suggest that 87Sr/86Sr values are controlled by the dissolution of biotite and muscovite, rather than changes in sediment provenance. Errors on 87Sr/86Sr ratios are smaller than the symbol size. Relative errors on mineral contents are less than 5 %. |  Figure S-8 Example of fluvial deposit sampled: IND64, Srinagar terrace T2, dated at 17 ± 2 ka. This terrace is part of a set of six terraces of the Alaknanda River in the Srinagar valley. The deposit consists of 15-20 m of rounded cobbles and boulders showing no preferential imbrication direction and intercalated with sand layers. There is no evidence of post-depositional alteration with neither soil development nor iron oxide staining of the sediment. The sample was collected 15 m below the deposit's surface, in a sand layer. |  Table S-1 Lithium and strontium isotopic data for Himalayan fluvial deposits. |  Table S-2 Mineralogical data. |  Table S-3 Compilation of Li isotopic composition for various rock types. |
| Figure S-6 | Figure S-7 | Figure S-8 | Table S-1 | Table S-2 | Table S-3 |
top
Letter
It has long been recognised that the dissolution of minerals, chemical weathering, can act as a long-term (>1 Ma) feedback on the Earth's climate (Walker et al., 1981
Walker, J.C.G., Hays, P.B., Kasting, J.F. (1981) A negative feedback mechanism for the long-term stabilization of Earth's surface temperature. Journal of Geophysical Research 86, 9776-9782.
; Berner et al., 1983Berner, R.A., Lassaga, A.C., Garrels, R.M. (1983) The carbone-silicate geochemical cycle and its effect on atmospheric carbon dioxide over the past 100 million years. American Journal of Science 283, 641-683.
; Donnadieu et al., 2004Donnadieu, Y., Godderis, Y., Ramstein, G., Nedelec, A., Meert, J. (2004) A 'snowball Earth' climate triggered by continental break-up through changes in runoff. Nature 428, 303-306.
).More recently, modelling studies have shown that the weathering engine can respond extremely rapidly (<100 yr) to climate change and may act as a key component in the atmospheric CO2 level short-term regulation (Beaulieu et al., 2012)Beaulieu, E., Godderis, Y., Donnadieu, Y., Labat, D., Roelandt, C. (2012) High sensitivity of the continental-weathering carbon dioxide sink to future climate change. Nature Climate Change 2, 346-349.
. However, the relative role of climatic parameters on chemical weathering is still debated. Model simulations and geochemical studies of river-born material highlight either a temperature dependence (Walker et al., 1981)Walker, J.C.G., Hays, P.B., Kasting, J.F. (1981) A negative feedback mechanism for the long-term stabilization of Earth's surface temperature. Journal of Geophysical Research 86, 9776-9782.
, where warming promotes chemical weathering, or a predominance of other parameters like mechanical erosion (Raymo and Ruddiman, 1992Raymo, M.E., Ruddiman, W.F. (1992) Tectonic Forcing of Late Cenozoic Climate. Nature 359, 117-122.
; Gaillardet et al., 1999Gaillardet, J., Dupre, B., Allègre, C.J. (1999) Geochemistry of large river suspended sediments: Silicate weathering or recycling tracer? Geochimica et Cosmochimica Acta 63, 4037-4051.
; Riebe et al., 2001Riebe, C.S., Kirchner, J.W., Granger, D.E., Finkel, R.C. (2001) Strong tectonic and weak climatic control of long-term chemical weathering rates. Geology 29, 511-514.
; Donnadieu et al., 2004Donnadieu, Y., Godderis, Y., Ramstein, G., Nedelec, A., Meert, J. (2004) A 'snowball Earth' climate triggered by continental break-up through changes in runoff. Nature 428, 303-306.
) and vegetation (Bayon et al., 2012)Bayon, G., Dennielou, B., Etoubleau, J., Ponzevera, E., Toucanne, S., Bermell, S. (2012) Intensifying Weathering and Land Use in Iron Age Central Africa. Science 335, 1219-1222.
. To address this question, another possible approach consists in investigating past continental environments through the study of marine or floodplain deposits. However, because in large river systems sediment transport and storage operates over >104 yr timescales (Granet et al., 2010)Granet, M., Chabaux, F., Stille, P., Dosseto, A., France-Lanord, C., Blaes, E. (2010) U-series disequilibria in suspended river sediments and implication for sediment transfer time in alluvial plains: The case of the Himalayan rivers. Geochimica et Cosmochimica Acta 74, 2851-2865.
, a significant time lag may exist between the time when sediments acquired their geochemical characteristics, reflecting palaeoenvironmental conditions, and their final deposition.Here we use the lithium (Li) isotopic composition of clays from sedimentary records in Himalayan basins to determine how chemical weathering intensity has varied over the past 40 ka and particularly since the Last Glacial Maximum (locally older than 24 ka; Owen et al., 2002
Owen, L.A., Finkel, R.C., Caffee, M.W. (2002) A note on the extent of glaciation throughout the Himalaya during the global Last Glacial Maximum. Quaternary Science Reviews 21, 147-157.
). In order to minimise the time lag between source and deposit locations, we have focused on alluvial deposits located in the headwater areas of the Ganges and Yamuna Rivers.While little isotope fractionation occurs during mineral dissolution, clay formation induces strong fractionations at low temperature, whereby 6Li is preferentially incorporated into clays compared to 7Li, resulting in a strong enrichment of 7Li in waters (Burton and Vigier, 2011)
Burton, K.W., Vigier, N. (2011) Lithium Isotopes as Tracers in Marine and Terrestrial Environments. In: Baskaran, M. (Eds.) Handbook of Environmental Isotope Geochemistry. Springer Berlin Heidelberg, 41-59.
. Thus, it has been shown that the δ7Li composition of natural waters can be used as a proxy for chemical weathering rates at the catchment scale, since the heaviest δ7Li compositions in water are associated with the areas characterised by low catchment-wide silicate weathering rates (Fig. 1). Several studies have also shown that the δ7Li composition of solid weathering products (i.e. soils, river sediments) is sensitive to chemical weathering conditions, where lower δ7Li values reflect more intensive leaching (Burton and Vigier, 2011)Burton, K.W., Vigier, N. (2011) Lithium Isotopes as Tracers in Marine and Terrestrial Environments. In: Baskaran, M. (Eds.) Handbook of Environmental Isotope Geochemistry. Springer Berlin Heidelberg, 41-59.
.
Figure 1 Relationship between δ7Li values of waters and clay minerals, and silicate weathering rates - estimated independently (δ7Li = [(7Li/6Li) / (sup>7Li/6Li)L-SVEC – 1]x1000) where L-SVEC is the standard). Most published studies highlight an inverse correlation between water δ7Li and weathering rates at the watershed scale. For a given Li isotope fractionation between clay and water (Δ7Liclay-water), clay δ7Li is expected to follow the same pattern with silicate weathering rates. Thus, low δ7Li values are indicative of fast weathering rates. Insets show data for river waters from the Mackenzie basin in Canada (Millot et al., 2010)
Millot, R., Vigier, N., Gaillardet, J. (2010) Behaviour of lithium and its isotopes during weathering in the Mackenzie Basin, Canada. Geochimica et Cosmochimica Acta 74, 3897-3912.
and from the basaltic basins of Iceland (Vigier et al., 2009) Vigier, N., Gislason, S.R., Burton, K.W., Millot, R., Mokadem, F. (2009) The relationship between riverine lithium isotope composition and silicate weathering rates in Iceland. Earth and Planetary Science Letters 287, 434-441.
Singh, A.K., Parkash, B., Mohindra, R., Thomas, J.V., Singhvi, A.K. (2001) Quaternary alluvial fan sedimentation in the Dehradun Valley Piggyback Basin, NW Himalaya: tectonic and palaeoclimatic implications. Basin Research 13, 449-471.
; Ray and Srivastava, 2010Ray, Y., Srivastava, P. (2010) Widespread aggradation in the mountainous catchment of the Alaknanda-Ganga River System: timescales and implications to Hinterland-foreland relationships. Quaternary Science Reviews 29, 2238-2260.
). Both bulk sediments and clay-sized fractions were analysed for Li isotopes. In bulk sediments, mineralogical abundances and Sr isotopes were also measured (see Supplementary Information).The δ7Li compositions of bulk sediments vary between -1.54 and +1.98 ‰, while clay-sized fractions show a much broader range. Most samples show low δ7Li values best explained by significant 6Li enrichment during clay formation (Burton and Vigier, 2011)
Burton, K.W., Vigier, N. (2011) Lithium Isotopes as Tracers in Marine and Terrestrial Environments. In: Baskaran, M. (Eds.) Handbook of Environmental Isotope Geochemistry. Springer Berlin Heidelberg, 41-59.
. The δ7Li values in bulk samples and clay-sized fractions evolve consistently as a function of time: both decrease between 35 and 25 ka, then increase between 25 and 10 ka (Fig. 2 and Fig. S-4). Several hypotheses can potentially account for the observed δ7Li variations: (i) change of sediment sources, (ii) changes in chemical weathering conditions (prior to deposition) and (iii) post-depositional alteration within the terraces.
Figure 2 Clay δ7Li as a function of terrace deposition ages (square: Yamuna, triangle: Donga Fan and diamonds: Alaknanda). The vertical bracket in the top left corner shows the external uncertainty for δ7Li. The light green curve represents the precipitation changes in the SW Indian Monsoon for South Asia (green axis graduated from -20 to 20 %; Sanyal and Sinha, 2010
Sanyal, P., Sinha, R. (2010) Evolution of the Indian summer monsoon: synthesis of continental records. Geological Society, London, Special Publications 342, 153-183.
and references therein). The black curve represents the δ18OSMOW record from the Guliya ice core on the Qinghai-Tibetan Plateau (right y-axis) (Thompson et al., 1997)Thompson, L.G., Yao, T., Davis, M.E., Henderson, K.A., Mosley-Thompson, E., Lin, P.-N., Beer, J., Synal, H.-A., Cole-Dai, J., Bolzan, J.F. (1997) Tropical Climate Instability: The Last Glacial Cycle from a Qinghai-Tibetan Ice Core. Science 276, 1821-1825.
. The grey curve is the δ18OVPDB record from lacustrine sediments in the Goriganga basin (right y-axis), 100 km east of the study area (Beukema et al., 2011)Beukema, S.P., Krishnamurthy, R.V., Juyal, N., Basavaiah, N., Singhvi, A.K. (2011) Monsoon variability and chemical weathering during the late Pleistocene in the Goriganga basin, higher central Himalaya, India. Quaternary Research 75, 597-604.
. Records from the Guliya ice core and the lacustrine sediments from the Goriganga basin show that relative changes in climatic conditions were consistent on both sides of the divide, at least for this period. Comparison with a global palaeo-climatic record is illustrated with the grey curve, showing the NGRIP ice core δ18O record from Greenland for the same period (North Greenland Ice Core Project members, 2004)North Greenland Ice Core Project members (2004) High-resolution record of Northern Hemisphere climate extending into the last interglacial period. Nature 431, 147-151.
.Kisakűrek, B., James, R.H., Harris, N.B.W. (2005) Li and δ7Li in Himalayan rivers: Proxies for silicate weathering? Earth and Planetary Science Letters 237, 387-401.
.After deposition, weathering of alluvial sediments could bias the Li isotope composition of sediments and clays. However, several lines of evidence argue against this: (i) post-depositional alteration is expected to mainly affect the "exchangeable" Li. Experimental work has shown that Li is quickly incorporated into clay octahedral sites. It then remains into these sites even after intensive (hydrothermal) treatment (Vigier et al., 2008)
Vigier, N., Decarreau, A., Millot, R., Carignan, J., Petit, S., France-Lanord, C. (2008) Quantifying Li isotope fractionation during smectite formation and implications for the Li cycle. Geochimica et Cosmochimica Acta 72, 780-792.
. As a consequence, low-temperature water percolating through deposited sediment will principally, and quickly, react with exchangeable cations but not with Li+ ions in octahedral sites. Thus, to ensure that measured Li isotope compositions were not overprinted by any Li water-clay exchange during post-depositional alteration, the exchangeable Li was systematically removed during sample preparation (Supplementary Information). (ii) There is no simple relationship between δ7Li compositions and sampling depth (Fig. S-5). In fact, superficial alteration was carefully avoided by collecting samples located at significant depths (9 m on average), whereas soil development (if any) was restricted to the upper 2 m. Furthermore, all selected samples derive from undisturbed stratigraphic sections, with no sign of post-depositional alteration (Supplementary Information). (iii) If post-depositional alteration was significant, δ7Li would be expected to correlate with depositional age. However, this is not observed as the oldest deposits (37-41 ka) display δ7Li values that are similar to more recent sediments (Table S-1). Alternatively, the lack of relationship with depositional age could reflect complex lateral fluid flow. However, this water-sediment interaction would also only affect the exchangeable Li, which was removed as indicated above. (iv) Several samples with similar depositional ages but from different regions show consistent δ7Li values as a function of age (Table S-1).As a first approximation, since Li isotope fractionation during clay formation is temperature-dependent (Vigier et al., 2008)
Vigier, N., Decarreau, A., Millot, R., Carignan, J., Petit, S., France-Lanord, C. (2008) Quantifying Li isotope fractionation during smectite formation and implications for the Li cycle. Geochimica et Cosmochimica Acta 72, 780-792.
, δ7Li variations in clays could potentially reflect mean temperature change since the Last Glacial Maximum (LGM). Warming since the LGM has been estimated between 4 and 7 °C (Farrera et al., 1999)Farrera, I., Harrison, S.P., Prentice, I.C., Ramstein, G., Guiot, J., Bartlein, P.J., Bonnefille, R., Bush, M., Cramer, W., von Grafenstein, U., Holmgren, K., Hooghiemstra, H., Hope, G., Jolly, D., Lauritzen, S.E., Ono, Y., Pinot, S., Stute, M., Yu, G. (1999) Tropical climates at the Last Glacial Maximum: a new synthesis of terrestrial palaeoclimate data. I. Vegetation, lake-levels and geochemistry. Climate Dynamics 15, 823-856.
. Experimental data indicate that this temperature increase could induce an increase in δ7Li between 0.5 and 0.9 ‰ in the solid (Vigier et al., 2008)Vigier, N., Decarreau, A., Millot, R., Carignan, J., Petit, S., France-Lanord, C. (2008) Quantifying Li isotope fractionation during smectite formation and implications for the Li cycle. Geochimica et Cosmochimica Acta 72, 780-792.
. This is well below the extent of the increase in δ7Li observed in clay-sized fractions (of ~7 ‰). Thus, temperature variations alone cannot account for the observed range in δ7Li values.Several studies have shown that the δ7Li values measured in river waters and soils decrease with increasing chemical weathering rates at the scale of the watershed or the soil profile (Fig. 1; Kisakűrek et al., 2005
Kisakűrek, B., James, R.H., Harris, N.B.W. (2005) Li and δ7Li in Himalayan rivers: Proxies for silicate weathering? Earth and Planetary Science Letters 237, 387-401.
; Vigier et al., 2009 Vigier, N., Gislason, S.R., Burton, K.W., Millot, R., Mokadem, F. (2009) The relationship between riverine lithium isotope composition and silicate weathering rates in Iceland. Earth and Planetary Science Letters 287, 434-441.
Millot, R., Vigier, N., Gaillardet, J. (2010) Behaviour of lithium and its isotopes during weathering in the Mackenzie Basin, Canada. Geochimica et Cosmochimica Acta 74, 3897-3912.
). In addition, the low δ7Li values of clay-sized fractions support an enrichment in 6Li in secondary phases during chemical weathering (Kisakűrek et al., 2005)Kisakűrek, B., James, R.H., Harris, N.B.W. (2005) Li and δ7Li in Himalayan rivers: Proxies for silicate weathering? Earth and Planetary Science Letters 237, 387-401.
. Consequently, variations in δ7Li are best explained by changes in weathering conditions over the past 40 ka. In this case, the decrease towards low δ7Li compositions between 35 and 25 ka indicates an increase in weathering rates over this period of time. The following increase in δ7Li between 25 and 10 ka then suggests that weathering rates have decreased since the end of the LGM. An intimate link between climate and weathering in this region appears when comparing clay δ7Li and the oxygen isotope compositions recorded by the Guliya ice core from the Qinghai-Tibetan Plateau (Fig. 2; Thompson et al., 1997Thompson, L.G., Yao, T., Davis, M.E., Henderson, K.A., Mosley-Thompson, E., Lin, P.-N., Beer, J., Synal, H.-A., Cole-Dai, J., Bolzan, J.F. (1997) Tropical Climate Instability: The Last Glacial Cycle from a Qinghai-Tibetan Ice Core. Science 276, 1821-1825.
). This oxygen isotope record is consistent with an intensification of the monsoon between 25 and 10 ka ago, as suggested by most studies (Goodbred and Kuehl, 2000Goodbred, S.J., Kuehl, S.A. (2000) Enormous Ganges-Brahmaputra sediment dischange during strengthened early Holocene monsoon. Geology 28, 1083-1086.
; Sanyal and Sinha, 2010Sanyal, P., Sinha, R. (2010) Evolution of the Indian summer monsoon: synthesis of continental records. Geological Society, London, Special Publications 342, 153-183.
; Beukema et al., 2011Beukema, S.P., Krishnamurthy, R.V., Juyal, N., Basavaiah, N., Singhvi, A.K. (2011) Monsoon variability and chemical weathering during the late Pleistocene in the Goriganga basin, higher central Himalaya, India. Quaternary Research 75, 597-604.
). Consequently, the co-variation between δ7Li and δ18O values indicates a synchronicity between changes in chemical weathering rates and monsoon intensity.The strontium (Sr) isotope composition of bulk sediments also shows systematic variations with time, similar to that of δ7Li (Fig. 3). Strontium isotopes have been used to study changes in the provenance of sediments, on the basis of different 87Sr/86Sr ratios in the source rocks found in the catchment (Galy and France-Lanord, 1999)
Galy, A., France-Lanord, C. (1999) Weathering processes in the Ganges–Brahmaputra basin and the riverine alkalinity budget. Chemical Geology 159, 31-60.
. Average 87Sr/86Sr ratios for the Higher Himalaya Crystallines (HHC) and the Lesser Himalayas (LH) are significantly different: 0.76 ± 0.03 and 0.85 ± 0.09, respectively (Rahaman et al., 2009)Rahaman, W., Singh, S.K., Sinha, R., Tandon, S.K. (2009) Climate control on erosion distribution over the Himalaya during the past ~100 ka. Geology 37, 559-562.
. Thus, the observed increase in 87Sr/86Sr between 25 and 10 ka could be interpreted as an increasing contribution of sediments from the LH. However, as the monsoon intensified between 25 and 10 ka ago (Sanyal and Sinha, 2010)Sanyal, P., Sinha, R. (2010) Evolution of the Indian summer monsoon: synthesis of continental records. Geological Society, London, Special Publications 342, 153-183.
, moisture penetrated further north, promoting erosion in the HHC, as demonstrated for the Sutlej River (Bookhagen et al., 2005)Bookhagen, B., Thiede, R.C., Strecker, M.R. (2005) Late Quaternary intensified monsoon phases control landscape evolution in the northwest Himalaya. Geology 33, 149-152.
. More sediments from the HHC would have resulted in a decrease of sediment 87Sr/86Sr ratios, at odds with the data presented here (Fig. 3). Furthermore, if provenance controlled the 87Sr/86Sr ratio, sediments of the Donga Fan should show high values (because they only drain the LH) and the Sr isotopic composition of the Alaknanda River sediments should increase downstream (as more sediments are derived from the LH). However, our data show the opposite trend (Fig. S-6).
Figure 3 87Sr/86Sr ratios of bulk sediments as a function of terrace deposition ages (same symbols as in Fig. 2). The error on 87Sr/86Sr ratios is smaller than the symbol size. The black curve represents the δ18OSMOW record from the Guliya ice core on the Qinghai-Tibetan Plateau (right y-axis) (Thompson et al., 1997)
Thompson, L.G., Yao, T., Davis, M.E., Henderson, K.A., Mosley-Thompson, E., Lin, P.-N., Beer, J., Synal, H.-A., Cole-Dai, J., Bolzan, J.F. (1997) Tropical Climate Instability: The Last Glacial Cycle from a Qinghai-Tibetan Ice Core. Science 276, 1821-1825.
. The grey curve is the δ118OVPDB record from lacustrine sediments in the Goriganga basin (right y-axis) (Beukema et al., 2011)Beukema, S.P., Krishnamurthy, R.V., Juyal, N., Basavaiah, N., Singhvi, A.K. (2011) Monsoon variability and chemical weathering during the late Pleistocene in the Goriganga basin, higher central Himalaya, India. Quaternary Research 75, 597-604.
.Blum, J.D., Erel, Y., Brown, K. (1993) 87Sr/86Sr ratios of Sierra Nevada stream waters: Implications for relative mineral weathering rates. Geochimica et Cosmochimica Acta 57, 5019-5025.
; Colin et al., 1999Colin, C., Turpin, L., Bertaux, J., Desprairies, A., Kissel, C. (1999) Erosional history of the Himalayan and Burman ranges during the last two glacial-interglacial cycles. Earth and Planetary Science Letters 171, 647-660.
). For instance, Blum et al. (1993)Blum, J.D., Erel, Y., Brown, K. (1993) 87Sr/86Sr ratios of Sierra Nevada stream waters: Implications for relative mineral weathering rates. Geochimica et Cosmochimica Acta 57, 5019-5025.
have highlighted a significant dissolution of high 87Sr/86Sr phases in glaciated areas. Bulk sediments from the three regions studied show a correlation between their 87Sr/86Sr and mineralogical content, such as micas and orthoclase (Fig. S-7). This suggests that the relative dissolution of primary minerals controls the 87Sr/86Sr of the bulk sediment, rather than sediment provenance. Thus, the minimum in 87Sr/86Sr values associated with the lowest δ7Li values at 25 ka is consistent with more intense weathering conditions, when δ18O values of local and NGRIP ice cores both indicate cold conditions.Taken together, Li and Sr isotope systematics suggest that chemical weathering conditions in the Himalayan range have been significantly affected by climatic variations between 40 and 10 ka. Moreover, synchronous variations (within errors) between δ7Li and δ18O values suggest that the response of transport and storage of weathering products to climate change was rapid (< a few thousand years). Our data indicate that chemical weathering rates significantly decreased between 25 and 10 ka. It is possible to estimate the corresponding magnitude of changes in silicate weathering rates using a constant clay-water fractionation: an increase of clay δ7Li from -4 ‰ to +3 ‰ corresponds to an increase of water δ7Li of 7 ‰ for the considered period. As a first approximation, using the relationship between water δ7Li and weathering rates (Vigier et al., 2009
Vigier, N., Gislason, S.R., Burton, K.W., Millot, R., Mokadem, F. (2009) The relationship between riverine lithium isotope composition and silicate weathering rates in Iceland. Earth and Planetary Science Letters 287, 434-441.
Millot, R., Vigier, N., Gaillardet, J. (2010) Behaviour of lithium and its isotopes during weathering in the Mackenzie Basin, Canada. Geochimica et Cosmochimica Acta 74, 3897-3912.
), this change in δ7Liwater would translate to a decrease in silicate weathering rates by an order of magnitude (using the regression for the Mackenzie data, Fig. 1 and Δ7Liclay-water = -17 ‰; Vigier et al., 2008Vigier, N., Decarreau, A., Millot, R., Carignan, J., Petit, S., France-Lanord, C. (2008) Quantifying Li isotope fractionation during smectite formation and implications for the Li cycle. Geochimica et Cosmochimica Acta 72, 780-792.
).This decrease in chemical weathering rates coeval with global warming since the end of the LGM runs counter to the expectation that chemical weathering is promoted by warmer and wetter conditions (Walker et al., 1981)
Walker, J.C.G., Hays, P.B., Kasting, J.F. (1981) A negative feedback mechanism for the long-term stabilization of Earth's surface temperature. Journal of Geophysical Research 86, 9776-9782.
. This result highlights runoff and physical erosion as major controls on chemical weathering in the Himalayan region for the last 25 ka, climate warming playing a secondary role at this timescale. It has been proposed that a significant increase in erosion rates accompanied monsoon intensification in the Himalaya since the end of the LGM, mainly via increased runoff (Bookhagen et al., 2005;Bookhagen, B., Thiede, R.C., Strecker, M.R. (2005) Late Quaternary intensified monsoon phases control landscape evolution in the northwest Himalaya. Geology 33, 149-152.
Clift et al., 2008Clift, P.D., Giosan, L., BIusztajn, J., Campbell, I.H., Allen, C., Pringle, M., Tabrez, A.R., Danish, M., Rabbani, M.M., Alizai, A., Carter, A., Lueckge, A. (2008) Holocene erosion of the Lesser Himalaya triggered by intensified summer monsoon. Geology 36, 79-82.
) and its effect on landsliding and fluvial incision. The resulting increased sediment transport is likely to have reduced the average residence time of soils and sediments within the basins, which in turn would have limited chemical weathering. In contrast, at the LGM, the observation of more intense weathering could be explained by the high surface area of the regolith produced by glacial erosion, promoting mineral dissolution despite colder conditions.Recently, Beaulieu et al. (2012)
Beaulieu, E., Godderis, Y., Donnadieu, Y., Labat, D., Roelandt, C. (2012) High sensitivity of the continental-weathering carbon dioxide sink to future climate change. Nature Climate Change 2, 346-349.
have shown that at the decadal/centennial scale, the chemical weathering response, dominated by carbonate weathering, is sensitive to both runoff and temperature. Distinguishing between the two factors can be challenging, since they are often linked to each other (Labat et al., 2004)Labat, D., Goddéris, Y., Probst, J.L., Guyot, J.L. (2004) Evidence for global runoff increase related to climate warming. Advances in Water Resources 27, 631-642.
. Here, our results show that at the millennial scale, silicate chemical weathering rates in the Himalayan range are mainly driven by runoff and physical erosion, while temperature plays a secondary role.top
Acknowledgements
We would like to thank Yogesh Ray, P.O. Suresh, David Fink, Paul Hesse, Jan-Hendrik May and Oliver Korup for their assistance in the field. The Director of the Wadia Institute of Himalayan Geology is acknowledged for extending logistic support. Greg Ravizza, Ken Rubin, Doug Pyle, Chris Russo and Denys Vonderhaar at University of Hawai'i at Mānoa, Aimeryc Schumacher at CRPG, and Paul Carr, Brian Jones, Venera Espanon, Jose Abrantes at University of Wollongong are thanked for their assistance with the analytical work. We would also like to thank John D. Jansen, Pete Burnard, Helen McGregor, Jan-Hendrik May, Tim Cohen, Allen Nutman and Colin Murray-Wallace for their comments on the manuscript. Finally, we would like to acknowledge Christian France-Lanord, Albert Galy, Marteen Lupker, Doug Burbank, François Chabaux, Cliff Riebe, Josh West and Niels Hovius for helpful discussions. A. Dosseto acknowledges an Australian Research Council Future Fellowship FT0990447 and a University of Wollongong URC Small Grant.
Editor: Eric H. Oelkers
top
References
Bayon, G., Dennielou, B., Etoubleau, J., Ponzevera, E., Toucanne, S., Bermell, S. (2012) Intensifying Weathering and Land Use in Iron Age Central Africa. Science 335, 1219-1222.
 Show in context
 Model simulations and geochemical studies of riverbourne material highlight either a temperature dependence (Walker et al., 1981), where warming promotes chemical weathering, or a predominance of other parameters like mechanical erosion (Raymo and Ruddiman, 1992; Gaillardet et al., 1999; Riebe et al., 2001; Donnadieu et al., 2004) and vegetation (Bayon et al., 2012).
View in article
 Show in context
 Chemical weathering of continental rocks plays a central role in regulating the carbon cycle and the Earth's climate (Walker et al., 1981; Berner et al., 1983), accounting for nearly half the consumption of atmospheric carbon dioxide globally (Beaulieu et al., 2012).
View in article
More recently, modelling studies have shown that the weathering engine can respond extremely rapidly (<100 yr) to climate change and may act as a key component in the atmospheric CO2 level short-term regulation (Beaulieu et al., 2012).
View in article
Recently, Beaulieu et al. (2012) have shown that at the decadal/centennial scale, the chemical weathering response, dominated by carbonate weathering, is sensitive to both runoff and temperature.
View in article
 Show in context
 Chemical weathering of continental rocks plays a central role in regulating the carbon cycle and the Earth's climate (Walker et al., 1981; Berner et al., 1983), accounting for nearly half the consumption of atmospheric carbon dioxide globally (Beaulieu et al., 2012).
View in article
It has long been recognised that the dissolution of minerals, chemical weathering, can act as a long-term (>1 Ma) feedback on the Earth's climate (Walker et al., 1981; Berner et al., 1983; Donnadieu et al., 2004).
View in article
 Show in context
 The grey curve is the δ18OVPDB record from lacustrine sediments in the Goriganga basin (right y-axis), 100 km east of the study area.
View in article
This oxygen isotope record is consistent with an intensification of the monsoon between 25 and 10 ka ago, as suggested by most studies (Goodbred and Kuehl, 2000; Sanyal and Sinha, 2010; Beukema et al., 2011).
View in article
The grey curve is the δ118OVPDB record from lacustrine sediments in the Goriganga basin (right y-axis) (Beukema et al., 2011).
View in article
 Show in context
 Alternatively, variations in Sr isotopes can reflect changes in weathering conditions since minerals with different susceptibility to weathering display different 87Sr/86Sr ratios (Blum et al., 1993; Colin et al., 1999).
View in article
For instance, Blum et al. (1993) have highlighted a significant dissolution of high 87Sr/86Sr phases in glaciated areas. Bulk sediments from the three regions studied show a correlation between their 87Sr/86Sr and mineralogical content, such as micas and orthoclase (Fig. S-7).
View in article
 Show in context
 However, as the monsoon intensified between 25 and 10 ka ago (Sanyal and Sinha, 2010), moisture penetrated further north, promoting erosion in the HHC, as demonstrated for the Sutlej River (Bookhagen et al., 2005).
View in article
It has been proposed that a significant increase in erosion rates accompanied monsoon intensification in the Himalaya since the end of the LGM, mainly via increased runoff (Bookhagen et al., 2005; Clift et al., 2008) and its effect on landsliding and fluvial incision.
View in article
 Show in context
 While little isotope fractionation occurs during mineral dissolution, clay formation induces strong fractionations at low temperature, whereby 6Li is preferentially incorporated into clays compared to 7Li, resulting in a strong enrichment of 7Li in waters (Burton and Vigier, 2011). Thus, it has been shown that the δ7Li composition of natural waters can be used as a proxy for chemical weathering rates at the catchment scale, since the heaviest δ7Li compositions in water are associated with the areas characterised by low catchment-wide silicate weathering rates (Fig. 1). Several studies have also shown that the δ7Li composition of solid weathering products (i.e. soils, river sediments) is sensitive to chemical weathering conditions, where lower δ7Li values reflect more intensive leaching (Burton and Vigier, 2011).
View in article
Most samples show low δ7Li values best explained by significant 6Li enrichment during clay formation (Burton and Vigier, 2011).
View in article
 Show in context
 It has been proposed that a significant increase in erosion rates accompanied monsoon intensification in the Himalaya since the end of the LGM, mainly via increased runoff (Bookhagen et al., 2005; Clift et al., 2008) and its effect on landsliding and fluvial incision.
View in article
 Show in context
 Alternatively, variations in Sr isotopes can reflect changes in weathering conditions since minerals with different susceptibility to weathering display different 87Sr/86Sr ratios (Blum et al., 1993; Colin et al., 1999). For instance, Blum et al. (1993) have highlighted a significant dissolution of high 87Sr/86Sr phases in glaciated areas.
View in article
 Show in context
 It has long been recognised that the dissolution of minerals, chemical weathering, can act as a long-term (>1 Ma) feedback on the Earth's climate (Walker et al., 1981; Berner et al., 1983; Donnadieu et al., 2004).
View in article
 Show in context
 As a first approximation, since Li isotope fractionation during clay formation is temperature-dependent (Vigier et al., 2008), δ7Li variations in clays could potentially reflect mean temperature change since the Last Glacial Maximum (LGM). Warming since the LGM has been estimated between 4 and 7 °C (Farrera et al., 1999).
View in article
 Show in context
 Model simulations and geochemical studies of riverbourne material highlight either a temperature dependence (Walker et al., 1981), where warming promotes chemical weathering, or a predominance of other parameters like mechanical erosion (Raymo and Ruddiman, 1992; Gaillardet et al., 1999; Riebe et al., 2001; Donnadieu et al., 2004) and vegetation (Bayon et al., 2012).
View in article
 Show in context
 The strontium (Sr) isotope composition of bulk sediments also shows systematic variations with time, similar to that of δ7Li (Fig. 3). Strontium isotopes have been used to study changes in the provenance of sediments, on the basis of different 87Sr/86Sr ratios in the source rocks found in the catchment (Galy and France-Lanord, 1999).
View in article
 Show in context
 This oxygen isotope record is consistent with an intensification of the monsoon between 25 and 10 ka ago, as suggested by most studies (Goodbred and Kuehl, 2000; Sanyal and Sinha, 2010; Beukema et al., 2011).
View in article
 Show in context
 To address this question, another possible approach consists in investigating past continental environments through the study of marine or floodplain deposits. However, because in large river systems sediment transport and storage operates over >104 yr timescales (Granet et al., 2010), a significant time lag may exist between the time when sediments acquired their geochemical characteristics, reflecting palaeoenvironmental conditions, and their final deposition.
View in article
 Show in context
 Thus, clay δ7Li compositions as low as -4 ‰ between 30 and 25 ka are significantly lower than both the average values for unweathered continental rocks and published values for Himalayan river bedload sediments (Kisakűrek et al., 2005).
View in article
Several studies have shown that the δ7Li values measured in river waters and soils decrease with increasing chemical weathering rates at the scale of the watershed or the soil profile (Fig. 1; Kisakűrek et al., 2005; Vigier et al., 2009; Millot et al., 2010).
View in article
In addition, the low δ7Li values of clay-sized fractions support an enrichment in 6Li in secondary phases during chemical weathering (Kisakűrek et al., 2005).
View in article
 Show in context
 Distinguishing between the two factors can be challenging, since they are often linked to each other (Labat et al., 2004).
View in article
 Show in context
Insets show data for river waters from the Mackenzie basin in Canada (Millot et al., 2010) and from the basaltic basins of Iceland (Vigier et al., 2009).
View in article
Several studies have shown that the δ7Li values measured in river waters and soils decrease with increasing chemical weathering rates at the scale of the watershed or the soil profile (Fig. 1; Kisakűrek et al., 2005; Vigier et al., 2009; Millot et al., 2010).
View in article
As a first approximation, using the relationship between water δ7Li and weathering rates (Vigier et al., 2009; Millot et al., 2010), this change in δ7Liwater would translate to a decrease in silicate weathering rates by an order of magnitude (using the regression for the Mackenzie data, Fig. 1 and Δ7Liclay-water = -17 ‰; Vigier et al., 2008).
View in article
 Show in context
 Comparison with a global palaeo-climatic record is illustrated with the grey curve, showing the NGRIP ice core δ18O record from Greenland for the same period (North Greenland Ice Core Project members, 2004).
View in article
 Show in context
 Here we use the lithium (Li) isotopic composition of clays from sedimentary records in Himalayan basins to determine how chemical weathering intensity has varied over the past 40 ka and particularly since the Last Glacial Maximum (locally older than 24 ka; Owen et al., 2002).
View in article
 Show in context
 Average 87Sr/86Sr ratios for the Higher Himalaya Crystallines (HHC) and the Lesser Himalayas (LH) are significantly different: 0.76 ± 0.03 and 0.85 ± 0.09, respectively (Rahaman et al., 2009).
View in article
 Show in context
 Depositional ages for the alluvial deposits reported here were previously constrained by optically-stimulated luminescence (OSL) dating and range from 9 to 41 ka (Singh et al., 2001; Ray and Srivastava, 2010).
View in article
 Show in context
 Model simulations and geochemical studies of riverbourne material highlight either a temperature dependence (Walker et al., 1981), where warming promotes chemical weathering, or a predominance of other parameters like mechanical erosion (Raymo and Ruddiman, 1992; Gaillardet et al., 1999; Riebe et al., 2001; Donnadieu et al., 2004) and vegetation (Bayon et al., 2012).
View in article
 Show in context
 Model simulations and geochemical studies of riverbourne material highlight either a temperature dependence (Walker et al., 1981), where warming promotes chemical weathering, or a predominance of other parameters like mechanical erosion (Raymo and Ruddiman, 1992; Gaillardet et al., 1999; Riebe et al., 2001; Donnadieu et al., 2004) and vegetation (Bayon et al., 2012).
View in article
 Show in context
 The light green curve represents the precipitation changes in the SW Indian Monsoon for South Asia (green axis graduated from -20 to 20 %; Sanyal and Sinha, 2010 and references therein).
View in article
This oxygen isotope record is consistent with an intensification of the monsoon between 25 and 10 ka ago, as suggested by most studies (Goodbred and Kuehl, 2000; Sanyal and Sinha, 2010; Beukema et al., 2011).
View in article
However, as the monsoon intensified between 25 and 10 ka ago (Sanyal and Sinha, 2010), moisture penetrated further north, promoting erosion in the HHC, as demonstrated for the Sutlej River.
View in article
 Show in context
 Depositional ages for the alluvial deposits reported here were previously constrained by optically-stimulated luminescence (OSL) dating and range from 9 to 41 ka (Singh et al., 2001; Ray and Srivastava, 2010).
View in article
 Show in context
 The black curve represents the δ18OSMOW record from the Guliya ice core on the Qinghai-Tibetan Plateau (right y-axis) (Thompson et al., 1997).
View in article
An intimate link between climate and weathering in this region appears when comparing clay δ7Li and the oxygen isotope compositions recorded by the Guliya ice core from the Qinghai-Tibetan Plateau (Fig. 2; Thompson et al., 1997).
View in article
The error on 87Sr/86Sr ratios is smaller than the symbol size. The black curve represents the δ18OSMOW record from the Guliya ice core on the Qinghai-Tibetan Plateau (right y-axis) (Thompson et al., 1997).
View in article
 Show in context
 It then remains into these sites even after intensive (hydrothermal) treatment Vigier et al., 2008).
View in article
As a first approximation, since Li isotope fractionation during clay formation is temperature-dependent (Vigier et al., 2008), δ7Li variations in clays could potentially reflect mean temperature change since the Last Glacial Maximum (LGM).
View in article
Experimental data indicate that this temperature increase could induce an increase in δ7Li between 0.5 and 0.9 ‰ in the solid
View in article
As a first approximation, using the relationship between water δ7Li and weathering rates (Vigier et al., 2009; , this change in δ7Liwater would translate to a decrease in silicate weathering rates by an order of magnitude (using the regression for the Mackenzie data, Fig. 1 and Δ7Liclay-water = -17 ‰; Vigier et al., 2008).
View in article
 Show in context
 Thus, low δ7Li values are indicative of fast weathering rates. Insets show data for river waters from the Mackenzie basin in Canada and from the basaltic basins of Iceland (Vigier et al., 2009).
View in article
Several studies have shown that the δ7Li values measured in river waters and soils decrease with increasing chemical weathering rates at the scale of the watershed or the soil profile (Fig. 1; Kisakűrek et al., 2005; Vigier et al., 2009; Millot et al., 2010).
View in article
It is possible to estimate the corresponding magnitude of changes in silicate weathering rates using a constant clay-water fractionation: an increase of clay δ7Li from -4 ‰ to +3 ‰ corresponds to an increase of water δ7Li of 7 ‰ for the considered period. As a first approximation, using the relationship between water δ7Li and weathering rates (Vigier et al., 2009; Millot et al., 2010), this change in δ7Liwater would translate to a decrease in silicate weathering rates by an order of magnitude (using the regression for the Mackenzie data, Fig. 1 and Δ7Liclay-water = -17 ‰; Vigier et al., 2008).
View in article
 Show in context
 Chemical weathering of continental rocks plays a central role in regulating the carbon cycle and the Earth's climate (Walker et al., 1981; Berner et al., 1983), accounting for nearly half the consumption of atmospheric carbon dioxide globally (Beaulieu et al., 2012).
View in article
It has long been recognised that the dissolution of minerals, chemical weathering, can act as a long-term (>1 Ma) feedback on the Earth's climate (Walker et al., 1981; Berner et al., 1983; Donnadieu et al., 2004).
View in article
Chemical weathering of continental rocks plays a central role in regulating the carbon cycle and the Earth's climate (Walker et al., 1981; Berner et al., 1983), accounting for nearly half the consumption of atmospheric carbon dioxide globally (Beaulieu et al., 2012).
View in article
Model simulations and geochemical studies of riverbourne material highlight either a temperature dependence (Walker et al., 1981), where warming promotes chemical weathering, or a predominance of other parameters like mechanical erosion (Raymo and Ruddiman, 1992; Gaillardet et al., 1999; Riebe et al., 2001; Donnadieu et al., 2004) and vegetation (Bayon et al., 2012).
View in article
This decrease in chemical weathering rates coeval with global warming since the end of the LGM runs counter to the expectation that chemical weathering is promoted by warmer and wetter conditions (Walker et al., 1981).
View in article
top
Supplementary Information
Sediments were collected from three regions: the upper Yamuna River basin, the Alaknanda River basin and the Donga Fan. In these regions, sediments are derived from two main lithological units: (i) the Higher Himalaya Crystallines (HHC) to the north, in the upper part of the Yamuna and the Alaknanda, are composed mainly of high-grade metamorphic rocks and intrusions of leucogranites; (ii) the Lesser Himalaya (LH) in the outer part of the range is composed mainly of low-grade metasedimentary rocks, limestones and orthogneisses (Fort, 1989)
Fort, P. (1989) The Himalayan Orogenic Segment. In: Şengör, A.M.C. (Eds.) Tectonic Evolution of the Tethyan Region. Springer Netherlands, 289-386.
. The Yamuna and Alaknanda rivers mainly drain the HHC, and the LH to a lesser extent. Sediments coming from the Tethyan Sedimentary Series (TSS) area do not contribute significantly to their sediment budgets (Rahaman et al., 2009)Rahaman, W., Singh, S.K., Sinha, R., Tandon, S.K. (2009) Climate control on erosion distribution over the Himalaya during the past ~100 ka. Geology 37, 559-562.
. The Donga Fan collects sediments from the LH only (Singh et al., 2001)Singh, A.K., Parkash, B., Mohindra, R., Thomas, J.V., Singhvi, A.K. (2001) Quaternary alluvial fan sedimentation in the Dehradun Valley Piggyback Basin, NW Himalaya: tectonic and palaeoclimatic implications. Basin Research 13, 449-471.
.The clay-sized fraction was selected as: (i) clays have high Li concentrations (20-90 ppm; Table S-1) and are susceptible to record environmental conditions (e.g., temperature, chemistry) during their formation (Vigier et al., 2008
Vigier, N., Decarreau, A., Millot, R., Carignan, J., Petit, S., France-Lanord, C. (2008) Quantifying Li isotope fractionation during smectite formation and implications for the Li cycle. Geochimica et Cosmochimica Acta 72, 780-792.
; Burton and Vigier, 2011Burton, K.W., Vigier, N. (2011) Lithium Isotopes as Tracers in Marine and Terrestrial Environments. In: Baskaran, M. (Eds.) Handbook of Environmental Isotope Geochemistry. Springer Berlin Heidelberg, 41-59.
). (ii) By choosing a narrow range of sediment particle size, geochemical variability as a result of hydrodynamic sorting during sediment transport is minimised, although this study focuses on fluvial terraces and alluvial deposits in or at the outer fringe of the Himalayan range where the flow is turbulent in mountainous rivers and there is therefore little hydrodynamic sorting (Lupker et al., 2011)Lupker, M., France-Lanord, C., Lavé, J., Bouchez, J., Galy, V., Métivier, F., Gaillardet, J., Lartiges, B., Mugnier, J.-L. (2011) A Rouse-based method to integrate the chemical composition of river sediments: application to the Ganga basin. Journal of Geophysical Research 116, F04012.

Figure S-1 Map of the study area. Yellow pushpins show the sample locations. The grey area shows the Donga Fan. The yellow star in the inset represents the location of the study area in India. Satellite image source: Cnes/Spot image from Google Earth™.
Sample descriptions
Field description of sampling locations is presented below, subdivided in the three studied regions: (i) alluvial deposits from the Donga Fan, located at the foothills of the Himalaya between the Ganges and the Yamuna rivers, (ii) terraces of the Alaknanda River, in the Lesser Himalaya and (iii) terraces of the Yamuna River as it exits the Himalayan Range (Fig. S-1).Donga Fan
Two samples were collected from terraces of the Suarna River in the proximal part of the Donga Fan (Fig. S-2): IND02 and IND03 from terraces termed ST1 and ST6 and dated at 10.7 ± 2.4 ka and 29.4 ± 1.7 ka, respectively in Singh et al. (2001). IND02 is mostly coarse sand collected between subrounded cobbles, and IND03 is also mostly coarse sand collected between subrounded cobbles and gravels.
IND04 was collected from near the base of an alluvial fan deposit, termed section D3 and dated at 20.3 ± 7.5 ka (Singh et al., 2001)
Singh, A.K., Parkash, B., Mohindra, R., Thomas, J.V., Singhvi, A.K. (2001) Quaternary alluvial fan sedimentation in the Dehradun Valley Piggyback Basin, NW Himalaya: tectonic and palaeoclimatic implications. Basin Research 13, 449-471.
. It is composed of coarse grains with abundant subrounded gravels and cobbles. For all Donga Fan samples, sorting is absent and there is no sign of imbrication or other sedimentation features.
Figure S-2 Google Earth™ image of Donga Fan and Yamuna River sampling locations. The grey area shows the Donga Fan. Flow is from the top to the bottom of the image. Vertical exaggeration is 3x.
Samples were collected from a set of four terraces of the Yamuna River (Fig. S-2), where the river exits the Himalayan Range. IND06-4.90 and IND06-5.50 were collected at depth of 4.90 and 5.50 m, respectively, in the terrace termed YT2 and dated at 8.9 ± 1.9 ka (Singh et al., 2001)
Singh, A.K., Parkash, B., Mohindra, R., Thomas, J.V., Singhvi, A.K. (2001) Quaternary alluvial fan sedimentation in the Dehradun Valley Piggyback Basin, NW Himalaya: tectonic and palaeoclimatic implications. Basin Research 13, 449-471.
. At this site, sediment is mostly composed of subrounded cobbles with no significant sorting and silt to coarse sand material. IND07 was collected at a depth of 2.55 m in terrace termed YT3 and dated at 9.5 ± 2.3 ka (Singh et al., 2001)Singh, A.K., Parkash, B., Mohindra, R., Thomas, J.V., Singhvi, A.K. (2001) Quaternary alluvial fan sedimentation in the Dehradun Valley Piggyback Basin, NW Himalaya: tectonic and palaeoclimatic implications. Basin Research 13, 449-471.
. Sediment is composed mostly of rounded cobbles with coarse sand and silt. IND08-2.60 was collected at a depth of 2.60 m in terrace termed YT4 and dated at 10.7 ± 2.2 ka (Singh et al., 2001)Singh, A.K., Parkash, B., Mohindra, R., Thomas, J.V., Singhvi, A.K. (2001) Quaternary alluvial fan sedimentation in the Dehradun Valley Piggyback Basin, NW Himalaya: tectonic and palaeoclimatic implications. Basin Research 13, 449-471.
. Sediment is composed mostly of rounded cobbles and boulders with coarse sand and silt.Alaknanda River terraces
Terraces of the Alaknanda River were sampled at four locations, from upstream to downstream: Gaucher, Nagrasu, Rudraprayag and Srinagar (Fig. S-3).

Figure S-3 Google Earth™ image of the Alaknanda River terrace sampling locations. From top to bottom: Gaucher (IND51), Nagrasu (IND54), Rudraprayag (IND57-59) and Srinagar (IND62, 64, 65, 72 and 73). Flow is from top to bottom of the image. Vertical exaggeration is 3x.
Ray, Y., Srivastava, P. (2010) Widespread aggradation in the mountainous catchment of the Alaknanda-Ganga River System: timescales and implications to Hinterland-foreland relationships. Quaternary Science Reviews 29, 2238-2260.
, in a sand layer showing cross-bedding and bounded by two horizons of rounded cobbles and gravels.IND54 was collected from terrace T1 at Nagrasu, dated at 13 ± 2 ka (Ray and Srivastava, 2010)Ray, Y., Srivastava, P. (2010) Widespread aggradation in the mountainous catchment of the Alaknanda-Ganga River System: timescales and implications to Hinterland-foreland relationships. Quaternary Science Reviews 29, 2238-2260.
, in a sand horizon bounded by rounded boulders and cobbles. The sampling depth was estimated to be 4 m. IND57 was collected near the bottom of the terrace at Rudraprayag, 17.7 m below the surface of the terrace, in a massive sand horizon (thickness > 5 m) and dated at 41 ± 5 ka (Ray and Srivastava, 2010)Ray, Y., Srivastava, P. (2010) Widespread aggradation in the mountainous catchment of the Alaknanda-Ganga River System: timescales and implications to Hinterland-foreland relationships. Quaternary Science Reviews 29, 2238-2260.
. IND58 was collected in the vertical middle part of the terrace at Rudraprayag, dated at 35 ± 6 ka (Ray and Srivastava, 2010)Ray, Y., Srivastava, P. (2010) Widespread aggradation in the mountainous catchment of the Alaknanda-Ganga River System: timescales and implications to Hinterland-foreland relationships. Quaternary Science Reviews 29, 2238-2260.
, 6.5 m below the surface. The sample was mainly coarse sand collected between large rounded cobbles. IND59 was collected near the top of the terrace at Rudraprayag, dated at 18 ± 3 ka (Ray and Srivastava, 2010)Ray, Y., Srivastava, P. (2010) Widespread aggradation in the mountainous catchment of the Alaknanda-Ganga River System: timescales and implications to Hinterland-foreland relationships. Quaternary Science Reviews 29, 2238-2260.
, in a homogeneous sand horizon similar to that found in the lower part of the terrace. Sampling depth was 3.20 m. At Srinagar, samples were collected from five terraces out of six described in Ray and Srivastava (2010)Ray, Y., Srivastava, P. (2010) Widespread aggradation in the mountainous catchment of the Alaknanda-Ganga River System: timescales and implications to Hinterland-foreland relationships. Quaternary Science Reviews 29, 2238-2260.
: IND64 was taken in terrace T2, dated at 17 ± 2 ka (Ray and Srivastava, 2010)Ray, Y., Srivastava, P. (2010) Widespread aggradation in the mountainous catchment of the Alaknanda-Ganga River System: timescales and implications to Hinterland-foreland relationships. Quaternary Science Reviews 29, 2238-2260.
, about 15 m below the surface. The sample was collected from a 20-30 cm-thick sand horizon showing no sedimentation features and bounded by poorly sorted rounded cobbles. IND65 was collected in terrace T5 about 10 m below the surface. This part of the terrace was dated at 14 ± 1 ka, while the lower part of T5 was dated at 15 ± 2 ka (Ray and Srivastava, 2010)Ray, Y., Srivastava, P. (2010) Widespread aggradation in the mountainous catchment of the Alaknanda-Ganga River System: timescales and implications to Hinterland-foreland relationships. Quaternary Science Reviews 29, 2238-2260.
. The sample was taken from a sand horizon ~8 m thick, bounded by poorly sorted rounded cobbles and gravels. IND62 was collected from terrace T4, 20-30 m below the surface. No depositional age was determined for this terrace. However, Ray and Srivastava (2010)Ray, Y., Srivastava, P. (2010) Widespread aggradation in the mountainous catchment of the Alaknanda-Ganga River System: timescales and implications to Hinterland-foreland relationships. Quaternary Science Reviews 29, 2238-2260.
described terraces T2 through T5 as a cut-and-fill terrace. Thus, the age of T4 should be intermediate to that of T2 and T5, and a value of 16 ± 1 ka was assigned. The sample was taken from a 20-30 cm thick sand horizon overlain by poorly sorted subrounded cobbles and gravels.IND72 was collected 6 m below the surface in terrace T6, dated at 26 ± 4 ka (Ray and Srivastava, 2010)Ray, Y., Srivastava, P. (2010) Widespread aggradation in the mountainous catchment of the Alaknanda-Ganga River System: timescales and implications to Hinterland-foreland relationships. Quaternary Science Reviews 29, 2238-2260.
. The sample was taken from a sandy-silty horizon showing no sedimentation features and at least 10 m thick. IND73T was taken at a depth of 3.80 m in terrace T1 (two other samples, IND73M and IND73B, were collected at different depths but not analysed). This terrace was not directly dated but is younger than the cut-and-fill terrace, which youngest age is 14 ± 1 ka. Thus, an age of 7 ± 7 ka was assigned to IND73T.Methods
Samples were air-dried and sieved at 2 mm. The size fraction smaller than 2 mm was retained and is termed “bulk” throughout this article. Mineralogical quantification was performed by X-ray diffraction at University of Wollongong. Dry bulk samples were crushed to <4 μm with a Tollmill crusher (TEMA). The samples were then mounted in aluminium holders and placed in a Phillips 1130/90 diffractometer with Spellman DF3 generator set to 1 kW. They were loaded and analysed through an automatic sample holder. The 1 kW energy is achieved by setting the diffractometer to 35 kV and 28.8 mA. Samples were analysed between 4 and 70° 2-theta at 2° per minute with a step size of 0.02. Traces were produced through a GBC 122 control system and analysed using Traces, UPDSM and SIROQUANT softwares.Bulk samples were analysed for particle size distribution using a Malvern Mastersizer at University of Wollongong. This was used to determine the quantity of bulk material required to obtain ~100 mg of clay-sized (<2 μm) sediment. An aliquot of the required mass was sub-sampled and the clay fraction was separated by controlled centrifugation (Poppe et al., 2001)
Poppe, L.J., Paskevich, V.F., Hathaway, J.C., Blackwood, D.S. (2001) A laboratory manual for X-Ray powder diffraction. USGS Open-File Report, 01-041.
(termed thereafter “clay-sized fraction”).For strontium isotope analysis, samples were prepared at the Wollongong Isotope Geochronology Laboratory, University of Wollongong. An aliquot of bulk sediment was ashed at 350 °C to destroy organic matter and then leached with 1.5 M HCl at ambient temperature in an ultrasonic bath to remove calcium carbonates. The sample was then dissolved in a mixture of concentrated HF, HNO3 and HCl at 130 °C overnight. Solutions were then dried at 80 °C and residues re-dissolved twice in concentrated HNO3 to drive off fluorides. After drying, samples were redissolved in 1 M HNO3 and loaded on an ion-exchange column packed with 0.2 mL of Eichrom Sr resin over 0.1 mL of Eichrom Pre-filter resin. Strontium was eluted in 0.02 M HNO3. Isotopic measurements were performed on a ThermoScientific Neptune multi-collector ICPMS at the Research School of Earth Sciences, The Australian National University. Synthetic standard SRM987 was regularly analysed to assess accuracy. Total procedure blanks were <200 pg, which is negligible compared to the amount of Sr processed (between 2 and 10 μg).For lithium isotope analysis, sample preparation was undertaken at the School of Ocean and Earth Science and Technology, University of Hawai'i at Mānoa for bulk sediments, and at the Centre de Recherches Pétrographiques et Géochimiques (CRPG) for clay-sized fractions. Aliquots of bulk sediment were weighed and dissolved in a mixture of concentrated HF, HNO3 and HCl at 130 °C for 12 hours. Solutions were then dried at 80 °C and residues re-dissolved several times in concentrated HNO3 to remove fluorides. After drying, residues were re-dissolved in 5 % HNO3 and solutions were sub-sampled to determine Li concentrations.
For clay-sized fractions, exchangeable Li was removed using 1M acetate ammonium (10 ml for 50 mg of clay), agitated during 1 hour, repeated 3 times. The residue was separated by centrifugation and rinsed with water before dissolution with concentrated acids, following the same procedure as for bulk sediments.
Lithium concentrations for bulk sediments were determined using a ThermoScientific Element ICP-MS at the School of Ocean and Earth Science and Technology, University of Hawai'i at Mānoa. Two reference materials (BCR-1, a basalt supplied by US Geological Survey, and JR-1, a rhyolite supplied by the Geological Survey of Japan) were used for calibration and run with Li concentrations of 20 and 200 ppb, respectively. An internal standard with 0.5 ppb of B, In and Sn was added to the samples to correct for beam drift during analysis. Blank correction was performed by analysing 5 % HNO3 before each standard or sample measurement. Lithium concentrations for clay-sized fractions were determined using an Elan 6000 ICP-MS at the CRPG and the SARM French National Facilities.
Lithium isotopic analysis requires purification by chromatography before measurement. We used the procedure described in Millot et al. (2004)
Millot, R., Guerrot, C., Vigier, N. (2004) Accurate and high-precision measurement of lithium isotopes in two reference materials by MC-ICP-MS. Geostandards and Geoanalytical Research 28, 153-159.
, Vigier et al. (2008)Vigier, N., Decarreau, A., Millot, R., Carignan, J., Petit, S., France-Lanord, C. (2008) Quantifying Li isotope fractionation during smectite formation and implications for the Li cycle. Geochimica et Cosmochimica Acta 72, 780-792.
, where 2.4 mL of AG50XR cation exchange resin is used. Before loading samples on the column in 0.5 mL of 1 M HCl, the Li concentration in the solutions were adjusted to ~120 ppb.The 7Li/6Li ratios were measured on a ThermoScientific Neptune Plus at the Centre de Recherches Pétrographiques et Géochimiques (CRPG) for clay-sized fractions, and on a Nu Instruments™ high resolution multi-collector ICP-MS at the School of Ocean and Earth Science and Technology, University of Hawai'i at Mānoa, for the bulk sediments. To correct for mass bias, we used a standard bracketing technique, normalising isotope ratios to the LSVEC standard, in wet plasma, multicollection and low resolution. Solutions were diluted to 5 ppb, which typically resulted in a 7Li beam of 5 V. The carryover of the 7Li signal typically increased from 10 to 40 mV during the course of the day. This corresponds to a maximum contribution of analysis blank of 0.5 %. This contribution is deduced for each sample by measuring the dilution acid (0.05 M HNO3) before each standard and sample analysis.Total procedure blanks were below detection limit (20 pg). Accuracy of the isotope measurements was checked using Li-7N in-house standard solutions (Carignan et al., 2007)
Carignan, J., Vigier, N., Millot, R. (2007) Three secondary reference materials for lithium isotope measurements: Li7-N, Li6-N and LiCl-N solutions. Geostandards and Geoanalytical Research 31, 7-12.
. The JG-2 granite reference material was also measured for validating the chemical procedure used for these samples. Mean δ7Li value for the Li7-N solution was 30.3 ± 0.21 ‰ (2σ, n=7). The average δ7Li value for the JG-2 reference material was -1.3 ± 0.7 ‰ (2SD). The external analytical uncertainty on δ7Li was estimated by replicate analysis of two bulk sediments (± 0.5 ‰; 2SD).The δ7Li values were calculated by normalising measured 7Li/6Li ratios to L-SVEC standard (Millot et al., 2004)
Millot, R., Guerrot, C., Vigier, N. (2004) Accurate and high-precision measurement of lithium isotopes in two reference materials by MC-ICP-MS. Geostandards and Geoanalytical Research 28, 153-159.
: 

Figure S-4 δ7Li values in clay-sized fractions (full symbols) and bulk sediments (open symbols). Clay-sized fractions show that δ7Li values reach a minimum shortly before the Last Glacial Maximum. This is supported by bulk sediments, although variations are much more dampened. Diamonds: Alakanda, squares: Yamuna, triangles: Donga Fan. The thick dark and light grey curves represent the schematic variation of δ7Li compositions with time for the clay-sized fraction and the bulk sediments, respectively. The horizontal grey line shows the average δ7Li value for the continental crust (Teng et al., 2004
Teng, F.Z., McDonough, W.F., Rudnick, R.L., Dalpé, C., Tomascak, P.B., Chappell, B.W., Gao, S. (2004) Lithium isotopic composition and concentration of the upper continental crust. Geochimica et Cosmochimica Acta 68, 4167-4178.
, 2009Teng, F.Z., Rudnick, R.L., McDonough, W.F., Wu, F.-Y. (2009) Lithium isotopic systematics of A-type granites and their mafic enclaves: Further constraints on the Li isotopic composition of the continental crust. Chemical Geology 262, 370-379.
).
Figure S-5 δ7Li values in clay-sized fractions as a function of sampling depth. No significant trend can be highlighted, supporting the lack of significant post-deposition alteration for the studied samples.

Figure S-6 87Sr/86Sr ratios in bulk sediment as a function of the distance from the divide for the Donga Fan (triangle), Yamuna (squares) and Alaknanda (diamonds). If 87Sr/86Sr ratios were controlled by sediment provenance only, i.e. which rock types they are derived from, Donga Fan sediments should display the highest 87Sr/86Sr values because they only originate from the LH where rocks are characterised by high 87Sr/86Sr ratios (see text for details). Similarly, the 87Sr/86Sr ratio should increase downstream for the Alaknanda as the river flows from the moderately radiogenic HHC into the very radiogenic LH. However the opposite is observed.

Figure S-7 87Sr/86Sr ratios vs (a) micas and (b) orthoclase contents in bulk sediments. The correlations suggest that 87Sr/86Sr values are controlled by the dissolution of biotite and muscovite, rather than changes in sediment provenance. Errors on 87Sr/86Sr ratios are smaller than the symbol size. Relative errors on mineral contents are less than 5 %.

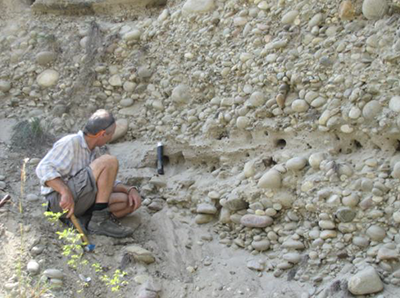
Figure S-8 Example of fluvial deposit sampled: IND64, Srinagar terrace T2, dated at 17 ± 2 ka (Ray and Srivastava, 2010)
Ray, Y., Srivastava, P. (2010) Widespread aggradation in the mountainous catchment of the Alaknanda-Ganga River System: timescales and implications to Hinterland-foreland relationships. Quaternary Science Reviews 29, 2238-2260.
. This terrace is part of a set of six terraces of the Alaknanda River in the Srinagar valley. The deposit consists of 15-20 m of rounded cobbles and boulders showing no preferential imbrication direction and intercalated with sand layers. There is no evidence of post-depositional alteration with neither soil development nor iron oxide staining of the sediment. The sample was collected 15 m below the deposit's surface, in a sand layer.Table S-1 Lithium and strontium isotopic data for Himalayan fluvial deposits.
Errors are on Li concentrations, δ7Li and 87Sr/86Sr ratios are internal analytical uncertainties.
| Sample name | Site | Sampling depth (m) | Deposition age (ka) | 2σ | Li (ppm) | 2σ | δ7Li | 2V | 87Sr/86Sr | 2σ | |
| IND02 | Suarna T1 | 22 | 10.7 | 2.4 | Bulk sediment | 12.83 | 0.07 | 1.08 | 0.05 | 0.797089 | 0.000013 |
| IND03 | Suarna T5 | 4.65 | 29.4 | 1.7 | Bulk sediment Clay-sized fraction | 17.61 46.30 | 0.13 | -3.97 | 0.50 | ||
| IND04 | Donga Fan section D3 | 20 | 20.3 | 7.5 | Bulk sediment | 18.78 | 0.07 | -0.37 | 0.02 | 0.783569 | 0.000015 |
| IND06-4.90 | Yamuna YT2 | 4.9 | 8.9 | 1.9 | Bulk sediment | 16.05 | 0.18 | 1.98 | 0.10 | 0.804151 | 0.000012 |
| IND06-5.50 | Yamuna YT2 | 5.5 | 8.9 | 1.9 | Bulk sediment Clay-sized fraction | 50.72 | 1.56 2.71 | 0.08 0.50 | |||
| IND07 | Yamuna YT3 | 2.55 | 9.5 | 2.3 | Bulk sediment | 13.31 | 0.05 | -0.18 | 0.01 | 0.786227 | 0.000011 |
| IND08-2.60 replicate replicate | Yamuna YT4 | 2.6 | 10.7 | 2.2 | Bulk sediment Bulk sediment Bulk sediment | 11.41 | 0.01 | 0.79 0.83 0.76 | 0.04 0.04 0.04 | ||
| IND51 | Gaucher T3 | 20 | 37 | 4 | Bulk sediment | 0.57 | 0.03 | ||||
| IND54 | Nagrasu T1 | 4 | 13 | 2 | Bulk sediment Clay-sized fraction | 60.87 | -0.11 -1.65 | 0.01 0.50 | |||
| IND57 | Rudraprayag bottom | 17.7 | 41 | 5 | Bulk sediment Clay-sized fraction | 28.99 | 0.73 -0.99 | 0.04 0.50 | 0.912562 | 0.000011 | |
| IND58 | Rudraprayag middle | 6.5 | 35 | 6 | Bulk sediment Clay-sized fraction | 55.07 | 1.23 -0.21 | 0.06 0.50 | 0.858146 | 0.000013 | |
| IND59 | Rudraprayag top | 3.2 | 18 | 3 | Bulk sediment Clay-sized fraction | 17.68 | 0.76 | 0.50 | |||
| IND62 | Srinagar T4 | 20 | 16 | 1 | Bulk sediment Clay-sized fraction | 14.60 93.04 | 0.08 | -0.80 | 0.50 | ||
| IND64 | Srinagar T2 | 15 | 17 | 2 | Bulk sediment Clay-sized fraction | 15.66 91.16 | 0.04 | -0.46 -2.60 | 0.02 0.50 | 0.761572 | 0.000010 |
| IND65 | Srinagar T5 | 10 | 14 | 1 | Bulk sediment Clay-sized fraction | 17.96 84.93 | 0.08 | -1.54 0.22 | 0.08 0.50 | 0.774127 | 0.000009 |
| IND72 replicate | Srinagar T6 | 6 | 26 | 4 | Bulk sediment Bulk sediment Clay-sized fraction | 23.53 72.46 | 0.04 | -1.08 -1.10 -4.26 | 0.05 0.06 0.50 | 0.740728 | 0.000013 |
| IND73T | Srinagar T1 | 3.8 | 7 | 7 | Bulk sediment | 18.34 | 0.01 | 1.64 | 0.08 | 0.772868 | 0.000009 |
Table S-2 Mineralogical data.
| Sample name | Site | Quartz | Biotite | Muscovite | Albite | Anorthite | Orthoclase | Kaolinite | Chlorite | Gibbsite | Rutile | Titanite | Zircon |
| IND02 | Suarna T1 | 82 | 0.4 | 6.9 | 4.9 | 1.1 | 1.7 | <1 | <1 | <1 | 1.1 | ||
| IND04 | Donga Fan section D3 | 60 | 4.8 | 20 | 4.3 | 1.1 | 2.7 | 1.3 | <1 | 1.1 | 1.4 | 1.3 | |
| IND06-4.90 | Yamuna YT2 | 53 | 3.9 | 18 | 8.4 | 3.1 | 2.6 | <1 | 7.8 | <1 | <1 | ||
| IND07 | Yamuna YT3 | 58 | 1.9 | 10 | 14 | 4.5 | <1 | 8.8 | 1 | <1 | <1 | ||
| IND08-2.60 | Yamuna YT4 | 82 | 0.2 | 8.4 | 2.2 | 1.7 | 2.9 | <1 | <1 | 1.8 | |||
| IND64 | Srinagar T2 | 68 | 1.4 | 1.9 | 11 | 6.7 | 5.1 | <1 | <1 | 0.4 | <1 | 1.6 | <1 |
| IND65 | Srinagar T5 | 46 | 1.9 | 6.6 | 19 | 15 | 4.6 | <1 | 3.1 | 0.7 | <1 | <1 | <1 |
| IND73T | Srinagar T1 | 62 | 3.1 | 7.2 | 10 | 3.9 | 3.3 | 1.2 | 5.4 | 0.3 | <1 | <1 | <1 |
Table S-3 Compilation of Li isotopic composition for various rock types.
Errors are 2 standard errors re-calculated from published value.
| Rock type | δ7Li (‰) | error | Reference |
| Amphibolite | 4.8 | 1.4 | Teng et al., 2008 |
| Pegmatites | 4.5 | 2.6 | Teng et al., 2006 |
| Gneiss | 4.1 | 0.8 | Teng et al., 2008 |
| Granulite | 3.5 | 0.7 | Teng et al., 2008 |
| Granulite (stronalite) | 2.4 | 2.7 | Qiu et al., 2011 Chem Geol |
| Granites | 2.1 | 0.6 | Teng et al., 2009 |
| Bulk continental crust | 2 | 2 | Liu and Rudnick, 2011 |
| Regional amphibolites/schist | 2 | 1.0 | Liu et al., 2010 |
| Granites | 1.5 | 1.0 | Teng et al., 2006 |
| Schists | 0.8 | 2.6 | Teng et al., 2006 |
| Sub-greenschist facies | 0.5 | 0.7 | Qiu et al., 2011 EPSL |
| Mudrocks | 0.4 | 1.2 | Qiu et al., 2009 |
| Loess | 0.2 | 1.3 | Teng et al., 2004 |
| Greenschist facies | 0.2 | 0.2 | Qiu et al., 2011 EPSL |
| Granites | 0.0 | 0.8 | Teng et al., 2004 |
| Shales, greywackes and pelites | -0.3 | 0.9 | Teng et al., 2004 |
| Amphibolite (kinzigite) | -1.3 | 0.7 | Qiu et al., 2011 Chem Geol |
Supplementary Information References
 Show in context
 The clay-sized fraction was selected as: (i) clays have high Li concentrations (20-90 ppm; Table S-1) and are susceptible to record environmental conditions (e.g., temperature, chemistry) during their formation (Vigier et al., 2008; Burton and Vigier, 2011).
View in article
 Show in context
 Total procedure blanks were below detection limit (20 pg). Accuracy of the isotope measurements was checked using Li-7N in-house standard solutions (Carignan et al., 2007).
View in article
 Show in context
 In these regions, sediments are derived from two main lithological units: (i) the Higher Himalaya Crystallines (HHC) to the north, in the upper part of the Yamuna and the Alaknanda, are composed mainly of high-grade metamorphic rocks and intrusions of leucogranites; (ii) the Lesser Himalaya (LH) in the outer part of the range is composed mainly of low-grade metasedimentary rocks, limestones and orthogneisses.
View in article
 Show in context
 (ii) By choosing a narrow range of sediment particle size, geochemical variability as a result of hydrodynamic sorting during sediment transport is minimised, although this study focuses on fluvial terraces and alluvial deposits in or at the outer fringe of the Himalayan range where the flow is turbulent in mountainous rivers and there is therefore little hydrodynamic sorting (Lupker et al., 2011).
View in article
 Show in context
 Lithium isotopic analysis requires purification by chromatography before measurement. We used the procedure described in Millot et al. (2004), Vigier et al. (2008), where 2.4 mL of AG50XR cation exchange resin is used. Before loading samples on the column in 0.5 mL of 1 M HCl, the Li concentration in the solutions were adjusted to ~120 ppb.
View in article
The δ7Li values were calculated by normalising measured 7Li/6Li ratios to L-SVEC standard (Millot et al., 2004):
View in article
 Show in context
 An aliquot of the required mass was sub-sampled and the clay fraction was separated by controlled centrifugation (Poppe et al., 2001) (termed thereafter “clay-sized fraction”).
View in article
 Show in context
 Sediments coming from the Tethyan Sedimentary Series (TSS) area do not contribute significantly to their sediment budgets (Rahaman et al., 2009).
View in article
 Show in context
 IND51 was collected from near the bottom of terrace T3 at Gaucher, dated at 37 ± 4 ka (Ray and Srivastava, 2010), in a sand layer showing cross-bedding and bounded by two horizons of rounded cobbles and gravels.
IND54 was collected from terrace T1 at Nagrasu, dated at 13 ± 2 ka, in a sand horizon bounded by rounded boulders and cobbles. The sampling depth was estimated to be 4 m.
IND57 was collected near the bottom of the terrace at Rudraprayag, 17.7 m below the surface of the terrace, in a massive sand horizon (thickness > 5 m) and dated at 41 ± 5 ka (Ray and Srivastava, 2010). IND58 was collected in the vertical middle part of the terrace at Rudraprayag, dated at 35 ± 6 ka (Ray and Srivastava, 2010), 6.5 m below the surface. The sample was mainly coarse sand collected between large rounded cobbles. IND59 was collected near the top of the terrace at Rudraprayag, dated at 18 ± 3 ka (Ray and Srivastava, 2010), in a homogeneous sand horizon similar to that found in the lower part of the terrace. Sampling depth was 3.20 m. At Srinagar, samples were collected from five terraces out of six described in Ray and Srivastava (2010): IND64 was taken in terrace T2, dated at 17 ± 2 ka (Ray and Srivastava, 2010), about 15 m below the surface. The sample was collected from a 20-30 cm-thick sand horizon showing no sedimentation features and bounded by poorly sorted rounded cobbles. IND65 was collected in terrace T5 about 10 m below the surface. This part of the terrace was dated at 14 ± 1 ka, while the lower part of T5 was dated at 15 ± 2 ka (Ray and Srivastava, 2010). The sample was taken from a sand horizon ~8 m thick, bounded by poorly sorted rounded cobbles and gravels. IND62 was collected from terrace T4, 20-30 m below the surface. No depositional age was determined for this terrace. However, Ray and Srivastava (2010) described terraces T2 through T5 as a cut-and-fill terrace. Thus, the age of T4 should be intermediate to that of T2 and T5, and a value of 16 ± 1 ka was assigned. The sample was taken from a 20-30 cm thick sand horizon overlain by poorly sorted subrounded cobbles and gravels.IND72 was collected 6 m below the surface in terrace T6, dated at 26 ± 4 ka (Ray and Srivastava, 2010). The sample was taken from a sandy-silty horizon showing no sedimentation features and at least 10 m thick. IND73T was taken at a depth of 3.80 m in terrace T1 (two other samples, IND73M and IND73B, were collected at different depths but not analysed). This terrace was not directly dated but is younger than the cut-and-fill terrace, which youngest age is 14 ± 1 ka. Thus, an age of 7 ± 7 ka was assigned to IND73T.
View in article
Example of fluvial deposit sampled: IND64, Srinagar terrace T2, dated at 17 ± 2 ka (Ray and Srivastava, 2010).
View in article
 Show in context
 The Donga Fan collects sediments from the LH only (Singh et al., 2001).
View in article
IND04 was collected from near the base of an alluvial fan deposit, termed section D3 and dated at 20.3 ± 7.5 ka (Singh et al., 2001).
View in article
Samples were collected from a set of four terraces of the Yamuna River (Fig. S-2), where the river exits the Himalayan Range. IND06-4.90 and IND06-5.50 were collected at depth of 4.90 and 5.50 m, respectively, in the terrace termed YT2 and dated at 8.9 ± 1.9 ka (Singh et al., 2001).
At this site, sediment is mostly composed of subrounded cobbles with no significant sorting and silt to coarse sand material. IND07 was collected at a depth of 2.55 m in terrace termed YT3 and dated at 9.5 ± 2.3 ka (Singh et al., 2001).
Sediment is composed mostly of rounded cobbles with coarse sand and silt. IND08-2.60 was collected at a depth of 2.60 m in terrace termed YT4 and dated at 10.7 ± 2.2 ka (Singh et al., 2001).
View in article
 Show in context
 The thick dark and light grey curves represent the schematic variation of δ7Li compositions with time for the clay-sized fraction and the bulk sediments, respectively. The horizontal grey line shows the average δ7Li value for the continental crust (Teng et al., 2004, 2009)
View in article
 Show in context
 The thick dark and light grey curves represent the schematic variation of δ7Li compositions with time for the clay-sized fraction and the bulk sediments, respectively. The horizontal grey line shows the average δ7Li value for the continental crust (Teng et al., 2004, 2009)
View in article
 Show in context
 The clay-sized fraction was selected as: (i) clays have high Li concentrations (20-90 ppm; Table S-1) and are susceptible to record environmental conditions (e.g., temperature, chemistry) during their formation (Vigier et al., 2008; Burton and Vigier, 2011).
View in article
Lithium isotopic analysis requires purification by chromatography before measurement. We used the procedure described in Millot et al. (2004), Vigier et al. (2008), where 2.4 mL of AG50XR cation exchange resin is used. Before loading samples on the column in 0.5 mL of 1 M HCl, the Li concentration in the solutions were adjusted to ~120 ppb.
View in article
Figures and Tables
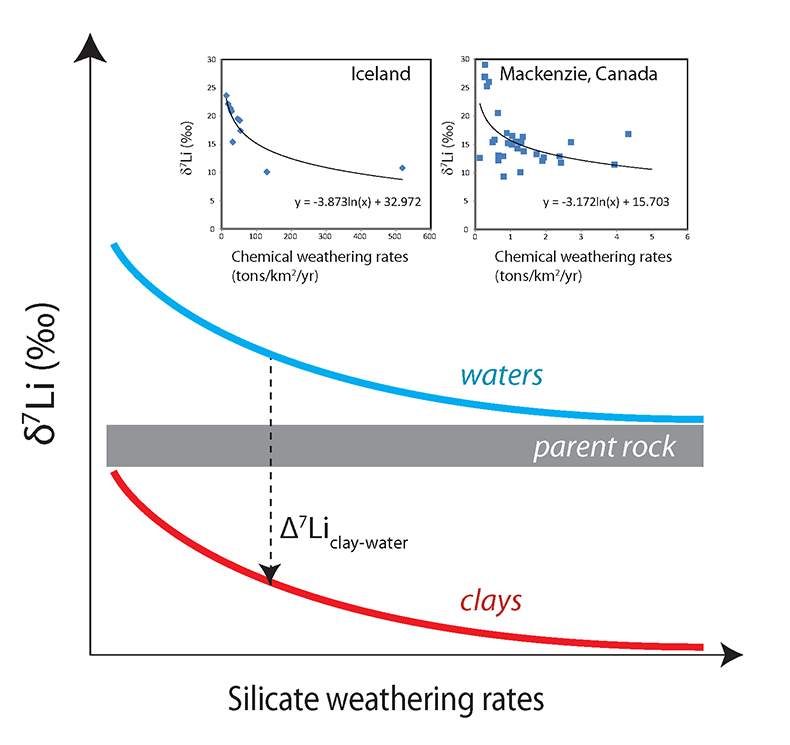
Figure 1 Relationship between δ7Li values of waters and clay minerals, and silicate weathering rates - estimated independently (δ7Li = [(7Li/6Li) / (sup>7Li/6Li)<sub>L-SVEC</sub> – 1]x1000) where L-SVEC is the standard). Most published studies highlight an inverse correlation between water δ7Li and weathering rates at the watershed scale. For a given Li isotope fractionation between clay and water (Δ7Li<sub>clay-water</sub>), clay δ7Li is expected to follow the same pattern with silicate weathering rates. Thus, low δ7Li values are indicative of fast weathering rates. Insets show data for river waters from the Mackenzie basin in Canada (Millot et al., 2010) and from the basaltic basins of Iceland (Vigier et al., 2009). The curves in the insets show a logarithmic regression through the data.
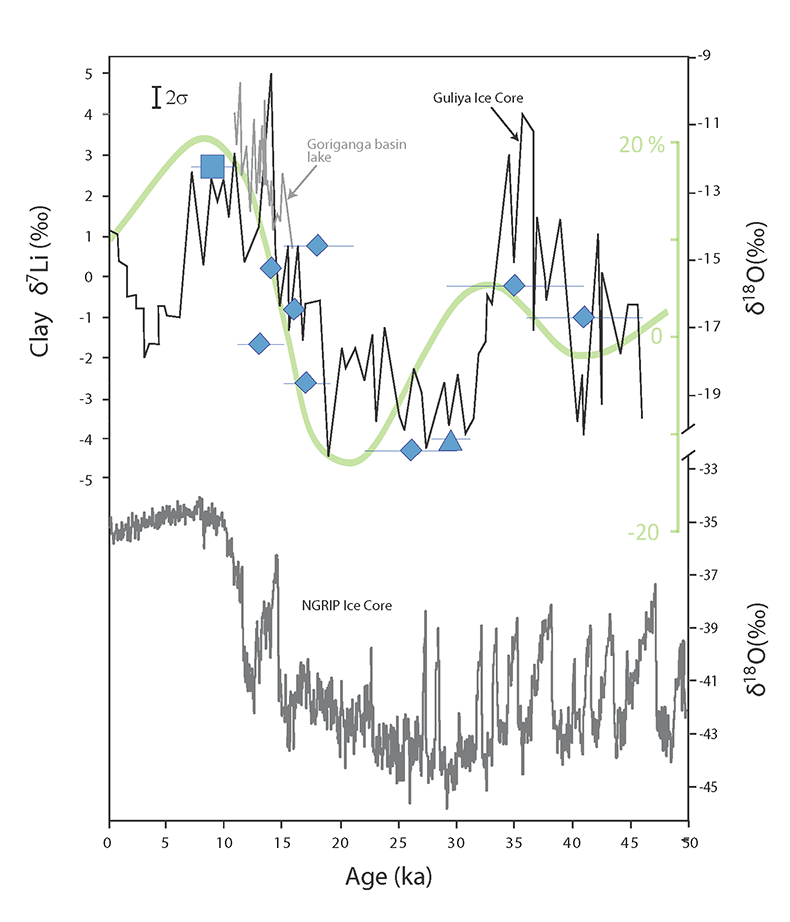
Figure 2 Clay δ7Li as a function of terrace deposition ages (square: Yamuna, triangle: Donga Fan and diamonds: Alaknanda). The vertical bracket in the top left corner shows the external uncertainty for δ7Li. The light green curve represents the precipitation changes in the SW Indian Monsoon for South Asia (green axis graduated from -20 to 20 %; Sanyal and Sinha, 2010 and references therein). The black curve represents the δ18O<sub>SMOW</sub> record from the Guliya ice core on the Qinghai-Tibetan Plateau (right y-axis) (Thompson et al., 1997). The grey curve is the δ18O<sub>VPDB</sub> record from lacustrine sediments in the Goriganga basin (right y-axis), 100 km east of the study area (Beukema et al., 2011). Records from the Guliya ice core and the lacustrine sediments from the Goriganga basin show that relative changes in climatic conditions were consistent on both sides of the divide, at least for this period. Comparison with a global palaeo-climatic record is illustrated with the grey curve, showing the NGRIP ice core δ18O record from Greenland for the same period (North Greenland Ice Core Project members, 2004).
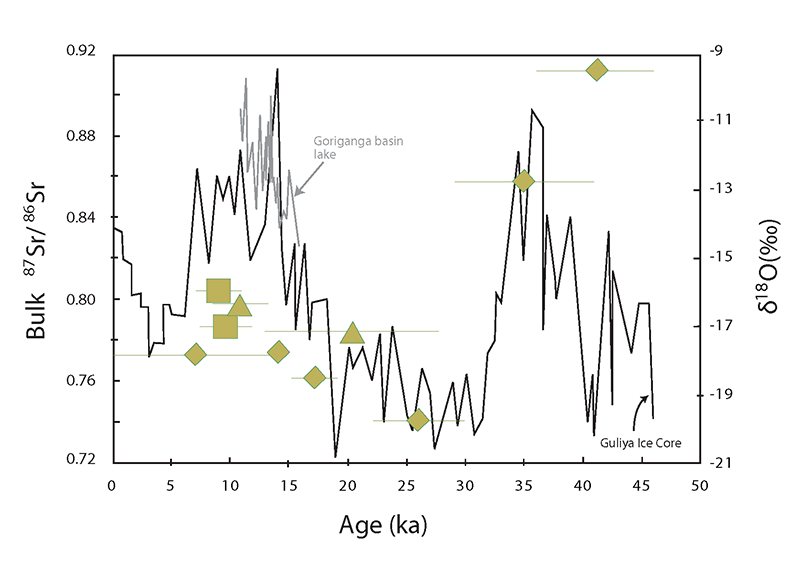
Figure 3 87Sr/86Sr ratios of bulk sediments as a function of terrace deposition ages (same symbols as in Fig. 2). The error on 87Sr/86Sr ratios is smaller than the symbol size. The black curve represents the δ18O<sub>SMOW</sub> record from the Guliya ice core on the Qinghai-Tibetan Plateau (right y-axis) (Thompson et al., 1997). The grey curve is the δ118O<sub>VPDB</sub> record from lacustrine sediments in the Goriganga basin (right y-axis) (Beukema et al., 2011).
Back to article
Supplementary Figures and Tables
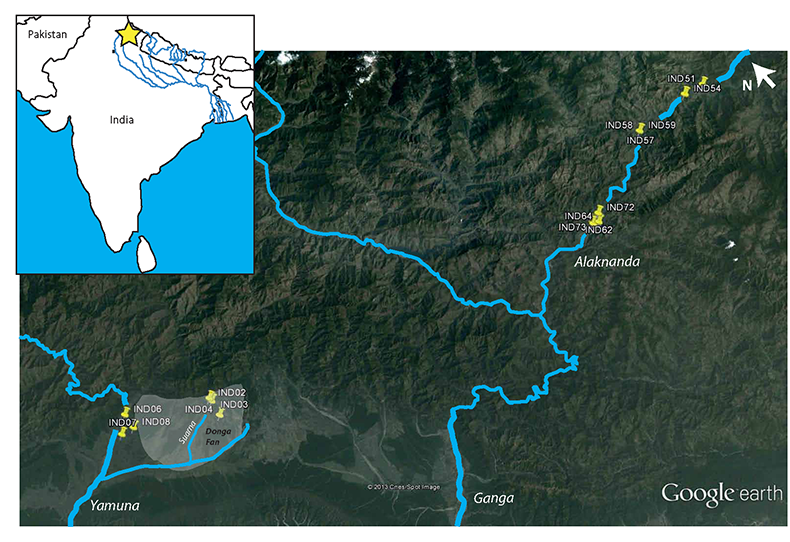
Figure S-1 Map of the study area. Yellow pushpins show the sample locations. The grey area shows the Donga Fan. The yellow star in the inset represents the location of the study area in India. Satellite image source: Cnes/Spot image from Google Earth™.
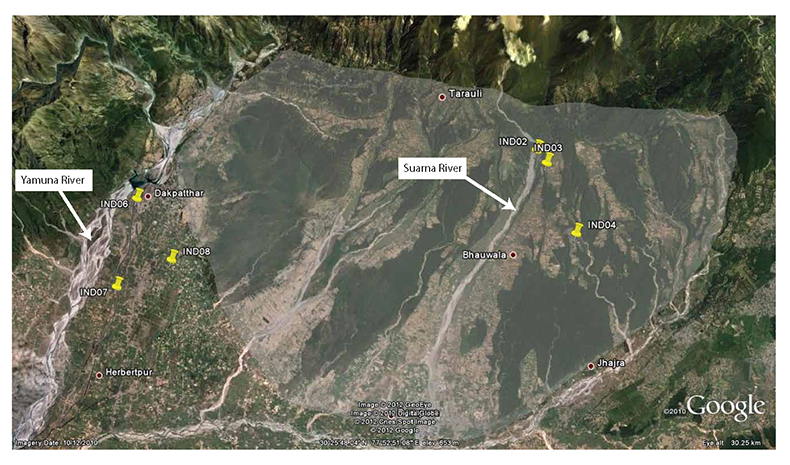
Figure S-2 Google Earth™ image of Donga Fan and Yamuna River sampling locations. The grey area shows the Donga Fan. Flow is from the top to the bottom of the image. Vertical exaggeration is 3x.
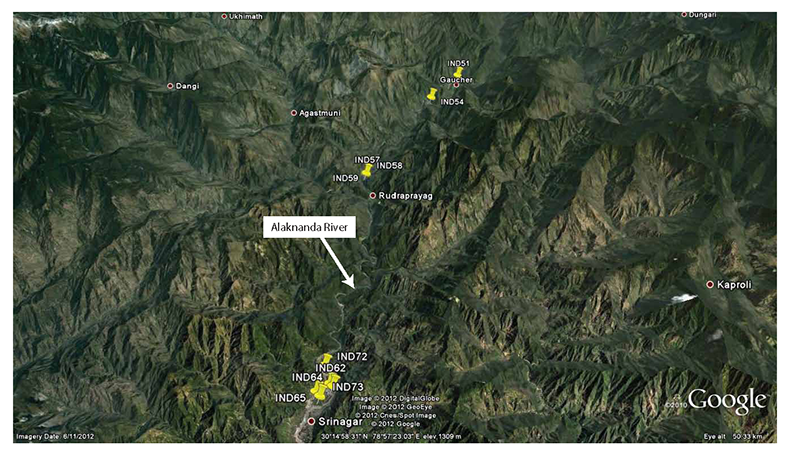
Figure S-3 Google Earth™ image of the Alaknanda River terrace sampling locations. From top to bottom: Gaucher (IND51), Nagrasu (IND54), Rudraprayag (IND57-59) and Srinagar (IND62, 64, 65, 72 and 73). Flow is from top to bottom of the image. Vertical exaggeration is 3x.
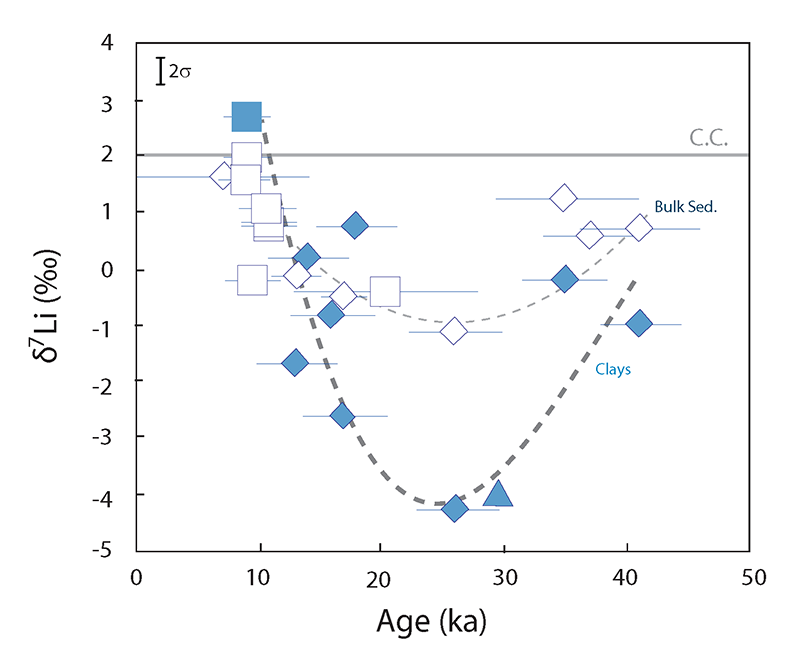
Figure S-4 δ7Li values in clay-sized fractions (full symbols) and bulk sediments (open symbols). Clay-sized fractions show that δ7Li values reach a minimum shortly before the Last Glacial Maximum. This is supported by bulk sediments, although variations are much more dampened. Diamonds: Alakanda, squares: Yamuna, triangles: Donga Fan. The thick dark and light grey curves represent the schematic variation of δ7Li compositions with time for the clay-sized fraction and the bulk sediments, respectively. The horizontal grey line shows the average δ7Li value for the continental crust (Teng et al., 2004; Teng et al., 2009).
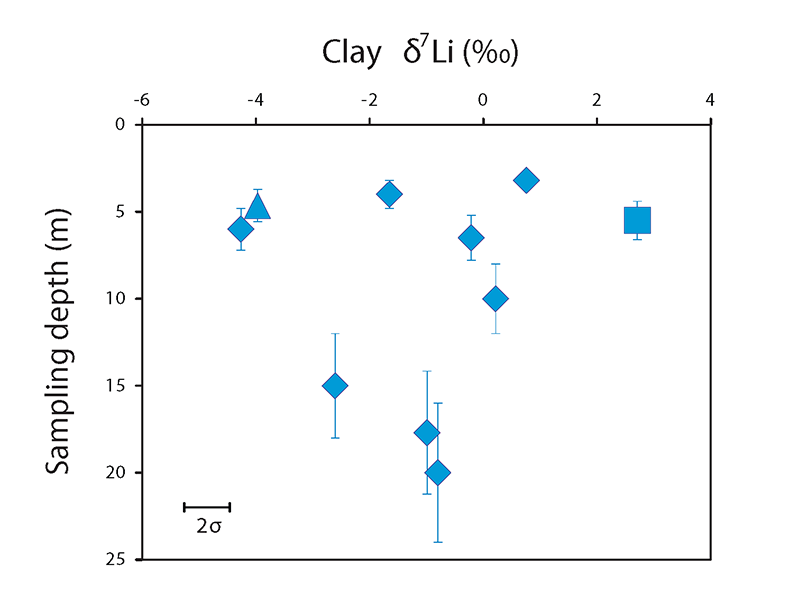
Figure S-5 δ7Li values in clay-sized fractions as a function of sampling depth. No significant trend can be highlighted, supporting the lack of significant post-deposition alteration for the studied samples.
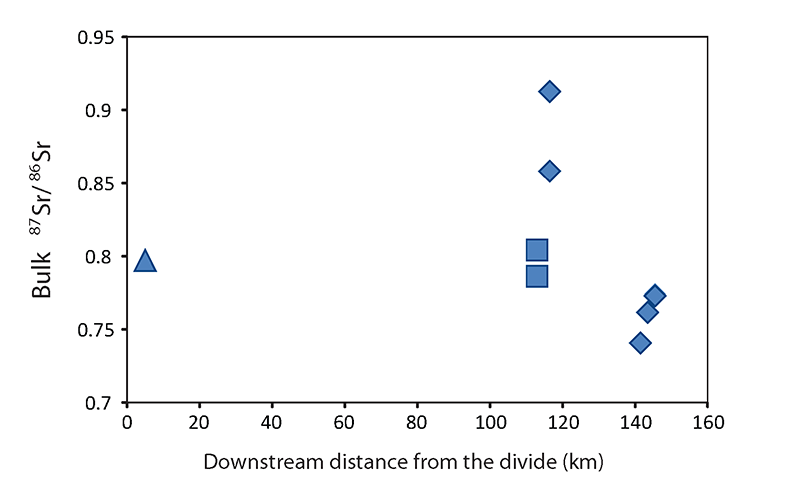
Figure S-6 87Sr/86Sr ratios in bulk sediment as a function of the distance from the divide for the Donga Fan (triangle), Yamuna (squares) and Alaknanda (diamonds). If 87Sr/86Sr ratios were controlled by sediment provenance only, i.e. which rock types they are derived from, Donga Fan sediments should display the highest 87Sr/86Sr values because they only originate from the LH where rocks are characterised by high 87Sr/86Sr ratios (see text for details). Similarly, the 87Sr/86Sr ratio should increase downstream for the Alaknanda as the river flows from the moderately radiogenic HHC into the very radiogenic LH. However the opposite is observed.
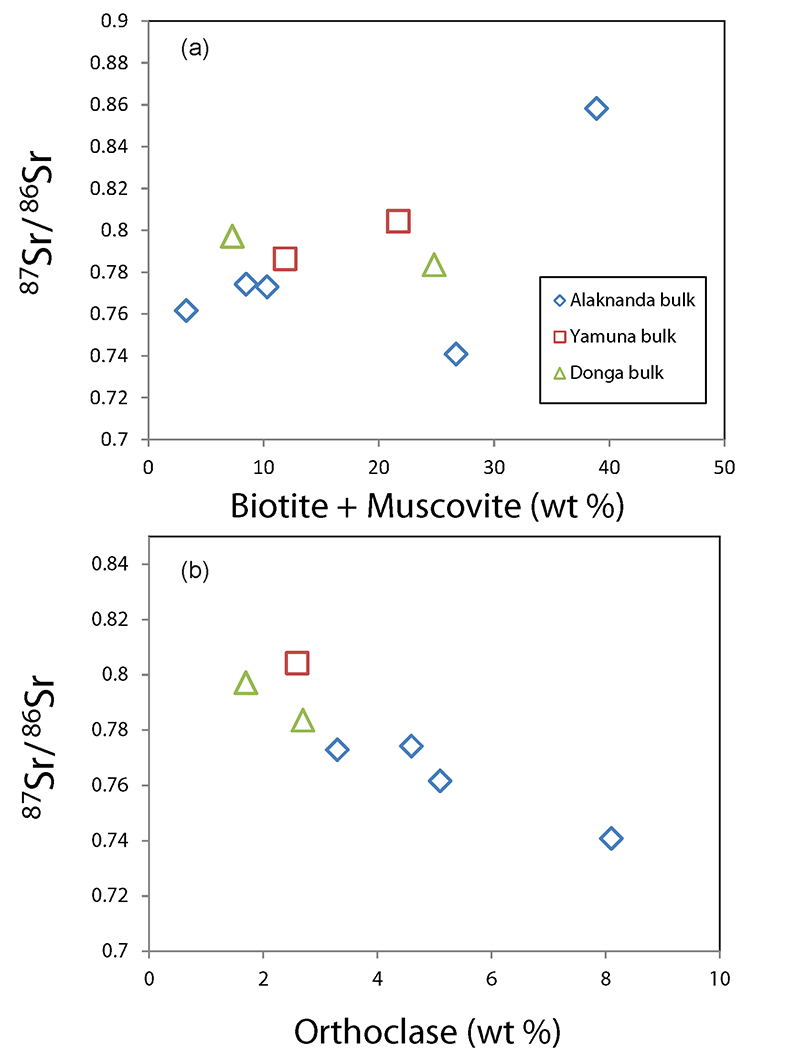
Figure S-7 87Sr/86Sr ratios vs (a) micas and (b) orthoclase contents in bulk sediments. The correlations suggest that 87Sr/86Sr values are controlled by the dissolution of biotite and muscovite, rather than changes in sediment provenance. Errors on 87Sr/86Sr ratios are smaller than the symbol size. Relative errors on mineral contents are less than 5 %.
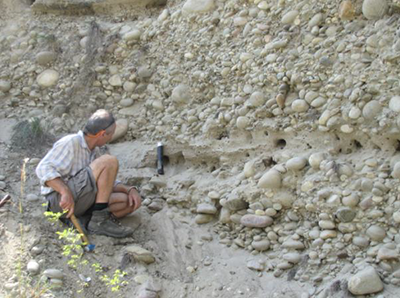
Figure S-8 Example of fluvial deposit sampled: IND64, Srinagar terrace T2, dated at 17 ± 2 ka (Ray and Srivastava, 2010). This terrace is part of a set of six terraces of the Alaknanda River in the Srinagar valley. The deposit consists of 15-20 m of rounded cobbles and boulders showing no preferential imbrication direction and intercalated with sand layers. There is no evidence of post-depositional alteration with neither soil development nor iron oxide staining of the sediment. The sample was collected 15 m below the deposit's surface, in a sand layer.
Table S-1 Lithium and strontium isotopic data for Himalayan fluvial deposits.
Errors are on Li concentrations, δ7Li and 87Sr/86Sr ratios are internal analytical uncertainties.
| Sample name | Site | Sampling depth (m) | Deposition age (ka) | 2σ | Li (ppm) | 2σ | δ7Li | 2V | 87Sr/86Sr | 2σ | |
| IND02 | Suarna T1 | 22 | 10.7 | 2.4 | Bulk sediment | 12.83 | 0.07 | 1.08 | 0.05 | 0.797089 | 0.000013 |
| IND03 | Suarna T5 | 4.65 | 29.4 | 1.7 | Bulk sediment Clay-sized fraction | 17.61 46.30 | 0.13 | -3.97 | 0.50 | ||
| IND04 | Donga Fan section D3 | 20 | 20.3 | 7.5 | Bulk sediment | 18.78 | 0.07 | -0.37 | 0.02 | 0.783569 | 0.000015 |
| IND06-4.90 | Yamuna YT2 | 4.9 | 8.9 | 1.9 | Bulk sediment | 16.05 | 0.18 | 1.98 | 0.10 | 0.804151 | 0.000012 |
| IND06-5.50 | Yamuna YT2 | 5.5 | 8.9 | 1.9 | Bulk sediment Clay-sized fraction | 50.72 | 1.56 2.71 | 0.08 0.50 | |||
| IND07 | Yamuna YT3 | 2.55 | 9.5 | 2.3 | Bulk sediment | 13.31 | 0.05 | -0.18 | 0.01 | 0.786227 | 0.000011 |
| IND08-2.60 replicate replicate | Yamuna YT4 | 2.6 | 10.7 | 2.2 | Bulk sediment Bulk sediment Bulk sediment | 11.41 | 0.01 | 0.79 0.83 0.76 | 0.04 0.04 0.04 | ||
| IND51 | Gaucher T3 | 20 | 37 | 4 | Bulk sediment | 0.57 | 0.03 | ||||
| IND54 | Nagrasu T1 | 4 | 13 | 2 | Bulk sediment Clay-sized fraction | 60.87 | -0.11 -1.65 | 0.01 0.50 | |||
| IND57 | Rudraprayag bottom | 17.7 | 41 | 5 | Bulk sediment Clay-sized fraction | 28.99 | 0.73 -0.99 | 0.04 0.50 | 0.912562 | 0.000011 | |
| IND58 | Rudraprayag middle | 6.5 | 35 | 6 | Bulk sediment Clay-sized fraction | 55.07 | 1.23 -0.21 | 0.06 0.50 | 0.858146 | 0.000013 | |
| IND59 | Rudraprayag top | 3.2 | 18 | 3 | Bulk sediment Clay-sized fraction | 17.68 | 0.76 | 0.50 | |||
| IND62 | Srinagar T4 | 20 | 16 | 1 | Bulk sediment Clay-sized fraction | 14.60 93.04 | 0.08 | -0.80 | 0.50 | ||
| IND64 | Srinagar T2 | 15 | 17 | 2 | Bulk sediment Clay-sized fraction | 15.66 91.16 | 0.04 | -0.46 -2.60 | 0.02 0.50 | 0.761572 | 0.000010 |
| IND65 | Srinagar T5 | 10 | 14 | 1 | Bulk sediment Clay-sized fraction | 17.96 84.93 | 0.08 | -1.54 0.22 | 0.08 0.50 | 0.774127 | 0.000009 |
| IND72 replicate | Srinagar T6 | 6 | 26 | 4 | Bulk sediment Bulk sediment Clay-sized fraction | 23.53 72.46 | 0.04 | -1.08 -1.10 -4.26 | 0.05 0.06 0.50 | 0.740728 | 0.000013 |
| IND73T | Srinagar T1 | 3.8 | 7 | 7 | Bulk sediment | 18.34 | 0.01 | 1.64 | 0.08 | 0.772868 | 0.000009 |
Table S-2 Mineralogical data.
| Sample name | Site | Quartz | Biotite | Muscovite | Albite | Anorthite | Orthoclase | Kaolinite | Chlorite | Gibbsite | Rutile | Titanite | Zircon |
| IND02 | Suarna T1 | 82 | 0.4 | 6.9 | 4.9 | 1.1 | 1.7 | <1 | <1 | <1 | 1.1 | ||
| IND04 | Donga Fan section D3 | 60 | 4.8 | 20 | 4.3 | 1.1 | 2.7 | 1.3 | <1 | 1.1 | 1.4 | 1.3 | |
| IND06-4.90 | Yamuna YT2 | 53 | 3.9 | 18 | 8.4 | 3.1 | 2.6 | <1 | 7.8 | <1 | <1 | ||
| IND07 | Yamuna YT3 | 58 | 1.9 | 10 | 14 | 4.5 | <1 | 8.8 | 1 | <1 | <1 | ||
| IND08-2.60 | Yamuna YT4 | 82 | 0.2 | 8.4 | 2.2 | 1.7 | 2.9 | <1 | <1 | 1.8 | |||
| IND64 | Srinagar T2 | 68 | 1.4 | 1.9 | 11 | 6.7 | 5.1 | <1 | <1 | 0.4 | <1 | 1.6 | <1 |
| IND65 | Srinagar T5 | 46 | 1.9 | 6.6 | 19 | 15 | 4.6 | <1 | 3.1 | 0.7 | <1 | <1 | <1 |
| IND73T | Srinagar T1 | 62 | 3.1 | 7.2 | 10 | 3.9 | 3.3 | 1.2 | 5.4 | 0.3 | <1 | <1 | <1 |
Table S-3 Compilation of Li isotopic composition for various rock types.
Errors are 2 standard errors re-calculated from published value.
| Rock type | δ7Li (‰) | error | Reference |
| Amphibolite | 4.8 | 1.4 | Teng et al., 2008 |
| Pegmatites | 4.5 | 2.6 | Teng et al., 2006 |
| Gneiss | 4.1 | 0.8 | Teng et al., 2008 |
| Granulite | 3.5 | 0.7 | Teng et al., 2008 |
| Granulite (stronalite) | 2.4 | 2.7 | Qiu et al., 2011 Chem Geol |
| Granites | 2.1 | 0.6 | Teng et al., 2009 |
| Bulk continental crust | 2 | 2 | Liu and Rudnick, 2011 |
| Regional amphibolites/schist | 2 | 1.0 | Liu et al., 2010 |
| Granites | 1.5 | 1.0 | Teng et al., 2006 |
| Schists | 0.8 | 2.6 | Teng et al., 2006 |
| Sub-greenschist facies | 0.5 | 0.7 | Qiu et al., 2011 EPSL |
| Mudrocks | 0.4 | 1.2 | Qiu et al., 2009 |
| Loess | 0.2 | 1.3 | Teng et al., 2004 |
| Greenschist facies | 0.2 | 0.2 | Qiu et al., 2011 EPSL |
| Granites | 0.0 | 0.8 | Teng et al., 2004 |
| Shales, greywackes and pelites | -0.3 | 0.9 | Teng et al., 2004 |
| Amphibolite (kinzigite) | -1.3 | 0.7 | Qiu et al., 2011 Chem Geol |


