Solar wind implantation supplied light volatiles during the first stage of Earth accretion
Affiliations | Corresponding Author | Cite as | Funding informationKeywords: noble gases, lower mantle, oceanic island basalts, volatile origin
- Share this article


Article views:9,005Cumulative count of HTML views and PDF downloads.
- Download Citation
- Rights & Permissions
top
Abstract
Figures and Tables
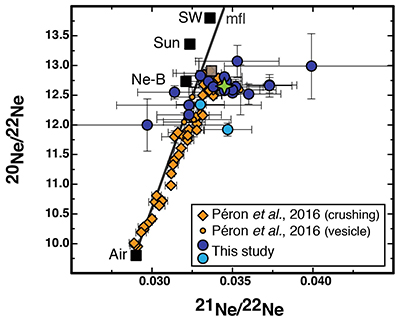 Figure 1 The three neon isotopes plot for the vesicles. Data from the literature for the same samples (Péron et al., 2016) are in orange diamonds and circles. The new data are in blue circles, the two vesicles in light blue (V4B and V16B) are assumed to be air contaminated (Figs. S-1, S-4). The Fernandina source isotopic composition estimated from the statistical analysis with the new data is indicated with the green star, in comparison with the previous one (Péron et al., 2016) indicated with the grey square. Ne-B (Moreira, 2013), Sun (Heber et al., 2012), solar wind SW (Heber et al., 2009), mfl mass fractionation line. | 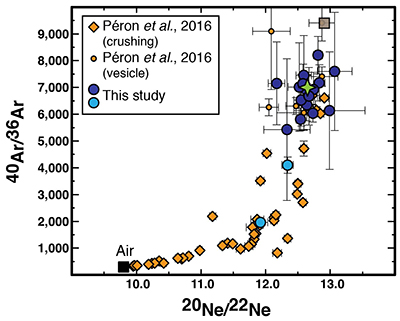 Figure 2 40Ar/36Ar ratio vs 20Ne/22Ne ratio for the vesicles. The latter are in blue circles (vesicles V2A and V11B have too large uncertainties and are not represented). Previous data are in orange diamonds and circles (Péron et al., 2016). The two vesicles in light blue (V4B and V16B) are assumed to be air contaminated, as indicated by the 40Ar/36Ar data, along with distribution of microcracks (Figs. S-1, S-2, S-3, S-4, S-8). The Fernandina source isotopic composition inferred from laser ablation data alone is indicated with the green star, in comparison with the previous one (Péron et al., 2016) indicated with the grey square. | 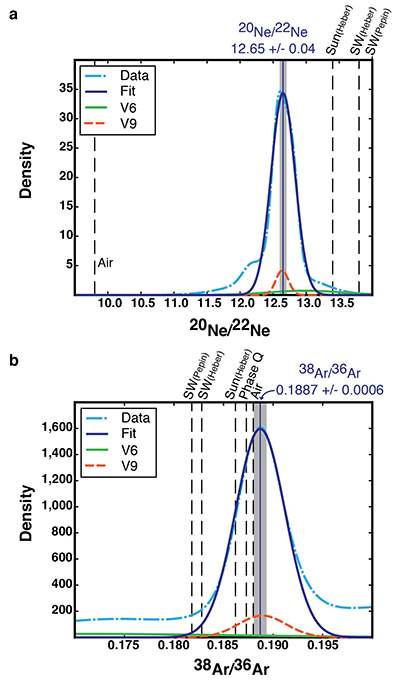 Figure 3 Gaussian curves obtained (a) for the 20Ne/22Ne ratio and (b) for the 38Ar/36Ar ratio. The light blue dotted curve is the cumulative curve obtained with the data (except V4B and V16B), the dark blue curve is the Gaussian fit. As an example, the orange dotted curve for vesicle V9 contributes strongly to the cumulative curve, whereas V6 (green curve) is poorly constrained. The mean isotopic ratios, from the statistical analysis, are represented with the blue lines and the corresponding uncertainties (σ/√n) with the shaded areas. Solar wind (SW) (Heber et al., 2009; Pepin et al., 2012), Sun (Heber et al., 2012), Phase Q (Busemann et al., 2000). |
| Figure 1 | Figure 2 | Figure 3 |
Supplementary Figures and Tables
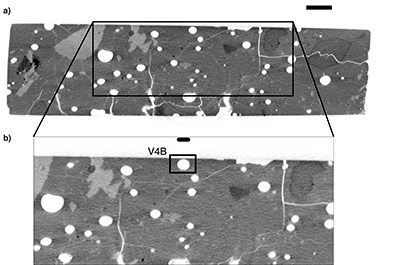 Figure S-1 X-ray microtomography image of the sample AHA-NEMO2-D22B (piece 1, Table S-1). (a) Example of one slice of the sample with the vesicle V4B at the middle top (the scale bar is 1,000 μm) and (b) is a zoom on this vesicle (black square) to show the location (the scale bar is 300 μm). On these images, vesicles are in white and the glass matrix is in grey as well as a few crystals. A network of cracks (in white) is clearly visible. Vesicle V4B is very close to the surface and is likely contaminated due to a small connection to air. | 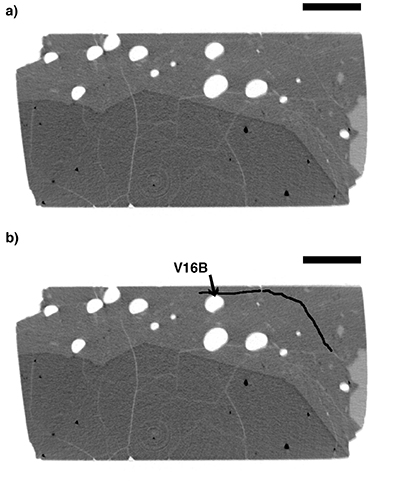 Figure S-2 X-ray microtomography image of the sample AHA-NEMO2-D22B (piece 2, Table S-1) to show the location of vesicle V16B. The original slice is represented in (a) and the very tiny crack just above the vesicle V16B is indicated by a black line in (b). To reach the vesicle, the laser also pierced the crack, which introduced air. The scale bars are 1,000 μm. (Refer also to the legend of Fig. S-1). | 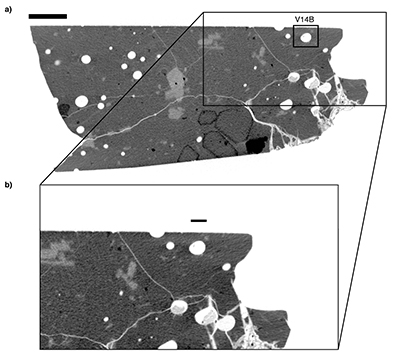 Figure S-3 X-ray microtomography image of the sample AHA-NEMO2-D22B (piece 3, Table S-1) to show the location of vesicle V14B. The original slice is represented in (a) and vesicle V14B is indicated with a black square (the scale bar is 1,000 μm), (b) is a zoom on this vesicle to show what surrounds it (the scale bar is 260 μm). (Refer also to the legend of Fig. S-1). Vesicle V14B has a low 20Ne/22Ne ratio (Table S-3) but no crack is visible on the images. This vesicle is unlikely to be contaminated because the 40Ar/36Ar ratio is 7155 ± 1546. | 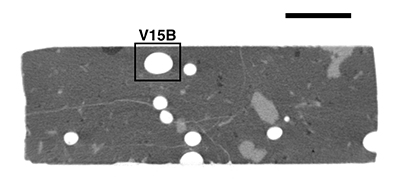 Figure S-4 X-ray microtomography image of the sample AHA-NEMO2-D22B (piece 2, Table S-1). This shows an example of a non-contaminated vesicle, vesicle V15B, which is the biggest vesicle analysed. The scale bar is 1,000 μm. (Refer also to the legend of Fig. S-1). |
| Figure S-1 | Figure S-2 | Figure S-3 | Figure S-4 |
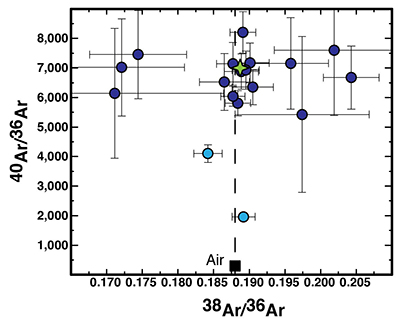 Figure S-5 40Ar/36Ar vs 38Ar/36Ar for the vesicles. The Fernandina (Galápagos) source composition is indicated with the green star. The two light blue circles correspond to the two contaminated vesicles (V4B and V16B). Vesicles V2A and V11B are not represented because their uncertainties are too large. | 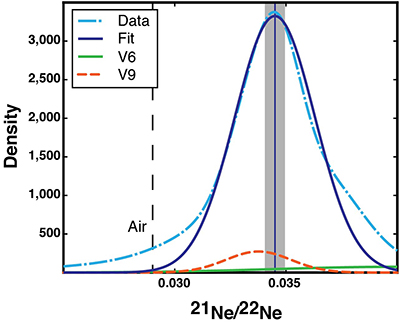 Figure S-6 Gaussian curves obtained for the 21Ne/22Ne ratio. The light blue dotted curve is the cumulative Gaussian curve taking into account all the vesicles (except V4B and V16B), the dark blue curve is the Gaussian fit. Examples of two Gaussian curves are indicated for some vesicles: vesicle V9 (orange dotted curve) has low uncertainties and contributes strongly to the global Gaussian curve, vesicle V6 (green curve) is poorly constrained and has nearly no influence on the global curve. The mean isotopic ratio (0.0345) determined with the statistical analysis is represented with the solid blue line. The shaded area corresponds to σ/√n = ±0.0004. For comparison, air composition is indicated. | 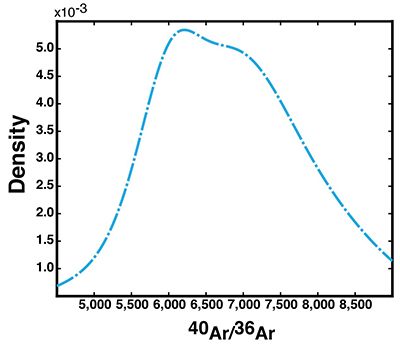 Figure S-7 Cumulative curve obtained for the 40Ar/36Ar ratio taking into account all the vesicles (except V4B and V16B). This curve cannot be correctly fitted with a Gaussian curve. The 40Ar/36Ar ratio is between 6000 and 7000 for the Fernandina source. | 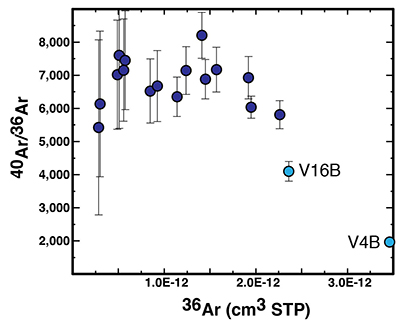 Figure S-8 40Ar/36Ar vs 36Ar (in cm3 STP) for the vesicles. The two contaminated vesicles (V4B and V16B) are in light blue. Except for these two bubbles, the 40Ar/36Ar ratio does not change with the 36Ar concentration, which indicates that the vesicles are not contaminated by air. Vesicles V2A and V11B are not represented because they have too large uncertainties. |
| Figure S-5 | Figure S-6 | Figure S-7 | Figure S-8 |
 Table S-1 Acquisition parameters for X-ray microtomography. The experiments were conducted at the Institute of Earth Sciences (Lausanne, Switzerland) on a Skyscan 1173 system. One piece of sample AHA-NEMO2-D22A has been studied and four for sample AHA-NEMO2-D22B. The piece number is indicated as well as the voltage (in kV), the current (in µA), the rotation step size (in degrees), the number of frames (which is the number of images taken for one position), the filter type used and the resolution (in µm per pixel). The resolution in µm3 per voxel (1 voxel = 1 x 1 x 1 pixel) is the cubic resolution in µm per pixel. |  Table S-2 CO2 and noble gas (4He, 22Ne and 36Ar) abundances (in cm3 STP) for all the vesicles for samples AHA-NEMO2-D22A and AHA-NEMO2-D22B (Fernandina, Galápagos). The ablation time for each vesicle is indicated in brackets. The piece number (refer to Table S-1) and the depth of each vesicle below the sample surface are mentioned. The vesicle volumes were calculated with the 3D Object Counter plugin of ImageJ. The CO2 contents were determined using the pressure jump recorded on the manometer, calibrated with the air standard, and assuming that CO2 is the major gas (Moore et al., 1977). Errors are 1 sigma uncertainties. |  Table S-3 Isotopic compositions of the vesicles for samples AHA-NEMO2-D22A and AHA-NEMO2-D22B (Fernandina, Galápagos). Ra is the air 3He/4He ratio and is equal to 1.384 x 10⁻⁶ (Clarke et al., 1976) . 40Ar* is radiogenic 40Ar. We consider a 40Ar/36Ar ratio of 298.6 for the air (Lee et al., 2006) to determine the 40Ar/36Ar and 4He/40Ar* ratios. n.d. means not determined when gases from the vesicle are indistinguishable from the matrix blank. Errors are 1 sigma uncertainties. |  Table S-4 Noble gas abundances of the matrix blanks (in cm3 STP) for samples AHA-NEMO2-D22A and AHA-NEMO2-D22B (Fernandina, Galápagos). The ablation times are indicated in brackets. Errors are 1 sigma uncertainties. |  Table S-5 Isotopic compositions of the matrix blanks for samples AHA-NEMO2-D22A and AHA-NEMO2-D22B (Fernandina, Galápagos). Errors are 1 sigma uncertainties. |
| Table S-1 | Table S-2 | Table S-3 | Table S-4 | Table S-5 |
top
Introduction
The isotopes 20Ne, 22Ne, 36Ar and 38Ar are primordial in the Earth’s mantle, the 20Ne/22Ne and 38Ar/36Ar isotopic ratios can thus be used as noble gas source tracers. The major noble gas carriers in the solar system are, among others, the solar wind (20Ne/22Ne = 13.8–14.0, 38Ar/36Ar = 0.1818–0.1828; Heber et al., 2009
Heber, V.S., Wieler, R., Baur, H., Olinger, C., Friedmann, A., Burnett, D.S. (2009) Noble gas composition of the solar wind as collected by the Genesis mission. Geochimica et Cosmochimica Acta 73, 7414–7432.
; Pepin et al., 2012Pepin, R.O., Schlutter, D.J., Becker, R.H., Reisenfeld, D.B. (2012) Helium, neon, and argon composition of the solar wind as recorded in gold and other Genesis collector materials. Geochimica et Cosmochimica Acta 89, 62–80.
), the component B (20Ne/22Ne = 12.5–12.7, 38Ar/36Ar = 0.1862 or 0.1919; Black, 1972Black, D.C. (1972) On the origins of trapped helium, neon and argon isotopic variations in meteorites—I. Gas-rich meteorites, lunar soil and breccia. Geochimica et Cosmochimica Acta 36, 347–375.
; Raquin and Moreira, 2009Raquin, A., Moreira, M. (2009) Atmospheric 38Ar/36Ar in the mantle: Implications for the nature of the terrestrial parent bodies. Earth and Planetary Science Letters 287, 551–558.
; Moreira, 2013Moreira, M. (2013) Noble gas constraints on the origin and evolution of Earth's volatiles. Geochemical Perspectives 2, 229–403.
; Moreira and Charnoz, 2016Moreira, M., Charnoz, S. (2016) The origin of the neon isotopes in chondrites and on Earth. Earth and Planetary Science Letters 433, 249–256.
), which corresponds to solar wind implantation and is mostly important for light noble gases, and the phase Q for heavy noble gases found in chondrites (20Ne/22Ne = 10.1–10.7, 38Ar/36Ar = 0.1873; Busemann et al., 2000Busemann, H., Baur, H., Wieler, R. (2000) Primordial noble gases in "phase Q" in carbonaceous and ordinary chondrites studied by closed-system stepped etching. Meteoritics and Planetary Science 35, 949–973.
). The lower mantle is one plausible reservoir of primitive noble gases (Allègre et al., 1983Allègre, C.J., Staudacher, T., Sarda, P., Kurz, M.D. (1983) Constraints on evolution of Earth's mantle from rare gas systematics. Nature 303, 762–766.
), so some Oceanic Island Basalts (OIBs), which are presumed to sample the lower mantle, are of particular interest to determine the Earth’s primordial isotopic ratios. Only a limited suite of samples from a few hotspots (Hawaii, Galápagos and Iceland) are suitable because unradiogenic/primitive (He, Ne) isotopic compositions are rare, and because submarine or subglacial glass samples are needed to analyse the primitive noble gas compositions. Such glass samples correspond to magma quenched at high pressures during eruptions and are among the best samples to record the mantle noble gas composition.However, the ubiquity of an atmospheric component has complicated the determination of mantle source noble gas isotopic compositions. The air component may be derived from post-eruption contamination when samples are recovered from the seafloor (Ballentine and Barfod, 2000
Ballentine, C., Barfod, D. (2000) The origin of air-like noble gases in MORB and OIB. Earth and Planetary Science Letters 180, 39–48.
). It may also come from atmospheric recycling through subduction for heavy noble gases (Ar, Kr, Xe) (Holland and Ballentine, 2006Holland, G., Ballentine, C.J. (2006) Seawater subduction controls the heavy noble gas composition of the mantle. Nature 441, 186–191.
; Kendrick et al., 2011Kendrick, M.A., Scambelluri, M., Honda, M., Phillips, D. (2011) High abundances of noble gas and chlorine delivered to the mantle by serpentine subduction. Nature Geoscience 4, 807–812.
; Parai and Mukhopadhyay, 2015Parai, R., Mukhopadhyay, S. (2015) The evolution of MORB and plume mantle volatile budgets: Constraints from fission Xe isotopes in Southwest Indian Ridge basalts. Geochemistry, Geophysics, Geosystems 16, 719–735.
). Noble gas studies often use step-crushing to analyse samples, and the results yield mixing trends between an atmospheric end-member and a mantle end-member. It is then assumed that the highest measured value is the least air contaminated and corresponds to a lower limit for the mantle. However, this approach does not necessarily completely eliminate atmospheric contamination. In order to avoid the atmospheric component, laser ablation analyses were introduced (Burnard et al., 1997Burnard, P., Graham, D., Turner, G. (1997) Vesicle-specific noble gas analyses of "popping rock": implications for primordial noble gases in the Earth. Science 276, 568–571.
; Burnard, 1999Burnard, P. (1999) The bubble-by-bubble volatile evolution of two mid-ocean ridge basalts. Earth and Planetary Science Letters 174, 199–211.
), which involve targeting individual bubbles with a laser. Up to now, no laser ablation study allows us to clearly discriminate between the two scenarios for noble gas origin on Earth because of the scarcity of data and the poor accuracy (Raquin et al., 2008Raquin, A., Moreira, M., Guillon, F. (2008) He, Ne and Ar systematics in single vesicles: Mantle isotopic ratios and origin of the air component in basaltic glasses. Earth and Planetary Science Letters 274, 142–150.
; Colin et al., 2015Colin, A., Moreira, M., Gautheron, C., Burnard, P. (2015) Constraints on the noble gas composition of the deep mantle by bubble-by-bubble analysis of a volcanic glass sample from Iceland. Chemical Geology 417, 173–183.
; Péron et al., 2016Péron, S., Moreira, M., Colin, A., Arbaret, L., Putlitz, B., Kurz, M.D. (2016) Neon isotopic composition of the mantle constrained by single vesicle analyses. Earth and Planetary Science Letters 449, 145–154.
).We analysed by laser ablation the noble gas compositions (He, Ne, Ar) of twenty vesicles of two submarine glass samples from Fernandina volcano (Galápagos), previously imaged via X-ray microtomography to locate the vesicles (Supplementary Information and Table S-1), with the aim of understanding the air contamination mechanisms, and refining the Earth’s primordial 20Ne/22Ne and 38Ar/36Ar ratios to evaluate the two models for noble gas origin on Earth; the solar wind implantation model (Trieloff et al., 2000
Trieloff, M., Kunz, J., Clague, D.A., Harrison, D., Allègre, C.J. (2000) The Nature of pristine noble gases in mantle plumes. Science 288, 1036–1038.
; Raquin and Moreira, 2009Raquin, A., Moreira, M. (2009) Atmospheric 38Ar/36Ar in the mantle: Implications for the nature of the terrestrial parent bodies. Earth and Planetary Science Letters 287, 551–558.
) and the solar nebula gas dissolution model (Yokochi and Marty, 2004Yokochi, R., Marty, B. (2004) A determination of the neon isotopic composition of the deep mantle. Earth and Planetary Science Letters 225, 77–88.
; Mukhopadhyay, 2012Mukhopadhyay, S. (2012) Early differentiation and volatile accretion recorded in deep mantle Neon and Xenon. Nature 486, 101–104.
). These OIB samples, AHA-NEMO2-D22A and AHA-NEMO2-D22B, were chosen due to their very primitive He and Ne compositions (Kurz et al., 2009Kurz, M.D., Curtice, J., Fornari, D., Geist, D., Moreira, M. (2009) Primitive neon from the center of the Galápagos hotspot. Earth and Planetary Science Letters 286, 23–34.
), relatively high gas concentrations and thick glassy rinds (results are in Tables S-2 and S-3).top
Evidence for a Ne-B Component in the Mantle
All the new vesicles analysed show similar isotopic compositions, with only two exceptions (vesicles V4B and V16B; Figs. 1, 2 and Table S-3). Vesicles V4B and V16B may be contaminated by air since their 20Ne/22Ne and 40Ar/36Ar ratios are lower and tend to atmospheric ratios. Small but subtle cracks are observed just above these bubbles on the X-ray microtomography images (Figs. S-1, S-2, S-3 and S-4) and must have been hit before piercing these vesicles, mixing air with vesicle gases. This is a new evidence of atmospheric contamination mechanisms. These cracks, typically less than 20 µm wide, are difficult to notice. Except those two vesicles, and the vesicles for which the uncertainties are large (V2B, V5B, V6B, V11B and V2A), the 20Ne/22Ne ratio is between 12.17 ± 0.13 and 12.83 ± 0.09 (1 σ), the vesicles have a 38Ar/36Ar ratio similar to air (0.188) and the 40Ar/36Ar ratio is between 5809 ± 425 and 8206 ± 695 (Table S-3 and Fig. S-5).

Figure 1 The three neon isotopes plot for the vesicles. Data from the literature for the same samples (Péron et al., 2016
Péron, S., Moreira, M., Colin, A., Arbaret, L., Putlitz, B., Kurz, M.D. (2016) Neon isotopic composition of the mantle constrained by single vesicle analyses. Earth and Planetary Science Letters 449, 145–154.
) are in orange diamonds and circles. The new data are in blue circles, the two vesicles in light blue (V4B and V16B) are assumed to be air contaminated (Figs. S-1, S-4). The Fernandina source isotopic composition estimated from the statistical analysis with the new data is indicated with the green star, in comparison with the previous one (Péron et al., 2016Péron, S., Moreira, M., Colin, A., Arbaret, L., Putlitz, B., Kurz, M.D. (2016) Neon isotopic composition of the mantle constrained by single vesicle analyses. Earth and Planetary Science Letters 449, 145–154.
) indicated with the grey square. Ne-B (Moreira, 2013Moreira, M. (2013) Noble gas constraints on the origin and evolution of Earth's volatiles. Geochemical Perspectives 2, 229–403.
), Sun (Heber et al., 2012Heber, V.S., Baur, H., Bochsler, P., McKeegan, K.D., Neugebauer, M., Reisenfeld, D.B., Wieler, R., Wiens, R.C. (2012) Isotopic Mass Fractionation of Solar Wind: Evidence from Fast and Slow Solar Wind Collected by the Genesis mission. The Astrophysical Journal 759, 121.
), solar wind SW (Heber et al., 2009Heber, V.S., Wieler, R., Baur, H., Olinger, C., Friedmann, A., Burnett, D.S. (2009) Noble gas composition of the solar wind as collected by the Genesis mission. Geochimica et Cosmochimica Acta 73, 7414–7432.
), mfl mass fractionation line.
Figure 2 40Ar/36Ar ratio vs 20Ne/22Ne ratio for the vesicles. The latter are in blue circles (vesicles V2A and V11B have too large uncertainties and are not represented). Previous data are in orange diamonds and circles (Péron et al., 2016
Péron, S., Moreira, M., Colin, A., Arbaret, L., Putlitz, B., Kurz, M.D. (2016) Neon isotopic composition of the mantle constrained by single vesicle analyses. Earth and Planetary Science Letters 449, 145–154.
). The two vesicles in light blue (V4B and V16B) are assumed to be air contaminated, as indicated by the 40Ar/36Ar data, along with distribution of microcracks (Figs. S-1, S-2, S-3, S-4, S-8). The Fernandina source isotopic composition inferred from laser ablation data alone is indicated with the green star, in comparison with the previous one (Péron et al., 2016Péron, S., Moreira, M., Colin, A., Arbaret, L., Putlitz, B., Kurz, M.D. (2016) Neon isotopic composition of the mantle constrained by single vesicle analyses. Earth and Planetary Science Letters 449, 145–154.
) indicated with the grey square.The relatively large dataset (20 vesicles) combined with the fact that all the vesicles have similar isotopic compositions (Figs. 1 and 2), suggests that they all sample the same gas. This allows a statistical analysis (Fig. 3) in order to derive precisely the Fernandina source isotopic ratios. In this new approach, a Gaussian distribution is considered for each vesicle isotopic ratio, where the mean is the measured isotopic ratio and sigma is the associated measurement uncertainty, and then the sum of all these Gaussian distributions for a given isotopic ratio gives a cumulative curve. These cumulative curves are thus fitted to obtain overall means (Supplementary Information). This allows us to weight the mean according to measurement uncertainty. We use all the vesicles except the two contaminated ones (V4B and V16B). By fitting the curves with Gaussian distributions on Figure 3 (and Fig. S-6), we obtained a 20Ne/22Ne ratio of 12.65 ± 0.04 (σ/√n), a 21Ne/22Ne ratio of 0.0345 ± 0.0004 (σ/√n) and a 38Ar/36Ar ratio of 0.1887 ± 0.0006 (σ/√n). The 40Ar/36Ar distribution could not be fitted with a Gaussian curve but the data show that this ratio is between 6000 and 7000 in the Fernandina source (Fig. S-7).

Figure 3 Gaussian curves obtained (a) for the 20Ne/22Ne ratio and (b) for the 38Ar/36Ar ratio. The light blue dotted curve is the cumulative curve obtained with the data (except V4B and V16B), the dark blue curve is the Gaussian fit. As an example, the orange dotted curve for vesicle V9 contributes strongly to the cumulative curve, whereas V6 (green curve) is poorly constrained. The mean isotopic ratios, from the statistical analysis, are represented with the blue lines and the corresponding uncertainties (σ/√n) with the shaded areas. Solar wind (SW) (Heber et al., 2009
Heber, V.S., Wieler, R., Baur, H., Olinger, C., Friedmann, A., Burnett, D.S. (2009) Noble gas composition of the solar wind as collected by the Genesis mission. Geochimica et Cosmochimica Acta 73, 7414–7432.
; Pepin et al., 2012Pepin, R.O., Schlutter, D.J., Becker, R.H., Reisenfeld, D.B. (2012) Helium, neon, and argon composition of the solar wind as recorded in gold and other Genesis collector materials. Geochimica et Cosmochimica Acta 89, 62–80.
), Sun (Heber et al., 2012Heber, V.S., Baur, H., Bochsler, P., McKeegan, K.D., Neugebauer, M., Reisenfeld, D.B., Wieler, R., Wiens, R.C. (2012) Isotopic Mass Fractionation of Solar Wind: Evidence from Fast and Slow Solar Wind Collected by the Genesis mission. The Astrophysical Journal 759, 121.
), Phase Q (Busemann et al., 2000Busemann, H., Baur, H., Wieler, R. (2000) Primordial noble gases in "phase Q" in carbonaceous and ordinary chondrites studied by closed-system stepped etching. Meteoritics and Planetary Science 35, 949–973.
).top
Discussion and Conclusions
The new results are consistent with previous studies about the Hawaii and Iceland hotspots (Trieloff et al., 2000
Trieloff, M., Kunz, J., Clague, D.A., Harrison, D., Allègre, C.J. (2000) The Nature of pristine noble gases in mantle plumes. Science 288, 1036–1038.
; Mukhopadhyay, 2012Mukhopadhyay, S. (2012) Early differentiation and volatile accretion recorded in deep mantle Neon and Xenon. Nature 486, 101–104.
; Colin et al., 2015Colin, A., Moreira, M., Gautheron, C., Burnard, P. (2015) Constraints on the noble gas composition of the deep mantle by bubble-by-bubble analysis of a volcanic glass sample from Iceland. Chemical Geology 417, 173–183.
). The highest values of 12.91 ± 0.07 and 9407 ± 672 for the 20Ne/22Ne and 40Ar/36Ar ratios respectively obtained in a previous study of the same samples (Péron et al., 2016Péron, S., Moreira, M., Colin, A., Arbaret, L., Putlitz, B., Kurz, M.D. (2016) Neon isotopic composition of the mantle constrained by single vesicle analyses. Earth and Planetary Science Letters 449, 145–154.
) seem to be slightly too high for the Fernandina mantle source within 2σ uncertainties. Hence, it does not seem appropriate to take the highest values for determining mantle source isotopic ratios. We cannot exclude that isotopic fractionation occurs during bubble formation (Ruzié and Moreira, 2010Ruzié, L., Moreira, M. (2010) Magma degassing process during Plinian eruptions. Journal of Volcanology and Geothermal Research 192, 142–150.
), which could increase the 20Ne/22Ne ratio for a few bubbles, and also that slight sample heterogeneities exist, which could explain the small variability observed between the bubbles. It is thus more suitable to take a mean of the data, provided that the bubbles have similar compositions. The statistical analysis used here provides a new approach for precise determination of isotopic ratios.As detailed in Supplementary Information, we do not expect contamination of the bubbles. Even if recycling of heavy noble gases (Ar, Kr, Xe) through subduction may occur (Holland and Ballentine, 2006
Holland, G., Ballentine, C.J. (2006) Seawater subduction controls the heavy noble gas composition of the mantle. Nature 441, 186–191.
; Kendrick et al., 2011Kendrick, M.A., Scambelluri, M., Honda, M., Phillips, D. (2011) High abundances of noble gas and chlorine delivered to the mantle by serpentine subduction. Nature Geoscience 4, 807–812.
; Parai and Mukhopadhyay, 2015Parai, R., Mukhopadhyay, S. (2015) The evolution of MORB and plume mantle volatile budgets: Constraints from fission Xe isotopes in Southwest Indian Ridge basalts. Geochemistry, Geophysics, Geosystems 16, 719–735.
), recycling of He and Ne into the OIB gas-rich source is not significant (Staudacher and Allègre, 1988Staudacher, T., Allègre, C.J. (1988) Recycling of oceanic crust and sediments: the noble gas subduction barrier. Earth and Planetary Science Letters 89, 173–183.
; Holland and Ballentine, 2006Holland, G., Ballentine, C.J. (2006) Seawater subduction controls the heavy noble gas composition of the mantle. Nature 441, 186–191.
). The 20Ne/22Ne ratio of 12.65 ± 0.04 is thus likely to represent the Fernandina source isotopic composition.The 20Ne/22Ne ratio corresponds quite closely to the Ne-B composition. The Ne-B 20Ne/22Ne ratio was determined from analyses of gas-rich meteorites and lunar soils, which have been exposed to solar wind irradiation for millions of years (12.52; Black, 1972
Black, D.C. (1972) On the origins of trapped helium, neon and argon isotopic variations in meteorites—I. Gas-rich meteorites, lunar soil and breccia. Geochimica et Cosmochimica Acta 36, 347–375.
; 12.8 on average; Eberhardt et al., 1972Eberhardt, P., Geiss, J., Graf, H., Grögler, N., Mendia, M.D., Mörgeli, M., Schwaller, H., Stettler, A., Krähenbühl, U., Von Gunten, H.R. (1972) Trapped solar wind noble gases in Apollo 12 lunar fines 12001 and Apollo 11 breccia 10046. Proceedings of the Third Lunar Science Conference, Supplement 3, Geochimica et Cosmochimica Acta, The MIT press 2, 1821–1856.
), and also from numerical simulations (12.73; Raquin and Moreira, 2009Raquin, A., Moreira, M. (2009) Atmospheric 38Ar/36Ar in the mantle: Implications for the nature of the terrestrial parent bodies. Earth and Planetary Science Letters 287, 551–558.
; Moreira, 2013Moreira, M. (2013) Noble gas constraints on the origin and evolution of Earth's volatiles. Geochemical Perspectives 2, 229–403.
; Moreira and Charnoz, 2016Moreira, M., Charnoz, S. (2016) The origin of the neon isotopes in chondrites and on Earth. Earth and Planetary Science Letters 433, 249–256.
). This is the first high precision laser ablation study for Ne, involving enough vesicles for a statistical analysis. The fact that all the vesicles show similar isotopic compositions, in the Ne-B range of values, combined with the lunar soil results, is a strong argument in favour of the solar wind implantation model to explain light noble gas origin on Earth. The new results are consistent with this steady-state (Ne-B) composition and it may not be necessary to invoke non-steady state solar wind implantation onto grains to explain the lower mantle 20Ne/22Ne ratio (Péron et al., 2016Péron, S., Moreira, M., Colin, A., Arbaret, L., Putlitz, B., Kurz, M.D. (2016) Neon isotopic composition of the mantle constrained by single vesicle analyses. Earth and Planetary Science Letters 449, 145–154.
). Other studies suggest that the 38Ar/36Ar ratio is atmospheric in the Earth’s mantle (Trieloff et al., 2000Trieloff, M., Kunz, J., Clague, D.A., Harrison, D., Allègre, C.J. (2000) The Nature of pristine noble gases in mantle plumes. Science 288, 1036–1038.
; Raquin and Moreira, 2009Raquin, A., Moreira, M. (2009) Atmospheric 38Ar/36Ar in the mantle: Implications for the nature of the terrestrial parent bodies. Earth and Planetary Science Letters 287, 551–558.
; Mukhopadhyay, 2012Mukhopadhyay, S. (2012) Early differentiation and volatile accretion recorded in deep mantle Neon and Xenon. Nature 486, 101–104.
), and lunar soils seem to have a 38Ar/36Ar ratio close to the atmospheric value even if the resolution is low (e.g., Eberhardt et al., 1972Eberhardt, P., Geiss, J., Graf, H., Grögler, N., Mendia, M.D., Mörgeli, M., Schwaller, H., Stettler, A., Krähenbühl, U., Von Gunten, H.R. (1972) Trapped solar wind noble gases in Apollo 12 lunar fines 12001 and Apollo 11 breccia 10046. Proceedings of the Third Lunar Science Conference, Supplement 3, Geochimica et Cosmochimica Acta, The MIT press 2, 1821–1856.
; Benkert et al., 1993Benkert, J.-P., Baur, H., Signer, P., Wieler, R. (1993) He, Ne and Ar from the Solar Wind and Solar Energetic Particles in lunar ilmenites and pyroxenes. Journal of Geophysical Research 98, 13147–13162.
). Hence, the solar wind implantation model could also account for the lower mantle 38Ar/36Ar ratio.Previous step-crushing studies advocated that the early Earth would have captured a primordial atmosphere from solar nebula gas and that noble gases come from the dissolution of this early atmosphere into a magma ocean (Yokochi and Marty, 2004
Yokochi, R., Marty, B. (2004) A determination of the neon isotopic composition of the deep mantle. Earth and Planetary Science Letters 225, 77–88.
; Mukhopadhyay, 2012Mukhopadhyay, S. (2012) Early differentiation and volatile accretion recorded in deep mantle Neon and Xenon. Nature 486, 101–104.
). This scenario is problematic for several reasons. First, the mantle noble gas isotopic composition is different from the solar or solar wind compositions (the Sun 20Ne/22Ne ratio would be 13.34; Heber et al., 2012Heber, V.S., Baur, H., Bochsler, P., McKeegan, K.D., Neugebauer, M., Reisenfeld, D.B., Wieler, R., Wiens, R.C. (2012) Isotopic Mass Fractionation of Solar Wind: Evidence from Fast and Slow Solar Wind Collected by the Genesis mission. The Astrophysical Journal 759, 121.
). The solar nebula dissolution model would thus require subduction of atmospheric Ne to lower the 20Ne/22Ne ratio from solar to the actual mantle value. However, Ne recycling into the Ne-rich, lower mantle is not significant (Staudacher and Allègre, 1988Staudacher, T., Allègre, C.J. (1988) Recycling of oceanic crust and sediments: the noble gas subduction barrier. Earth and Planetary Science Letters 89, 173–183.
; Holland and Ballentine, 2006Holland, G., Ballentine, C.J. (2006) Seawater subduction controls the heavy nobWe acknowledge the financial support from the UnivEarthS Labex program of Sorbonne Paris Cité (ANR-10-LABX-0023 and ANR-11-IDEX-0005-02).le gas composition of the mantle. Nature 441, 186–191.
). Finally, this model requires that enough Ne would have been dissolved into the Earth’s precursors (Mars-sized objects) because the solar nebula is blown in a few Ma (Wyatt et al., 2003Wyatt, M.C., Dent, W.R.F., Greaves, J.S. (2003) SCUBA observations of dust around Lindroos stars: evidence for a substantial submillimetre disc population. Monthly Notices of the Royal Astronomical Society 342, 876–888.
), well before Earth accretion has finished, which may be problematic because those objects cannot capture dense atmospheres.Implantation of solar wind ions onto grains has also been suggested to explain the very low D/H ratio of the lower mantle (highly negative δD of -218 ‰), measured in olivine-hosted melt inclusions of a Baffin Island sample (Hallis et al., 2015
Hallis, L.J., Huss, G.R., Nagashima, K., Taylor, G.J., Halldórsson, S.A., Hilton, D.R., Mottl, M.J., Meech, K.J. (2015) Evidence for primordial water in Earth’s deep mantle. Science 350, 795–797.
). The solar nebula δD ratio is -870 ‰ and so solar wind irradiation, a mechanism able to enrich grains in heavy isotopes, could explain the lower mantle value and could then be one of the sources of water on Earth (Hallis et al., 2015Hallis, L.J., Huss, G.R., Nagashima, K., Taylor, G.J., Halldórsson, S.A., Hilton, D.R., Mottl, M.J., Meech, K.J. (2015) Evidence for primordial water in Earth’s deep mantle. Science 350, 795–797.
). This scenario offers a simple alternative to explain light volatiles (H, He, Ne) origin on Earth.This study has put forward two major implications. First, it is more reliable to consider a mean of laser ablation data rather than taking the highest measured values to determine precisely mantle source compositions. Secondly, this new approach supports the model of solar wind irradiation associated with sputtering to explain He and Ne origin on Earth. Solar wind implantation is also likely a major source of Ar and H on Earth.
top
Acknowledgements
We thank Lukas Baumgartner for the generous access to the tomography facilities. We also thank Déborah Chavrit, Frédéric Moynier, Alberto E. Saal and John Creech for their constructive comments and discussion on the first versions of this manuscript. We acknowledge the financial support from the UnivEarthS Labex program of Sorbonne Paris Cité (ANR-10-LABX-0023 and ANR-11-IDEX-0005-02). The image for the graphical abstract was designed by Joël Dyon of IPGP.
Editor: Bruce Watson
top
References
Allègre, C.J., Staudacher, T., Sarda, P., Kurz, M.D. (1983) Constraints on evolution of Earth's mantle from rare gas systematics. Nature 303, 762–766.
 Show in context
The lower mantle is one plausible reservoir of primitive noble gases (Allègre et al., 1983), so some Oceanic Island Basalts (OIBs), which are presumed to sample the lower mantle, are of particular interest to determine the Earth’s primordial isotopic ratios.
View in article
Ballentine, C., Barfod, D. (2000) The origin of air-like noble gases in MORB and OIB. Earth and Planetary Science Letters 180, 39–48.
 Show in context
 The air component may be derived from post-eruption contamination when samples are recovered from the seafloor (Ballentine and Barfod, 2000).
View in article
Benkert, J.-P., Baur, H., Signer, P., Wieler, R. (1993) He, Ne and Ar from the Solar Wind and Solar Energetic Particles in lunar ilmenites and pyroxenes. Journal of Geophysical Research 98, 13147–13162.
 Show in context
Other studies suggest that the 38Ar/36Ar ratio is atmospheric in the Earth’s mantle (Trieloff et al., 2000; Raquin and Moreira, 2009; Mukhopadhyay, 2012), and lunar soils seem to have a 38Ar/36Ar ratio close to the atmospheric value even if the resolution is low (e.g., Eberhardt et al., 1972; Benkert et al., 1993).
View in article
Black, D.C. (1972) On the origins of trapped helium, neon and argon isotopic variations in meteorites—I. Gas-rich meteorites, lunar soil and breccia. Geochimica et Cosmochimica Acta 36, 347–375.
 Show in context
 The major noble gas carriers in the solar system are, among others, the solar wind (20Ne/22Ne = 13.8–14.0, 38Ar/36Ar = 0.1818–0.1828; Heber et al., 2009; Pepin et al., 2012), the component B (20Ne/22Ne = 12.5–12.7, 38Ar/36Ar = 0.1862 or 0.1919; Black, 1972; Raquin and Moreira, 2009; Moreira, 2013; Moreira and Charnoz, 2016), which corresponds to solar wind implantation and is mostly important for light noble gases, and the phase Q for heavy noble gases found in chondrites (20Ne/22Ne = 10.1–10.7, 38Ar/36Ar = 0.1873; Busemann et al., 2000).
View in article
The Ne-B 20Ne/22Ne ratio was determined from analyses of gas-rich meteorites and lunar soils, which have been exposed to solar wind irradiation for millions of years (12.52; Black, 1972; 12.8 on average; Eberhardt et al., 1972), and also from numerical simulations (12.73; Raquin and Moreira, 2009; Moreira, 2013; Moreira and Charnoz, 2016).
View in article
Burnard, P. (1999) The bubble-by-bubble volatile evolution of two mid-ocean ridge basalts. Earth and Planetary Science Letters 174, 199–211.
 Show in context
 In order to avoid the atmospheric component, laser ablation analyses were introduced (Burnard et al., 1997; Burnard, 1999), which involve targeting individual bubbles with a laser.
View in article
Burnard, P., Graham, D., Turner, G. (1997) Vesicle-specific noble gas analyses of "popping rock": implications for primordial noble gases in the Earth. Science 276, 568–571.
 Show in context
In order to avoid the atmospheric component, laser ablation analyses were introduced (Burnard et al., 1997; Burnard, 1999), which involve targeting individual bubbles with a laser.
View in article
Busemann, H., Baur, H., Wieler, R. (2000) Primordial noble gases in "phase Q" in carbonaceous and ordinary chondrites studied by closed-system stepped etching. Meteoritics and Planetary Science 35, 949–973.
 Show in context
 The major noble gas carriers in the solar system are, among others, the solar wind (20Ne/22Ne = 13.8–14.0, 38Ar/36Ar = 0.1818–0.1828; Heber et al., 2009; Pepin et al., 2012), the component B (20Ne/22Ne = 12.5–12.7, 38Ar/36Ar = 0.1862 or 0.1919; Black, 1972; Raquin and Moreira, 2009; Moreira, 2013; Moreira and Charnoz, 2016), which corresponds to solar wind implantation and is mostly important for light noble gases, and the phase Q for heavy noble gases found in chondrites (20Ne/22Ne = 10.1–10.7, 38Ar/36Ar = 0.1873; Busemann et al., 2000).
View in article
Figure 3 [...] The mean isotopic ratios, from the statistical analysis, are represented with the blue lines and the corresponding uncertainties (σ/√n) with the shaded areas. Solar wind (SW) (Heber et al., 2009; Pepin et al., 2012), Sun (Heber et al., 2012), Phase Q (Busemann et al., 2000).
View in article
Colin, A., Moreira, M., Gautheron, C., Burnard, P. (2015) Constraints on the noble gas composition of the deep mantle by bubble-by-bubble analysis of a volcanic glass sample from Iceland. Chemical Geology 417, 173–183.
 Show in context
Up to now, no laser ablation study allows us to clearly discriminate between the two scenarios for noble gas origin on Earth because of the scarcity of data and the poor accuracy (Raquin et al., 2008; Colin et al., 2015; Péron et al., 2016).
View in article
The new results are consistent with previous studies about the Hawaii and Iceland hotspots (Trieloff et al., 2000; Mukhopadhyay, 2012; Colin et al., 2015).
View in article
Eberhardt, P., Geiss, J., Graf, H., Grögler, N., Mendia, M.D., Mörgeli, M., Schwaller, H., Stettler, A., Krähenbühl, U., Von Gunten, H.R. (1972) Trapped solar wind noble gases in Apollo 12 lunar fines 12001 and Apollo 11 breccia 10046. Proceedings of the Third Lunar Science Conference, Supplement 3, Geochimica et Cosmochimica Acta, The MIT press 2, 1821–1856.
 Show in context
Other studies suggest that the 38Ar/36Ar ratio is atmospheric in the Earth’s mantle (Trieloff et al., 2000; Raquin and Moreira, 2009; Mukhopadhyay, 2012), and lunar soils seem to have a 38Ar/36Ar ratio close to the atmospheric value even if the resolution is low (e.g., Eberhardt et al., 1972; Benkert et al., 1993).
View in article
The Ne-B 20Ne/22Ne ratio was determined from analyses of gas-rich meteorites and lunar soils, which have been exposed to solar wind irradiation for millions of years (12.52; Black, 1972; 12.8 on average; Eberhardt et al., 1972), and also from numerical simulations (12.73; Raquin and Moreira, 2009; Moreira, 2013; Moreira and Charnoz, 2016).
View in article
Hallis, L.J., Huss, G.R., Nagashima, K., Taylor, G.J., Halldórsson, S.A., Hilton, D.R., Mottl, M.J., Meech, K.J. (2015) Evidence for primordial water in Earth’s deep mantle. Science 350, 795–797.
 Show in context
 Implantation of solar wind ions onto grains has also been suggested to explain the very low D/H ratio of the lower mantle (highly negative δD of -218 ‰), measured in olivine-hosted melt inclusions of a Baffin Island sample (Hallis et al., 2015).
View in article
The solar nebula δD ratio is -870 ‰ and so solar wind irradiation, a mechanism able to enrich grains in heavy isotopes, could explain the lower mantle value and could then be one of the sources of water on Earth (Hallis et al., 2015).
View in article
Heber, V.S., Wieler, R., Baur, H., Olinger, C., Friedmann, A., Burnett, D.S. (2009) Noble gas composition of the solar wind as collected by the Genesis mission. Geochimica et Cosmochimica Acta 73, 7414–7432.
 Show in context
 The major noble gas carriers in the solar system are, among others, the solar wind (20Ne/22Ne = 13.8–14.0, 38Ar/36Ar = 0.1818–0.1828; Heber et al., 2009; Pepin et al., 2012), the component B (20Ne/22Ne = 12.5–12.7, 38Ar/36Ar = 0.1862 or 0.1919; Black, 1972; Raquin and Moreira, 2009; Moreira, 2013; Moreira and Charnoz, 2016), which corresponds to solar wind implantation and is mostly important for light noble gases, and the phase Q for heavy noble gases found in chondrites (20Ne/22Ne = 10.1–10.7, 38Ar/36Ar = 0.1873; Busemann et al., 2000).
View in article
Figure 1 [...] Ne-B (Moreira, 2013), Sun (Heber et al., 2012), solar wind SW (Heber et al., 2009), mfl mass fractionation line.
View in article
Figure 3 [...] The mean isotopic ratios, from the statistical analysis, are represented with the blue lines and the corresponding uncertainties (σ/√n) with the shaded areas. Solar wind (SW) (Heber et al., 2009; Pepin et al., 2012), Sun (Heber et al., 2012), Phase Q (Busemann et al., 2000).
View in article
Heber, V.S., Baur, H., Bochsler, P., McKeegan, K.D., Neugebauer, M., Reisenfeld, D.B., Wieler, R., Wiens, R.C. (2012) Isotopic Mass Fractionation of Solar Wind: Evidence from Fast and Slow Solar Wind Collected by the Genesis mission. The Astrophysical Journal 759, 121.
 Show in context
 Figure 1 [...] Ne-B (Moreira, 2013), Sun (Heber et al., 2012), solar wind SW (Heber et al., 2009), mfl mass fractionation line.
View in article
Figure 3 [...] The mean isotopic ratios, from the statistical analysis, are represented with the blue lines and the corresponding uncertainties (σ/√n) with the shaded areas. Solar wind (SW) (Heber et al., 2009; Pepin et al., 2012), Sun (Heber et al., 2012), Phase Q (Busemann et al., 2000).
View in article
First, the mantle noble gas isotopic composition is different from the solar or solar wind compositions (the Sun 20Ne/22Ne ratio would be 13.34; Heber et al., 2012).
View in article
Holland, G., Ballentine, C.J. (2006) Seawater subduction controls the heavy noble gas composition of the mantle. Nature 441, 186–191.
 Show in context
 It may also come from atmospheric recycling through subduction for heavy noble gases (Ar, Kr, Xe) (Holland and Ballentine, 2006; Kendrick et al., 2011; Parai and Mukhopadhyay, 2015).
View in article
Even if recycling of heavy noble gases (Ar, Kr, Xe) through subduction may occur (Holland and Ballentine, 2006; Kendrick et al., 2011; Parai and Mukhopadhyay, 2015), recycling of He and Ne into the OIB gas-rich source is not significant (Staudacher and Allègre, 1988; Holland and Ballentine, 2006).
View in article
However, Ne recycling into the Ne-rich, lower mantle is not significant (Staudacher and Allègre, 1988; Holland and Ballentine, 2006).
View in article
Kendrick, M.A., Scambelluri, M., Honda, M., Phillips, D. (2011) High abundances of noble gas and chlorine delivered to the mantle by serpentine subduction. Nature Geoscience 4, 807–812.
 Show in context
 It may also come from atmospheric recycling through subduction for heavy noble gases (Ar, Kr, Xe) (Holland and Ballentine, 2006; Kendrick et al., 2011; Parai and Mukhopadhyay, 2015).
View in article
Even if recycling of heavy noble gases (Ar, Kr, Xe) through subduction may occur (Holland and Ballentine, 2006; Kendrick et al., 2011; Parai and Mukhopadhyay, 2015), recycling of He and Ne into the OIB gas-rich source is not significant (Staudacher and Allègre, 1988; Holland and Ballentine, 2006).
View in article
Kurz, M.D., Curtice, J., Fornari, D., Geist, D., Moreira, M. (2009) Primitive neon from the center of the Galápagos hotspot. Earth and Planetary Science Letters 286, 23–34.
 Show in context
 These OIB samples, AHA-NEMO2-D22A and AHA-NEMO2-D22B, were chosen due to their very primitive He and Ne compositions (Kurz et al., 2009), relatively high gas concentrations and thick glassy rinds (results are in Tables S-2 and S-3).
View in article
Moreira, M. (2013) Noble gas constraints on the origin and evolution of Earth's volatiles. Geochemical Perspectives 2, 229–403.
 Show in context
 The major noble gas carriers in the solar system are, among others, the solar wind (20Ne/22Ne = 13.8–14.0, 38Ar/36Ar = 0.1818–0.1828; Heber et al., 2009; Pepin et al., 2012), the component B (20Ne/22Ne = 12.5–12.7, 38Ar/36Ar = 0.1862 or 0.1919; Black, 1972; Raquin and Moreira, 2009; Moreira, 2013; Moreira and Charnoz, 2016), which corresponds to solar wind implantation and is mostly important for light noble gases, and the phase Q for heavy noble gases found in chondrites (20Ne/22Ne = 10.1–10.7, 38Ar/36Ar = 0.1873; Busemann et al., 2000).
View in article
Figure 1 [...] Ne-B (Moreira, 2013), Sun (Heber et al., 2012), solar wind SW (Heber et al., 2009), mfl mass fractionation line.
View in article
The Ne-B 20Ne/22Ne ratio was determined from analyses of gas-rich meteorites and lunar soils, which have been exposed to solar wind irradiation for millions of years (12.52; Black, 1972; 12.8 on average; Eberhardt et al., 1972), and also from numerical simulations (12.73; Raquin and Moreira, 2009; Moreira, 2013; Moreira and Charnoz, 2016).
View in article
Moreira, M., Charnoz, S. (2016) The origin of the neon isotopes in chondrites and on Earth. Earth and Planetary Science Letters 433, 249–256.
 Show in context
The major noble gas carriers in the solar system are, among others, the solar wind (20Ne/22Ne = 13.8–14.0, 38Ar/36Ar = 0.1818–0.1828; Heber et al., 2009; Pepin et al., 2012), the component B (20Ne/22Ne = 12.5–12.7, 38Ar/36Ar = 0.1862 or 0.1919; Black, 1972; Raquin and Moreira, 2009; Moreira, 2013; Moreira and Charnoz, 2016), which corresponds to solar wind implantation and is mostly important for light noble gases, and the phase Q for heavy noble gases found in chondrites (20Ne/22Ne = 10.1–10.7, 38Ar/36Ar = 0.1873; Busemann et al., 2000).
View in article
The Ne-B 20Ne/22Ne ratio was determined from analyses of gas-rich meteorites and lunar soils, which have been exposed to solar wind irradiation for millions of years (12.52; Black, 1972; 12.8 on average; Eberhardt et al., 1972), and also from numerical simulations (12.73; Raquin and Moreira, 2009; Moreira, 2013; Moreira and Charnoz, 2016).
View in article
Mukhopadhyay, S. (2012) Early differentiation and volatile accretion recorded in deep mantle Neon and Xenon. Nature 486, 101–104.
 Show in context
We analysed by laser ablation the noble gas compositions (He, Ne, Ar) of twenty vesicles of two submarine glass samples from Fernandina volcano (Galápagos), previously imaged via X-ray microtomography to locate the vesicles (Supplementary Information and Table S-1), with the aim of understanding the air contamination mechanisms, and refining the Earth’s primordial 20Ne/22Ne and 38Ar/36Ar ratios to evaluate the two models for noble gas origin on Earth; the solar wind implantation model (Trieloff et al., 2000; Raquin and Moreira, 2009) and the solar nebula gas dissolution model (Yokochi and Marty, 2004; Mukhopadhyay, 2012).
View in article
The new results are consistent with previous studies about the Hawaii and Iceland hotspots (Trieloff et al., 2000; Mukhopadhyay, 2012; Colin et al., 2015).
View in article
Other studies suggest that the 38Ar/36Ar ratio is atmospheric in the Earth’s mantle (Trieloff et al., 2000; Raquin and Moreira, 2009; Mukhopadhyay, 2012), and lunar soils seem to have a 38Ar/36Ar ratio close to the atmospheric value even if the resolution is low (e.g., Eberhardt et al., 1972; Benkert et al., 1993).
View in article
Previous step-crushing studies advocated that the early Earth would have captured a primordial atmosphere from solar nebula gas and that noble gases come from the dissolution of this early atmosphere into a magma ocean (Yokochi and Marty, 2004; Mukhopadhyay, 2012).
View in article
Parai, R., Mukhopadhyay, S. (2015) The evolution of MORB and plume mantle volatile budgets: Constraints from fission Xe isotopes in Southwest Indian Ridge basalts. Geochemistry, Geophysics, Geosystems 16, 719–735.
 Show in context
 It may also come from atmospheric recycling through subduction for heavy noble gases (Ar, Kr, Xe) (Holland and Ballentine, 2006; Kendrick et al., 2011; Parai and Mukhopadhyay, 2015).
View in article
Even if recycling of heavy noble gases (Ar, Kr, Xe) through subduction may occur (Holland and Ballentine, 2006; Kendrick et al., 2011; Parai and Mukhopadhyay, 2015), recycling of He and Ne into the OIB gas-rich source is not significant (Staudacher and Allègre, 1988; Holland and Ballentine, 2006).
View in article
Pepin, R.O., Schlutter, D.J., Becker, R.H., Reisenfeld, D.B. (2012) Helium, neon, and argon composition of the solar wind as recorded in gold and other Genesis collector materials. Geochimica et Cosmochimica Acta 89, 62–80.
 Show in context
 The major noble gas carriers in the solar system are, among others, the solar wind (20Ne/22Ne = 13.8–14.0, 38Ar/36Ar = 0.1818–0.1828; Heber et al., 2009; Pepin et al., 2012), the component B (20Ne/22Ne = 12.5–12.7, 38Ar/36Ar = 0.1862 or 0.1919; Black, 1972; Raquin and Moreira, 2009; Moreira, 2013; Moreira and Charnoz, 2016), which corresponds to solar wind implantation and is mostly important for light noble gases, and the phase Q for heavy noble gases found in chondrites (20Ne/22Ne = 10.1–10.7, 38Ar/36Ar = 0.1873; Busemann et al., 2000).
View in article
Figure 3 [...] The mean isotopic ratios, from the statistical analysis, are represented with the blue lines and the corresponding uncertainties (σ/√n) with the shaded areas. Solar wind (SW) (Heber et al., 2009; Pepin et al., 2012), Sun (Heber et al., 2012), Phase Q (Busemann et al., 2000).
View in article
Péron, S., Moreira, M., Colin, A., Arbaret, L., Putlitz, B., Kurz, M.D. (2016) Neon isotopic composition of the mantle constrained by single vesicle analyses. Earth and Planetary Science Letters 449, 145–154.
 Show in context
 Up to now, no laser ablation study allows us to clearly discriminate between the two scenarios for noble gas origin on Earth because of the scarcity of data and the poor accuracy (Raquin et al., 2008; Colin et al., 2015; Péron et al., 2016).
View in article
Figure 1 [...] Data from the literature for the same samples (Péron et al., 2016) are in orange diamonds and circles.
View in article
Figure 1 [...] The Fernandina source isotopic composition estimated from the statistical analysis with the new data is indicated with the green star, in comparison with the previous one (Péron et al., 2016) indicated with the grey square.
View in article
Figure 2 [...] Previous data are in orange diamonds and circles (Péron et al., 2016).
View in article
Figure 2 [...] The Fernandina source isotopic composition inferred from laser ablation data alone is indicated with the green star, in comparison with the previous one (Péron et al., 2016) indicated with the grey square.
View in article
The highest values of 12.91 ± 0.07 and 9407 ± 672 for the 20Ne/22Ne and 40Ar/36Ar ratios respectively obtained in a previous study of the same samples (Péron et al., 2016) seem to be slightly too high for the Fernandina mantle source within 2σ uncertainties.
View in article
The new results are consistent with this steady-state (Ne-B) composition and it may not be necessary to invoke non-steady state solar wind implantation onto grains to explain the lower mantle 20Ne/22Ne ratio (Péron et al., 2016).
View in article
Raquin, A., Moreira, M. (2009) Atmospheric 38Ar/36Ar in the mantle: Implications for the nature of the terrestrial parent bodies. Earth and Planetary Science Letters 287, 551–558.
 Show in context
 The major noble gas carriers in the solar system are, among others, the solar wind (20Ne/22Ne = 13.8–14.0, 38Ar/36Ar = 0.1818–0.1828; Heber et al., 2009; Pepin et al., 2012), the component B (20Ne/22Ne = 12.5–12.7, 38Ar/36Ar = 0.1862 or 0.1919; Black, 1972; Raquin and Moreira, 2009; Moreira, 2013; Moreira and Charnoz, 2016), which corresponds to solar wind implantation and is mostly important for light noble gases, and the phase Q for heavy noble gases found in chondrites (20Ne/22Ne = 10.1–10.7, 38Ar/36Ar = 0.1873; Busemann et al., 2000).
View in article
We analysed by laser ablation the noble gas compositions (He, Ne, Ar) of twenty vesicles of two submarine glass samples from Fernandina volcano (Galápagos), previously imaged via X-ray microtomography to locate the vesicles (Supplementary Information and Table S-1), with the aim of understanding the air contamination mechanisms, and refining the Earth’s primordial 20Ne/22Ne and 38Ar/36Ar ratios to evaluate the two models for noble gas origin on Earth; the solar wind implantation model (Trieloff et al., 2000; Raquin and Moreira, 2009) and the solar nebula gas dissolution model (Yokochi and Marty, 2004; Mukhopadhyay, 2012).
View in article
The Ne-B 20Ne/22Ne ratio was determined from analyses of gas-rich meteorites and lunar soils, which have been exposed to solar wind irradiation for millions of years (12.52; Black, 1972; 12.8 on average; Eberhardt et al., 1972), and also from numerical simulations (12.73; Raquin and Moreira, 2009; Moreira, 2013; Moreira and Charnoz, 2016).
View in article
Other studies suggest that the 38Ar/36Ar ratio is atmospheric in the Earth’s mantle (Trieloff et al., 2000; Raquin and Moreira, 2009; Mukhopadhyay, 2012), and lunar soils seem to have a 38Ar/36Ar ratio close to the atmospheric value even if the resolution is low (e.g., Eberhardt et al., 1972; Benkert et al., 1993).
View in article
Raquin, A., Moreira, M., Guillon, F. (2008) He, Ne and Ar systematics in single vesicles: Mantle isotopic ratios and origin of the air component in basaltic glasses. Earth and Planetary Science Letters 274, 142–150.
 Show in context
 Up to now, no laser ablation study allows us to clearly discriminate between the two scenarios for noble gas origin on Earth because of the scarcity of data and the poor accuracy (Raquin et al., 2008; Colin et al., 2015; Péron et al., 2016).
View in article
Ruzié, L., Moreira, M. (2010) Magma degassing process during Plinian eruptions. Journal of Volcanology and Geothermal Research 192, 142–150.
 Show in context
 We cannot exclude that isotopic fractionation occurs during bubble formation (Ruzié and Moreira, 2010), which could increase the 20Ne/22Ne ratio for a few bubbles, and also that slight sample heterogeneities exist, which could explain the small variability observed between the bubbles.
View in article
Staudacher, T., Allègre, C.J. (1988) Recycling of oceanic crust and sediments: the noble gas subduction barrier. Earth and Planetary Science Letters 89, 173–183.
 Show in context
 Even if recycling of heavy noble gases (Ar, Kr, Xe) through subduction may occur (Holland and Ballentine, 2006; Kendrick et al., 2011; Parai and Mukhopadhyay, 2015), recycling of He and Ne into the OIB gas-rich source is not significant (Staudacher and Allègre, 1988; Holland and Ballentine, 2006).
View in article
However, Ne recycling into the Ne-rich, lower mantle is not significant (Staudacher and Allègre, 1988; Holland and Ballentine, 2006).
View in article
Trieloff, M., Kunz, J., Clague, D.A., Harrison, D., Allègre, C.J. (2000) The Nature of pristine noble gases in mantle plumes. Science 288, 1036–1038.
 Show in context
 We analysed by laser ablation the noble gas compositions (He, Ne, Ar) of twenty vesicles of two submarine glass samples from Fernandina volcano (Galápagos), previously imaged via X-ray microtomography to locate the vesicles (Supplementary Information and Table S-1), with the aim of understanding the air contamination mechanisms, and refining the Earth’s primordial 20Ne/22Ne and 38Ar/36Ar ratios to evaluate the two models for noble gas origin on Earth; the solar wind implantation model (Trieloff et al., 2000; Raquin and Moreira, 2009) and the solar nebula gas dissolution model (Yokochi and Marty, 2004; Mukhopadhyay, 2012).
View in article
The new results are consistent with previous studies about the Hawaii and Iceland hotspots (Trieloff et al., 2000; Mukhopadhyay, 2012; Colin et al., 2015).
View in article
Other studies suggest that the 38Ar/36Ar ratio is atmospheric in the Earth’s mantle (Trieloff et al., 2000; Raquin and Moreira, 2009; Mukhopadhyay, 2012), and lunar soils seem to have a 38Ar/36Ar ratio close to the atmospheric value even if the resolution is low (e.g., Eberhardt et al., 1972; Benkert et al., 1993).
View in article
Wyatt, M.C., Dent, W.R.F., Greaves, J.S. (2003) SCUBA observations of dust around Lindroos stars: evidence for a substantial submillimetre disc population. Monthly Notices of the Royal Astronomical Society 342, 876–888.
 Show in context
 Finally, this model requires that enough Ne would have been dissolved into the Earth’s precursors (Mars-sized objects) because the solar nebula is blown in a few Ma (Wyatt et al., 2003), well before Earth accretion has finished, which may be problematic because those objects cannot capture dense atmospheres.
View in article
Yokochi, R., Marty, B. (2004) A determination of the neon isotopic composition of the deep mantle. Earth and Planetary Science Letters 225, 77–88.
 Show in context
 We analysed by laser ablation the noble gas compositions (He, Ne, Ar) of twenty vesicles of two submarine glass samples from Fernandina volcano (Galápagos), previously imaged via X-ray microtomography to locate the vesicles (Supplementary Information and Table S-1), with the aim of understanding the air contamination mechanisms, and refining the Earth’s primordial 20Ne/22Ne and 38Ar/36Ar ratios to evaluate the two models for noble gas origin on Earth; the solar wind implantation model (Trieloff et al., 2000; Raquin and Moreira, 2009) and the solar nebula gas dissolution model (Yokochi and Marty, 2004; Mukhopadhyay, 2012).
View in article
Previous step-crushing studies advocated that the early Earth would have captured a primordial atmosphere from solar nebula gas and that noble gases come from the dissolution of this early atmosphere into a magma ocean (Yokochi and Marty, 2004; Mukhopadhyay, 2012).
View in article
top
Supplementary Information
Material and Method
The method we followed, detailed hereafter, is similar to that described in Péron et al. (2016).
Samples
The two studied samples, AHA-NEMO2-D22A and AHA-NEMO2-D22B, were collected during the AHA-NEMO2 cruise on the western flank of Fernandina (Galápagos hotspot) (Geist et al., 2006). We selected big glass chunks (centimetre-sized) for laser ablation analyses and then polished them in order to have two large and flat parallel faces. It is better to have flat faces to focus the laser beam.
X-ray microtomography acquisitions
X-ray microtomography is of huge importance for laser ablation since the samples have low vesicularities (around 3–4 %; Péron et al., 2016). This non-destructive technique allows to precisely locate the bubbles in 3D before piercing them with the laser and to ensure that the vesicles are intact (i.e. that they are not connected to air via cracks).
The X-ray microtomography acquisitions were conducted at the Institute of Earth Sciences (Lausanne, Switzerland) on a Skyscan 1173 Brucker’s microtomograph. Sample images are obtained following two steps, (a) image acquisition, and (b) image reconstruction including artefact corrections (Ketcham and Carlson, 2001). For the volumetric reconstruction, a Feldkamp algorithm was used as implemented by the Skyscan Software package. Slices were corrected for beam hardening, misalignment and ring artifacts. Examples of slices are shown in Figures S-1, S-2, S-3 and S-4. We followed the same procedure as detailed in a previous study (Péron et al., 2016). The acquisition parameters as well as the resolution for each sample piece are indicated in Table S-1.
Laser ablation analyses
After being polished and imaged via X-ray microtomography, the samples were cleaned with ethanol and acetone. In addition, if weathering marks were visible, the samples were cleaned in oxalic acid (1 %) on a hot plate (60–80 °C) and then rinsed with distilled water.
The samples were then loaded into the laser cell, which was baked at 100 °C for several days. It was sometimes necessary to wait for two weeks before the blanks were sufficiently low to start the analyses. Laser ablation analyses were started as soon as the line blanks were about 2.8 x 10⁻¹⁰ cm3 of 4He, less than 1.8 x 10⁻¹³ cm3 of 22Ne and less than 1.8 x 10⁻¹² cm3 of 36Ar. To target the bubbles, an excimer (argon fluoride) laser of wavelength 193 nm was used (ATLEX-300i system) and the pressure in the laser cell was recorded with a MKS Baratron® manometer. A huge pressure increase meant that a bubble had been reached. If no vesicle was reached, the laser cell was pumped before starting a new ablation. The majority of the vesicles were reached in one laser shot but for a few bubbles it was necessary to perform several cycles of ablation/pumping. Since the manometer was calibrated with an air standard, we used the pressure increases to calculate the CO2 quantities in the vesicles, assuming that CO2 is the major gas (Moore et al., 1977). After piercing a vesicle, gases were purified with a Ti getter (at 800 °C for 5 minutes and then at ambient temperature) and a SAES getter and were then trapped onto activated charcoal (except He). Vesicles between 10 and 220 µm deep were analysed (Table S-2) and no influence of depth on the vesicle compositions has been noticed.
Since gases dissolved into the matrix were also released during the ablation (this could be seen on the manometric signal), we corrected the laser ablation analyses with matrix blanks. For that, we pierced the matrix during the same ablation time as for reaching the bubbles (Tables S-4 and S-5). We noticed that the matrix of all sample pieces has an atmospheric composition (Table S-5) and that the ablation time does not seem to have an influence on the matrix blank composition. Hence, we corrected the vesicle composition with a matrix blank that was carried out just before or just after the vesicle analysis. The He matrix blank represented less than 7 % for all the bubbles (except vesicle V11 for which the blank was 12 %), the Ne matrix blank was less than 25 % for the majority of the vesicles (otherwise the Ne matrix blank was between 45 % and 65 % for a few bubbles), the Ar matrix blank was between 25 % and 90 %. Noble gases were measured on a Noblesse multi-collector mass spectrometer (Nu instruments ©). To correct for interferences of HF+ and 40Ar++ with 20Ne+ and also interferences of CO2++ with 22Ne+, we performed a scan of HF before introducing the neon into the mass spectrometer and during the neon cycles we also analysed the mass 40 and 44. Since we determined the ionisation ratios 40Ar++/40Ar+ (0.075) and CO2++/CO2+ (0.01) for the Noblesse mass spectrometer, we then corrected the 20Ne and 22Ne abundances. Two standards were used in this study, an air standard and a homemade standard, which was previously described (Péron et al., 2016).
The 4He/40Ar* ratio is a proxy of degassing process because of helium and argon solubility differences and undegassed samples have 3 < 4He/40Ar* < 5 (Moreira and Kurz, 2013). The 4He/40Ar* ratio of the analysed vesicles is 3.50 ± 0.06 (Table S-3), therefore the samples were not extensively degassed, and noble gases were not fractionated between each other.
Laser ablation analysis, associated with X-ray microtomography, is a powerful technique to measure mantle source compositions without atmospheric contamination. Indeed, all the vesicles have similar compositions (Figs. 1, 2, S-5 and S-8), except the two vesicles V4B and V16B, for which cracks were identified (Figs. S-1 and S-2). Figure S-8 shows that the vesicle 40Ar/36Ar ratios do not change depending on 36Ar concentrations (except for vesicles V4B and V16B), which is a strong argument against atmospheric contamination of the bubbles through invisible cracks. Matrix effects (Raquin et al., 2008) must be very limited on these new analyses. Indeed, the matrix blank compositions are homogeneous and do not depend on the ablation time (Tables S-4 and S-5). Moreover, the ablation times for reaching the vesicles (Table S-3) were typically very short. For all these reasons, we do not expect post-eruption contamination of the bubbles, either on the seafloor or from the matrix during laser ablation.
Moreover, the Cl/K ratios for samples AHA-NEMO2-D22A and D22B are about 0.04–0.06 (Alberto Saal, personal communication), which corresponds to values for uncontaminated OIBs (Koleszar et al., 2009). This suggests that assimilation of altered oceanic crust has not occurred or at least has been rather limited for these samples.
Statistical analysis
All the vesicles analysed show similar isotopic compositions (except the vesicles V4B and V16B which are contaminated). This means that they all represent the same source and it is interesting to compute mean isotopic ratios in order to evaluate the source composition. First a Gaussian distribution ƒ is considered for each vesicle isotopic ratio,

where μ is the measured isotopic ratio and σ is the associated measurement uncertainty. The interval x is chosen depending on the isotopic ratio considered. For example, for the 20Ne/22Ne ratio, x varies from 9 to 14 (Fig. 3). Then, the sum of all the Gaussian distributions for a given isotopic ratio gives a cumulative global curve. This method was used for the 20Ne/22Ne, 21Ne/22Ne, 38Ar/36Ar and 40Ar/36Ar ratios (Figs. 3, S-6 and S-7). In each case, the global curves also correspond to Gaussian distributions except for the 40Ar/36Ar ratio. This shows that mean isotopic ratios have to be taken instead of maximum values. Therefore, these global curves are fitted with Gaussian curves (except for the 40Ar/36Ar ratio) to derive mean isotopic ratios and the associated uncertainty σ. For this statistical analysis, all the vesicles except the two contaminated ones (V4B and V16B) are used, which consists of 18 data.
It is important to note that this statistical analysis can be used providing that all the data represent the same composition, which is the case in this study as already mentioned. Moreover, this new approach is particularly useful when a small number of data are considered because it gives more weight to the more accurate data. This is shown on Figures 3 and S-5 where the vesicle V9B associated with low uncertainties has much more influence on the global cumulative curves than vesicle V6B for which uncertainties are large. The final errors on the computed mean isotopic ratios are thus σ/√n (with n = 18).

Figure S-1 X-ray microtomography image of the sample AHA-NEMO2-D22B (piece 1, Table S-1). (a) Example of one slice of the sample with the vesicle V4B at the middle top (the scale bar is 1,000 μm) and (b) is a zoom on this vesicle (black square) to show the location (the scale bar is 300 μm). On these images, vesicles are in white and the glass matrix is in grey as well as a few crystals. A network of cracks (in white) is clearly visible. Vesicle V4B is very close to the surface and is likely contaminated due to a small connection to air.

Figure S-2 X-ray microtomography image of the sample AHA-NEMO2-D22B (piece 2, Table S-1) to show the location of vesicle V16B. The original slice is represented in (a) and the very tiny crack just above the vesicle V16B is indicated by a black line in (b). To reach the vesicle, the laser also pierced the crack, which introduced air. The scale bars are 1,000 μm. (Refer also to the legend of Fig. S-1).

Figure S-3 X-ray microtomography image of the sample AHA-NEMO2-D22B (piece 3, Table S-1) to show the location of vesicle V14B. The original slice is represented in (a) and vesicle V14B is indicated with a black square (the scale bar is 1,000 μm), (b) is a zoom on this vesicle to show what surrounds it (the scale bar is 260 μm). (Refer also to the legend of Fig. S-1). Vesicle V14B has a low 20Ne/22Ne ratio (Table S-3) but no crack is visible on the images. This vesicle is unlikely to be contaminated because the 40Ar/36Ar ratio is 7155 ± 1546.

Figure S-4 X-ray microtomography image of the sample AHA-NEMO2-D22B (piece 2, Table S-1). This shows an example of a non-contaminated vesicle, vesicle V15B, which is the biggest vesicle analysed. The scale bar is 1,000 μm. (Refer also to the legend of Fig. S-1).

Figure S-5 40Ar/36Ar vs 38Ar/36Ar for the vesicles. The Fernandina (Galápagos) source composition is indicated with the green star. The two light blue circles correspond to the two contaminated vesicles (V4B and V16B). Vesicles V2A and V11B are not represented because their uncertainties are too large.

Figure S-6 Gaussian curves obtained for the 21Ne/22Ne ratio. The light blue dotted curve is the cumulative Gaussian curve taking into account all the vesicles (except V4B and V16B), the dark blue curve is the Gaussian fit. Examples of two Gaussian curves are indicated for some vesicles: vesicle V9 (orange dotted curve) has low uncertainties and contributes strongly to the global Gaussian curve, vesicle V6 (green curve) is poorly constrained and has nearly no influence on the global curve. The mean isotopic ratio (0.0345) determined with the statistical analysis is represented with the solid blue line. The shaded area corresponds to σ/√n = ±0.0004. For comparison, air composition is indicated.

Figure S-7 Cumulative curve obtained for the 40Ar/36Ar ratio taking into account all the vesicles (except V4B and V16B). This curve cannot be correctly fitted with a Gaussian curve. The 40Ar/36Ar ratio is between 6000 and 7000 for the Fernandina source.

Figure S-8 40Ar/36Ar vs 36Ar (in cm3 STP) for the vesicles. The two contaminated vesicles (V4B and V16B) are in light blue. Except for these two bubbles, the 40Ar/36Ar ratio does not change with the 36Ar concentration, which indicates that the vesicles are not contaminated by air. Vesicles V2A and V11B are not represented because they have too large uncertainties.
Table S-1 Acquisition parameters for X-ray microtomography. The experiments were conducted at the Institute of Earth Sciences (Lausanne, Switzerland) on a Skyscan 1173 system. One piece of sample AHA-NEMO2-D22A has been studied and four for sample AHA-NEMO2-D22B. The piece number is indicated as well as the voltage (in kV), the current (in µA), the rotation step size (in degrees), the number of frames (which is the number of images taken for one position), the filter type used and the resolution (in µm per pixel). The resolution in µm3 per voxel (1 voxel = 1 x 1 x 1 pixel) is the cubic resolution in µm per pixel.
| Sample | # | Voltage | Current | Rotation step size | Number of frames | Filter | Pixel size |
| kV | µA | ° | µm | ||||
| AHA-NEMO2-D22A | 1 | 70 | 114 | 0.225 | 4 | Al 1.0 mm | 5.7 |
| AHA-NEMO2-D22B | 1 | 70 | 114 | 0.225 | 4 | Al 1.0 mm | 8.2 |
| AHA-NEMO2-D22B | 2 | 70 | 114 | 0.225 | 4 | Al 1.0 mm | 6.4 |
| AHA-NEMO2-D22B | 3 | 70 | 114 | 0.225 | 4 | Al 1.0 mm | 5.7 |
| AHA-NEMO2-D22B | 4 | 70 | 114 | 0.225 | 8 | Al 1.0 mm | 9.3 |
Table S-2 CO2 and noble gas (4He, 22Ne and 36Ar) abundances (in cm3 STP) for all the vesicles for samples AHA-NEMO2-D22A and AHA-NEMO2-D22B (Fernandina, Galápagos). The ablation time for each vesicle is indicated in brackets. The piece number (refer to Table S-1) and the depth of each vesicle below the sample surface are mentioned. The vesicle volumes were calculated with the 3D Object Counter plugin of ImageJ. The CO2 contents were determined using the pressure jump recorded on the manometer, calibrated with the air standard, and assuming that CO2 is the major gas (Moore et al., 1977). Errors are 1 sigma uncertainties.
| Sample | # | Depth | Volume | CO2 | ± | 4He | ± | 22Ne | ± | 36Ar | ± |
| µm | x106 µm3 | x10-4 cm3 | x10-8 cm3 | x10-13 cm3 | x10-13 cm3 | ||||||
| AHA-NEMO2-D22A vesicles | |||||||||||
| V1A (2’02”) | 1 | 100 | 15.6 | 10.3 | 1.00 | 2.06 | 0.09 | 3.74 | 0.29 | 9.25 | 0.38 |
| V2A (25”) | 1 | 48 | 11.6 | 7.45 | 0.72 | 1.48 | 0.09 | 2.70 | 0.27 | 1.72 | 0.38 |
| AHA-NEMO2-D22B vesicles | |||||||||||
| V1B (41”) | 1 | 15 | 34.3 | 22.1 | 2.10 | 4.34 | 0.08 | 8.35 | 0.26 | 22.6 | 0.38 |
| V2B (16”) | 1 | 20 | 10.5 | 6.48 | 0.64 | 1.29 | 0.08 | 1.90 | 0.26 | 5.09 | 0.36 |
| V3B (2’02”) | 1 | 110 | 29.6 | 18.9 | 1.80 | 3.75 | 0.08 | 6.10 | 0.26 | 15.7 | 0.37 |
| V4B (12”) | 1 | 22 | 16.3 | 10.2 | 1.00 | 1.96 | 0.08 | 4.51 | 0.26 | 34.6 | 0.42 |
| V5B (30”) | 1 | 60 | 4.1 | 2.64 | 0.31 | 0.51 | 0.08 | 0.99 | 0.26 | 2.84 | 0.36 |
| V6B (1’50”) | 2 | 50 | 4.8 | 3.04 | 0.34 | 0.60 | 0.09 | 1.01 | 0.26 | 3.00 | 0.37 |
| V7B (16”) | 4 | 90 | 32.5 | 19.6 | 1.90 | 3.82 | 0.09 | 6.95 | 0.33 | 19.5 | 0.45 |
| V8B (17”) | 4 | 110 | 19.1 | 12.6 | 1.20 | 2.44 | 0.09 | 3.91 | 0.28 | 11.4 | 0.40 |
| V9B (50”) | 3 | 155 | 26.7 | 16.9 | 1.60 | 3.36 | 0.09 | 6.40 | 0.32 | 14.5 | 0.42 |
| V10B (40”) | 3 | 195 | 14.8 | 9.48 | 0.91 | 1.89 | 0.09 | 3.44 | 0.28 | 8.49 | 0.39 |
| V11B (8”) | 4 | 18 | 1.0 | 1.41 | 0.22 | 0.29 | 0.09 | 0.50 | 0.26 | 1.08 | 0.37 |
| V12B (15”) | 4 | 100 | 9.4 | 5.97 | 0.59 | 1.18 | 0.09 | 2.67 | 0.27 | 4.88 | 0.38 |
| V13B (23”) | 3 | 130 | 11.5 | 7.31 | 0.71 | 1.45 | 0.09 | 2.72 | 0.27 | 5.74 | 0.38 |
| V14B (25”) | 3 | 155 | 11.4 | 6.87 | 0.67 | 1.32 | 0.09 | 2.48 | 0.27 | 5.57 | 0.38 |
| V15B (25”) | 2 | 90 | 35.9 | 22.7 | 2.10 | 4.44 | 0.09 | 7.38 | 0.34 | 19.2 | 0.41 |
| V16B (3’39”) | 2 | 145 | 25.7 | 15.8 | 1.50 | 3.13 | 0.09 | 6.49 | 0.33 | 23.6 | 0.42 |
| V17B (3’) | 1 | 220 | 26.0 | 15.4 | 1.50 | 3.03 | 0.09 | 5.59 | 0.33 | 12.4 | 0.39 |
| V18B (45”) | 2 | 100 | 31.2 | 19.5 | 1.80 | 3.86 | 0.09 | 6.61 | 0.36 | 14.1 | 0.39 |
Table S-3 Isotopic compositions of the vesicles for samples AHA-NEMO2-D22A and AHA-NEMO2-D22B (Fernandina, Galápagos). Ra is the air 3He/4He ratio and is equal to 1.384 x 10⁻⁶ (Clarke et al., 1976) . 40Ar* is radiogenic 40Ar. We consider a 40Ar/36Ar ratio of 298.6 for the air (Lee et al., 2006) to determine the 40Ar/36Ar and 4He/40Ar* ratios. n.d. means not determined when gases from the vesicle are indistinguishable from the matrix blank. Errors are 1 sigma uncertainties.
| Sample | CO2/3He | ± | 3He/4He | ± | 20Ne/22Ne | ± | 21Ne/22Ne | ± | 38Ar/36Ar | ± | 40Ar/36Ar | ± | 4He/40Ar* | ± |
| x109 | (xRa) | |||||||||||||
| AHA-NEMO2-D22A vesicles | ||||||||||||||
| V1A | 1.55 | 0.17 | 23.50 | 0.56 | 12.67 | 0.13 | 0.0373 | 0.0017 | 0.2043 | 0.0039 | 6674 | 1072 | 3.49 | 0.62 |
| V2A | 1.64 | 0.19 | 22.15 | 0.63 | 12.66 | 0.19 | 0.0373 | 0.0014 | 0.1967 | 0.0145 | n.d. | n.d. | 3.53 | 2.52 |
| AHA-NEMO2-D22B vesicles | ||||||||||||||
| V1B | 1.62 | 0.16 | 22.74 | 0.49 | 12.54 | 0.07 | 0.0350 | 0.0009 | 0.1884 | 0.0018 | 5809 | 425 | 3.48 | 0.28 |
| V2B | 1.61 | 0.19 | 22.60 | 0.56 | 13.07 | 0.27 | 0.0353 | 0.0026 | 0.2019 | 0.0084 | 7601 | 2208 | 3.47 | 1.10 |
| V3B | 1.56 | 0.16 | 23.28 | 0.52 | 12.83 | 0.09 | 0.0330 | 0.0010 | 0.1901 | 0.0027 | 7171 | 674 | 3.47 | 0.36 |
| V4B | 1.66 | 0.18 | 22.61 | 0.62 | 11.92 | 0.11 | 0.0347 | 0.0015 | 0.1892 | 0.0016 | 1962 | 59 | 3.41 | 0.19 |
| V5B | 1.63 | 0.34 | 22.97 | 0.76 | 12.33 | 0.36 | 0.0323 | 0.0045 | 0.1974 | 0.0094 | 5426 | 2641 | 3.50 | 1.95 |
| V6B | 1.69 | 0.31 | 21.58 | 0.46 | 12.99 | 0.55 | 0.0399 | 0.0054 | 0.1711 | 0.0153 | 6138 | 2197 | 3.43 | 1.44 |
| V7B | 1.62 | 0.16 | 22.92 | 0.43 | 12.73 | 0.09 | 0.0335 | 0.0011 | 0.1877 | 0.0017 | 6038 | 332 | 3.42 | 0.23 |
| V8B | 1.62 | 0.17 | 23.16 | 0.47 | 12.64 | 0.13 | 0.0352 | 0.0017 | 0.1905 | 0.0029 | 6350 | 593 | 3.52 | 0.39 |
| V9B | 1.58 | 0.16 | 23.07 | 0.46 | 12.64 | 0.10 | 0.0338 | 0.0015 | 0.1889 | 0.0024 | 6880 | 597 | 3.51 | 0.35 |
| V10B | 1.53 | 0.17 | 23.65 | 0.58 | 12.55 | 0.11 | 0.0314 | 0.0023 | 0.1865 | 0.0035 | 6525 | 966 | 3.57 | 0.60 |
| V11B | 1.64 | 0.56 | 21.79 | 1.24 | 12.00 | 0.44 | 0.0297 | 0.0051 | n.d. | n.d. | n.d. | n.d. | n.d. | n.d. |
| V12B | 1.54 | 0.19 | 23.59 | 0.54 | 12.52 | 0.17 | 0.0360 | 0.0020 | 0.1721 | 0.0088 | 7019 | 1646 | 3.61 | 0.96 |
| V13B | 1.61 | 0.19 | 22.57 | 0.66 | 12.59 | 0.12 | 0.0350 | 0.0017 | 0.1744 | 0.0068 | 7453 | 1490 | 3.53 | 0.80 |
| V14B | 1.68 | 0.20 | 22.46 | 0.58 | 12.17 | 0.13 | 0.0323 | 0.0020 | 0.1958 | 0.0053 | 7155 | 1546 | 3.45 | 0.84 |
| V15B | 1.60 | 0.16 | 23.11 | 0.45 | 12.74 | 0.09 | 0.0346 | 0.0010 | 0.1895 | 0.0019 | 6927 | 642 | 3.48 | 0.35 |
| V16B | 1.57 | 0.16 | 23.36 | 0.46 | 12.34 | 0.09 | 0.0330 | 0.0015 | 0.1842 | 0.0020 | 4101 | 300 | 3.49 | 0.30 |
| V17B | 1.64 | 0.17 | 22.47 | 0.51 | 12.58 | 0.07 | 0.0345 | 0.0009 | 0.1877 | 0.0023 | 7142 | 723 | 3.56 | 0.41 |
| V18B | 1.59 | 0.16 | 22.85 | 0.56 | 12.81 | 0.07 | 0.0345 | 0.0011 | 0.1891 | 0.0018 | 8206 | 695 | 3.47 | 0.33 |
Table S-4 Noble gas abundances of the matrix blanks (in cm3 STP) for samples AHA-NEMO2-D22A and AHA-NEMO2-D22B (Fernandina, Galápagos). The ablation times are indicated in brackets. Errors are 1 sigma uncertainties.
| Sample | 4He | ± | 22Ne | ± | 36Ar | ± |
| x10-10 cm3 | x10-13 cm3 | x10-12 cm3 | ||||
| AHA-NEMO2-D22A matrix | ||||||
| Blank 1 (2’02”) | 3.98 | 0.28 | 1.01 | 0.23 | 1.55 | 0.03 |
| Blank 2 (25”) | 3.59 | 0.28 | 0.91 | 0.23 | 1.17 | 0.03 |
| AHA-NEMO2-D22B matrix | ||||||
| Blank 1 (41”) | 3.69 | 0.28 | 1.29 | 0.23 | 1.74 | 0.03 |
| Blank 2 (16”) | 3.83 | 0.28 | 1.50 | 0.23 | 1.54 | 0.03 |
| Blank 3 (2’01”) | 3.78 | 0.28 | 1.15 | 0.23 | 1.18 | 0.03 |
| Blank 4 (15”) | 3.83 | 0.28 | 1.07 | 0.23 | 1.46 | 0.03 |
| Blank 5 (2’) | 3.69 | 0.28 | 1.33 | 0.23 | 1.13 | 0.03 |
| Blank 6 (4’30”) | 3.90 | 0.28 | 0.76 | 0.23 | 1.12 | 0.03 |
| Blank 7 (50”) | 3.92 | 0.28 | 0.79 | 0.23 | 1.32 | 0.03 |
| Blank 8 (16”) | 4.00 | 0.28 | 0.84 | 0.23 | 1.20 | 0.03 |
| Blank 9 (25”) | 4.37 | 0.28 | 0.79 | 0.23 | 1.25 | 0.03 |
| Blank 10 (27”) | 3.71 | 0.28 | 0.91 | 0.23 | 1.86 | 0.03 |
| Blank 11 (3’) | 3.56 | 0.28 | 1.75 | 0.24 | 1.98 | 0.03 |
| Blank 12 (3’) | 3.85 | 0.28 | 0.63 | 0.23 | 1.31 | 0.03 |
| Blank 13 (45”) | 3.86 | 0.28 | 0.74 | 0.23 | 1.24 | 0.03 |
Table S-5 Isotopic compositions of the matrix blanks for samples AHA-NEMO2-D22A and AHA-NEMO2-D22B (Fernandina, Galápagos). Errors are 1 sigma uncertainties.
| Sample | 3He/4He | ± | 20Ne/22Ne | ± | 21Ne/22Ne | ± | 38Ar/36Ar | ± | 40Ar/36Ar | ± |
| (xRa) | ||||||||||
| AHA-NEMO2-D22A matrix | ||||||||||
| Blank 1 (2’02”) | 1.9 | 0.6 | 10.40 | 0.16 | 0.0278 | 0.0022 | 0.1901 | 0.0011 | 297 | 2 |
| Blank 2 (25”) | 1.8 | 0.6 | 10.13 | 0.17 | 0.0297 | 0.0024 | 0.1933 | 0.0014 | 296 | 2 |
| AHA-NEMO2-D22B matrix | ||||||||||
| Blank 1 (41”) | 1.5 | 0.5 | 10.26 | 0.09 | 0.0247 | 0.0021 | 0.1886 | 0.0016 | 299 | 2 |
| Blank 2 (16”) | 1.0 | 0.5 | 10.00 | 0.09 | 0.0322 | 0.0020 | 0.1839 | 0.0020 | 296 | 3 |
| Blank 3 (2’01”) | 1.1 | 0.7 | 10.18 | 0.18 | 0.0285 | 0.0033 | 0.1954 | 0.0018 | 296 | 3 |
| Blank 4 (15”) | 6.5 | 0.8 | 10.07 | 0.16 | 0.0312 | 0.0018 | 0.1913 | 0.0014 | 291 | 3 |
| Blank 5 (2’) | 1.8 | 0.4 | 10.23 | 0.22 | 0.0293 | 0.0019 | 0.2027 | 0.0014 | 309 | 2 |
| Blank 6 (4’30”) | 2.2 | 0.8 | 9.99 | 0.17 | 0.0304 | 0.0026 | 0.2001 | 0.0018 | 301 | 2 |
| Blank 7 (50”) | 15.5 | 15.0 | 10.42 | 0.11 | 0.0350 | 0.0027 | 0.1964 | 0.0015 | 290 | 2 |
| Blank 8 (16”) | 2.3 | 5.2 | 10.26 | 0.11 | 0.0305 | 0.0014 | 0.2000 | 0.0014 | 303 | 2 |
| Blank 9 (25”) | 1.1 | 0.7 | 10.24 | 0.15 | 0.0301 | 0.0038 | 0.1889 | 0.0017 | 293 | 2 |
| Blank 10 (27”) | 2.6 | 0.6 | 10.46 | 0.12 | 0.0304 | 0.0028 | 0.1922 | 0.0011 | 300 | 1 |
| Blank 11 (3’) | 2.6 | 0.9 | 10.02 | 0.16 | 0.0308 | 0.0021 | 0.2039 | 0.0013 | 312 | 2 |
| Blank 12 (3’) | 1.0 | 0.6 | 10.26 | 0.21 | 0.0351 | 0.0021 | 0.1989 | 0.0011 | 303 | 2 |
| Blank 13 (45”) | 1.8 | 0.6 | 10.56 | 0.20 | 0.0299 | 0.0020 | 0.1912 | 0.0010 | 301 | 2 |
Supplementary Information References
Geist, D., Fornari, D., Kurz , M.D., Harpp, K.S., Soule, S.A., Perfit, M.R., Koleszar, A.M. (2006) Submarine Fernandina: Magmatism at the leading edge of the Galapagos hot spot. Geochemistry, Geophysics, Geosystems 7, Q12007.
Ketcham, R.A., Carlson, W.D. (2001) Acquisition, optimization and interpretation of X-ray computed tomographic imagery: applications to the geosciences. Computers & Geosciences 27, 381–400.
Koleszar, A.M., Saal, A.E., Hauri, E.H., Nagle, A.N., Liang, Y., Kurz, M.D. (2009) The volatile contents of the Galapagos plume; evidence for H2O and F open system behavior in melt inclusions. Earth and Planetary Science Letters 287, 442–452.
Lee, J.-Y., Marti, K., Severinghaus, J.P., Kawamura, K., Yoo, H.-S., Lee, J., Kim, J. (2006) A redetermination of the isotopic abundances of atmospheric Ar. Geochimica et Cosmochimica Acta 70, 4507–4512.
Moore, J.G., Batchelder, J.N., Cunningham, C.G. (1977) CO2-filled vesicles in mid-ocean basalt. Journal of Volcanology and Geothermal Research 2, 309–327.
Moreira, M.A., Kurz, M.D. (2013) Noble Gases as Tracers of Mantle Processes and Magmatic Degassing. In: Burnard, P. (Ed.) The Noble Gases as Geochemical Tracers. Springer, Berlin, Heidelberg, 371–391.
Péron, S., Moreira, M., Colin, A., Arbaret, L., Putlitz, B., Kurz, M.D. (2016) Neon isotopic composition of the mantle constrained by single vesicle analyses. Earth and Planetary Science Letters 449, 145–154.
Raquin, A., Moreira, M., Guillon, F. (2008) He, Ne and Ar systematics in single vesicles: Mantle isotopic ratios and origin of the air component in basaltic glasses. Earth and Planetary Science Letters 274, 142–150.
Figures and Tables
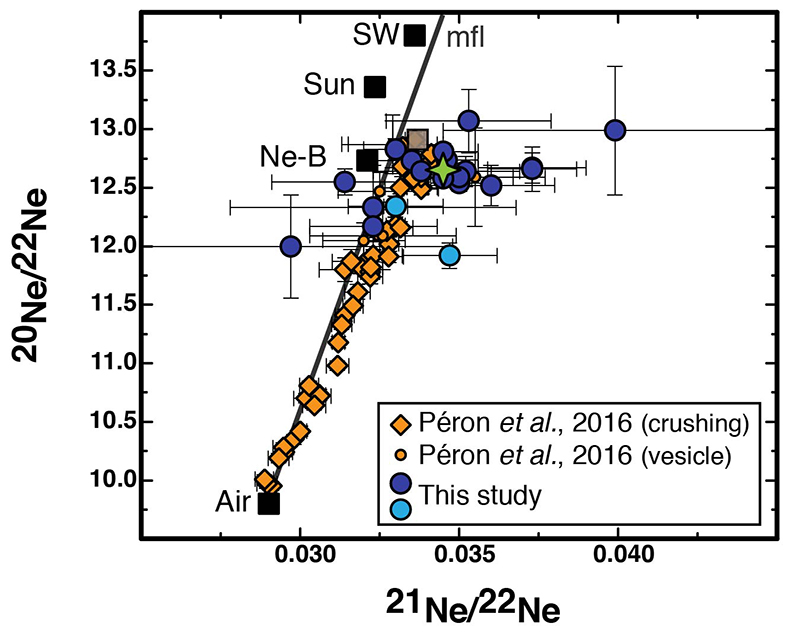
Figure 1 The three neon isotopes plot for the vesicles. Data from the literature for the same samples (Péron et al., 2016
Péron, S., Moreira, M., Colin, A., Arbaret, L., Putlitz, B., Kurz, M.D. (2016) Neon isotopic composition of the mantle constrained by single vesicle analyses. Earth and Planetary Science Letters 449, 145–154.
) are in orange diamonds and circles. The new data are in blue circles, the two vesicles in light blue (V4B and V16B) are assumed to be air contaminated (Figs. S-1, S-4). The Fernandina source isotopic composition estimated from the statistical analysis with the new data is indicated with the green star, in comparison with the previous one (Péron et al., 2016Péron, S., Moreira, M., Colin, A., Arbaret, L., Putlitz, B., Kurz, M.D. (2016) Neon isotopic composition of the mantle constrained by single vesicle analyses. Earth and Planetary Science Letters 449, 145–154.
) indicated with the grey square. Ne-B (Moreira, 2013Moreira, M. (2013) Noble gas constraints on the origin and evolution of Earth's volatiles. Geochemical Perspectives 2, 229–403.
), Sun (Heber et al., 2012Heber, V.S., Baur, H., Bochsler, P., McKeegan, K.D., Neugebauer, M., Reisenfeld, D.B., Wieler, R., Wiens, R.C. (2012) Isotopic Mass Fractionation of Solar Wind: Evidence from Fast and Slow Solar Wind Collected by the Genesis mission. The Astrophysical Journal 759, 121.
), solar wind SW (Heber et al., 2009Heber, V.S., Wieler, R., Baur, H., Olinger, C., Friedmann, A., Burnett, D.S. (2009) Noble gas composition of the solar wind as collected by the Genesis mission. Geochimica et Cosmochimica Acta 73, 7414-7432.
), mfl mass fractionation line.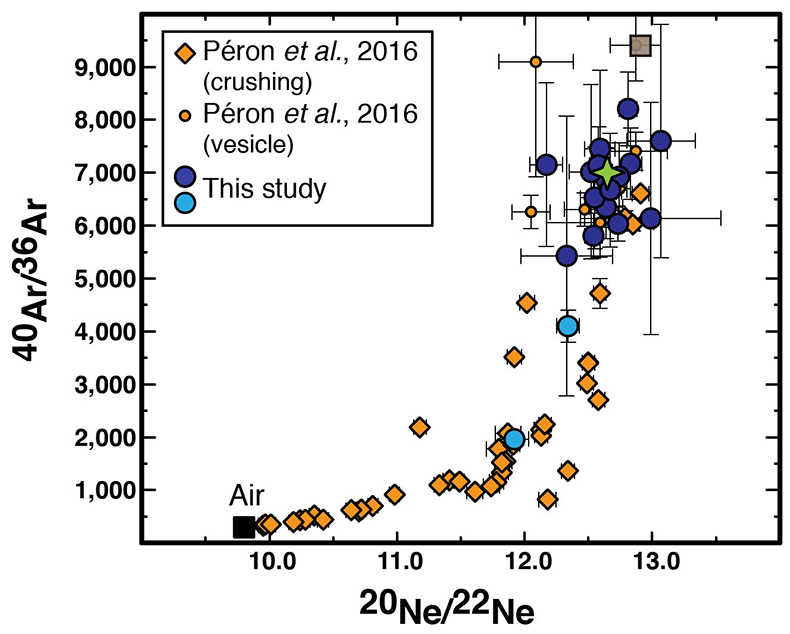
Figure 2 40Ar/36Ar ratio vs 20Ne/22Ne ratio for the vesicles. The latter are in blue circles (vesicles V2A and V11B have too large uncertainties and are not represented). Previous data are in orange diamonds and circles (Péron et al., 2016
Péron, S., Moreira, M., Colin, A., Arbaret, L., Putlitz, B., Kurz, M.D. (2016) Neon isotopic composition of the mantle constrained by single vesicle analyses. Earth and Planetary Science Letters 449, 145–154.
). The two vesicles in light blue (V4B and V16B) are assumed to be air contaminated, as indicated by the 40Ar/36Ar data, along with distribution of microcracks (Figs. S-1, S-2, S-3, S-4, S-8). The Fernandina source isotopic composition inferred from laser ablation data alone is indicated with the green star, in comparison with the previous one (Péron et al., 2016Péron, S., Moreira, M., Colin, A., Arbaret, L., Putlitz, B., Kurz, M.D. (2016) Neon isotopic composition of the mantle constrained by single vesicle analyses. Earth and Planetary Science Letters 449, 145–154.
) indicated with the grey square.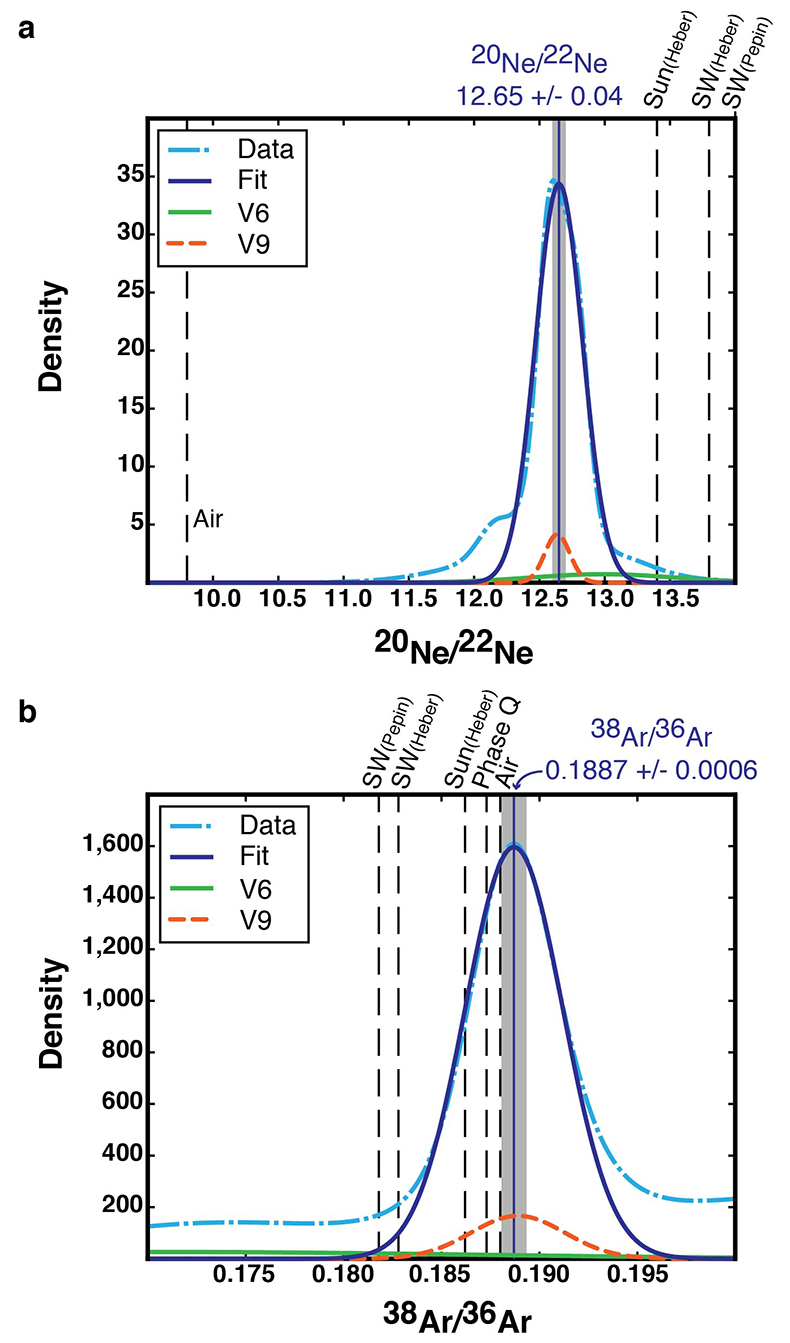
Figure 3 Gaussian curves obtained (a) for the 20Ne/22Ne ratio and (b) for the 38Ar/36Ar ratio. The light blue dotted curve is the cumulative curve obtained with the data (except V4B and V16B), the dark blue curve is the Gaussian fit. As an example, the orange dotted curve for vesicle V9 contributes strongly to the cumulative curve, whereas V6 (green curve) is poorly constrained. The mean isotopic ratios, from the statistical analysis, are represented with the blue lines and the corresponding uncertainties (σ/√n) with the shaded areas. Solar wind (SW) (Heber et al., 2009
Heber, V.S., Wieler, R., Baur, H., Olinger, C., Friedmann, A., Burnett, D.S. (2009) Noble gas composition of the solar wind as collected by the Genesis mission. Geochimica et Cosmochimica Acta 73, 7414-7432.
; Pepin et al., 2012Pepin, R.O., Schlutter, D.J., Becker, R.H., Reisenfeld, D.B. (2012) Helium, neon, and argon composition of the solar wind as recorded in gold and other Genesis collector materials. Geochimica et Cosmochimica Acta 89, 62–80.
), Sun (Heber et al., 2012Heber, V.S., Baur, H., Bochsler, P., McKeegan, K.D., Neugebauer, M., Reisenfeld, D.B., Wieler, R., Wiens, R.C. (2012) Isotopic Mass Fractionation of Solar Wind: Evidence from Fast and Slow Solar Wind Collected by the Genesis mission. The Astrophysical Journal 759, 121.
), Phase Q (Busemann et al., 2000Busemann, H., Baur, H., Wieler, R. (2000) Primordial noble gases in "phase Q" in carbonaceous and ordinary chondrites studied by closed-system stepped etching. Meteoritics and Planetary Science 35, 949–973.
).Back to article
Supplementary Figures and Tables
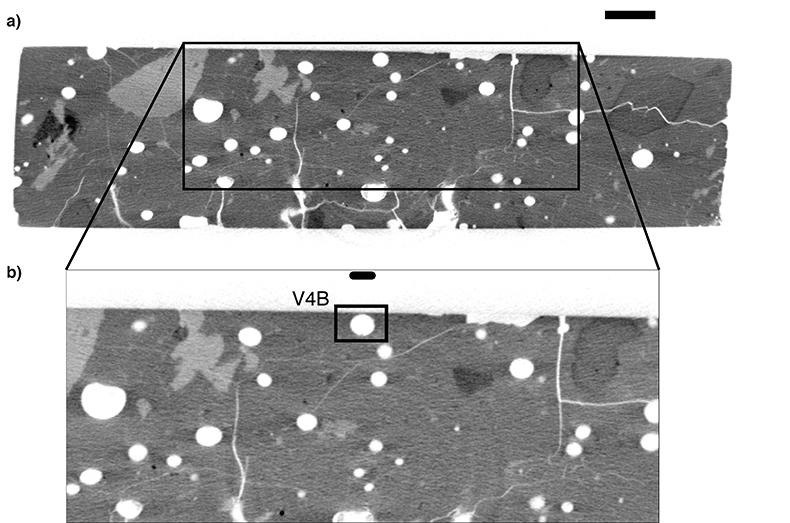
Figure S-1 X-ray microtomography image of the sample AHA-NEMO2-D22B (piece 1, Table S-1). (a) Example of one slice of the sample with the vesicle V4B at the middle top (the scale bar is 1,000 μm) and (b) is a zoom on this vesicle (black square) to show the location (the scale bar is 300 μm). On these images, vesicles are in white and the glass matrix is in grey as well as a few crystals. A network of cracks (in white) is clearly visible. Vesicle V4B is very close to the surface and is likely contaminated due to a small connection to air.
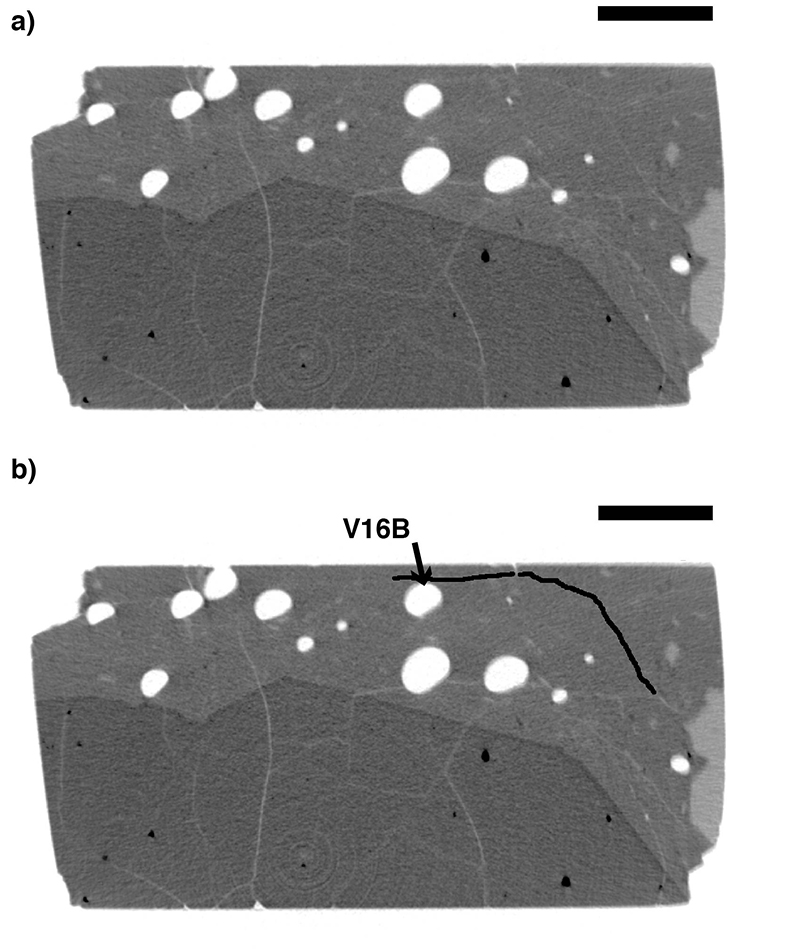
Figure S-2 X-ray microtomography image of the sample AHA-NEMO2-D22B (piece 2, Table S-1) to show the location of vesicle V16B. The original slice is represented in (a) and the very tiny crack just above the vesicle V16B is indicated by a black line in (b). To reach the vesicle, the laser also pierced the crack, which introduced air. The scale bars are 1,000 μm. (Refer also to the legend of Fig. S-1).
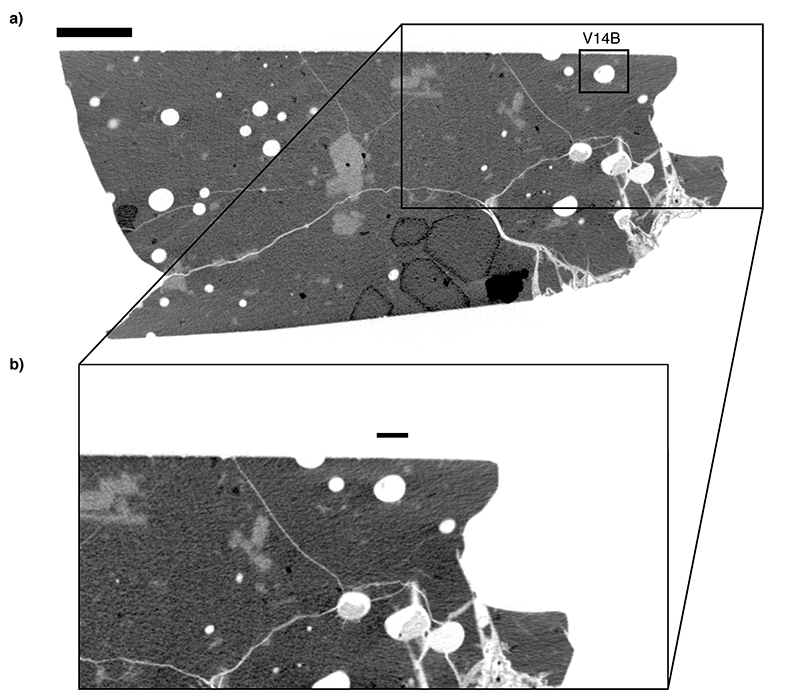
Figure S-3 X-ray microtomography image of the sample AHA-NEMO2-D22B (piece 3, Table S-1) to show the location of vesicle V14B. The original slice is represented in (a) and vesicle V14B is indicated with a black square (the scale bar is 1,000 μm), (b) is a zoom on this vesicle to show what surrounds it (the scale bar is 260 μm). (Refer also to the legend of Fig. S-1). Vesicle V14B has a low 20Ne/22Ne ratio (Table S-3) but no crack is visible on the images. This vesicle is unlikely to be contaminated because the 40Ar/36Ar ratio is 7155 ± 1546.
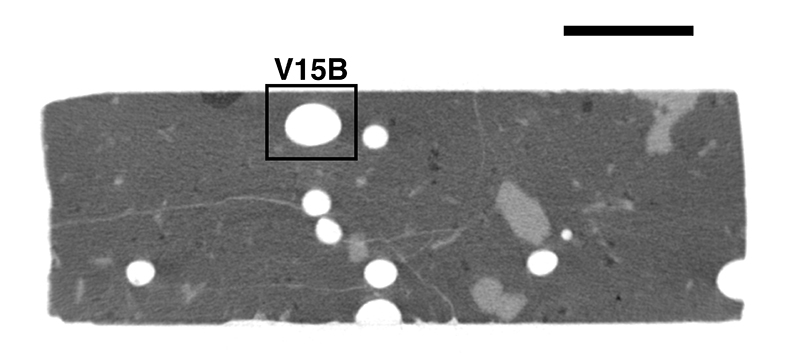
Figure S-4 X-ray microtomography image of the sample AHA-NEMO2-D22B (piece 2, Table S-1). This shows an example of a non-contaminated vesicle, vesicle V15B, which is the biggest vesicle analysed. The scale bar is 1,000 μm. (Refer also to the legend of Fig. S-1).
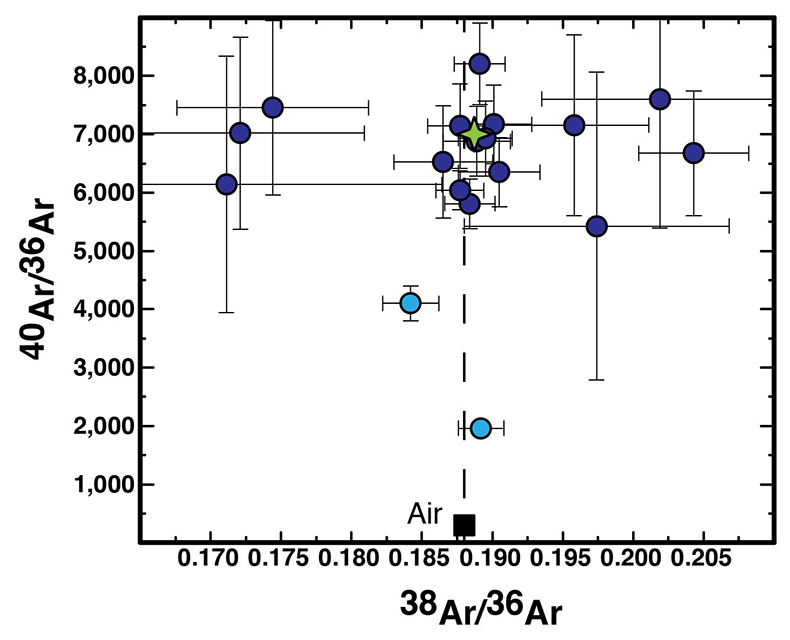
Figure S-5 40Ar/36Ar vs 38Ar/36Ar for the vesicles. The Fernandina (Galápagos) source composition is indicated with the green star. The two light blue circles correspond to the two contaminated vesicles (V4B and V16B). Vesicles V2A and V11B are not represented because their uncertainties are too large.
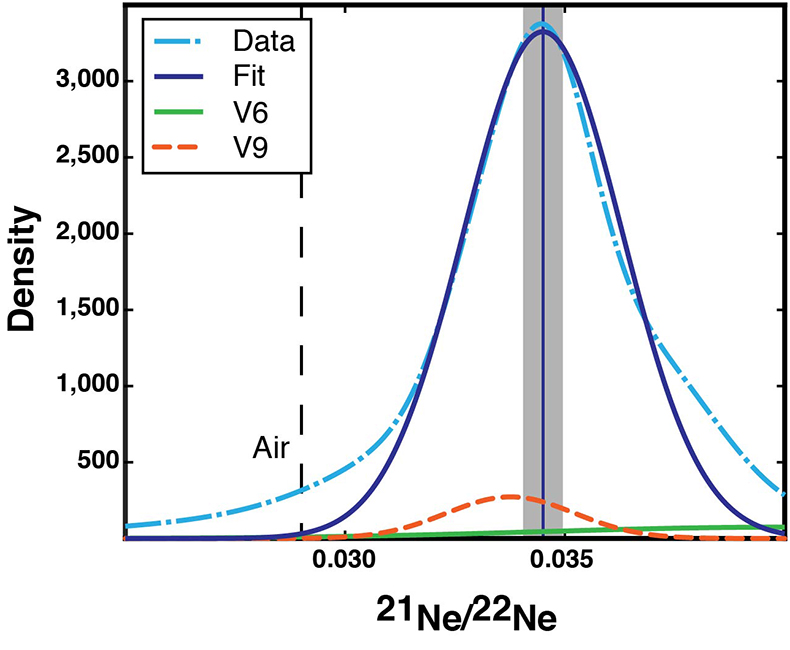
Figure S-6 Gaussian curves obtained for the 21Ne/22Ne ratio. The light blue dotted curve is the cumulative Gaussian curve taking into account all the vesicles (except V4B and V16B), the dark blue curve is the Gaussian fit. Examples of two Gaussian curves are indicated for some vesicles: vesicle V9 (orange dotted curve) has low uncertainties and contributes strongly to the global Gaussian curve, vesicle V6 (green curve) is poorly constrained and has nearly no influence on the global curve. The mean isotopic ratio (0.0345) determined with the statistical analysis is represented with the solid blue line. The shaded area corresponds to σ/√n = ±0.0004. For comparison, air composition is indicated.
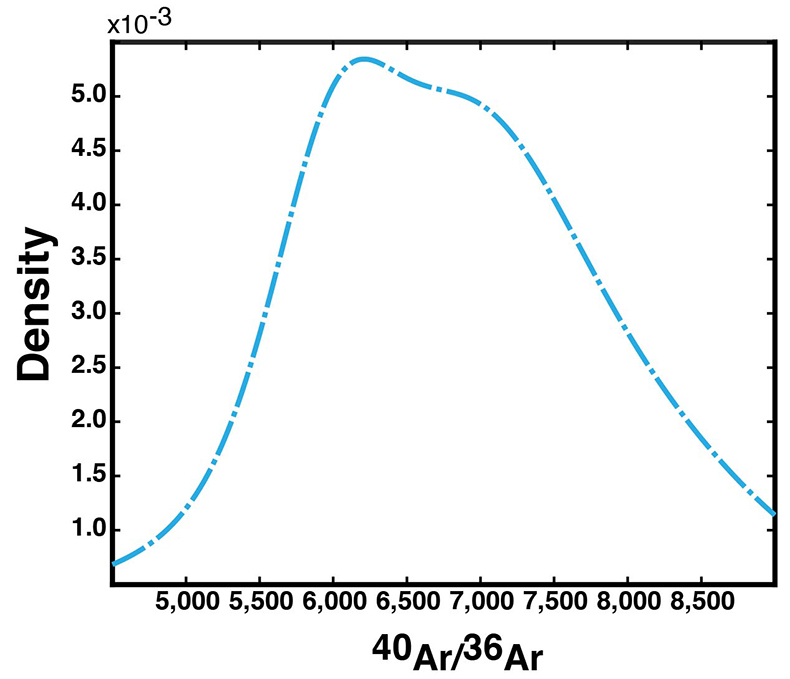
Figure S-7 Cumulative curve obtained for the 40Ar/36Ar ratio taking into account all the vesicles (except V4B and V16B). This curve cannot be correctly fitted with a Gaussian curve. The 40Ar/36Ar ratio is between 6000 and 7000 for the Fernandina source.
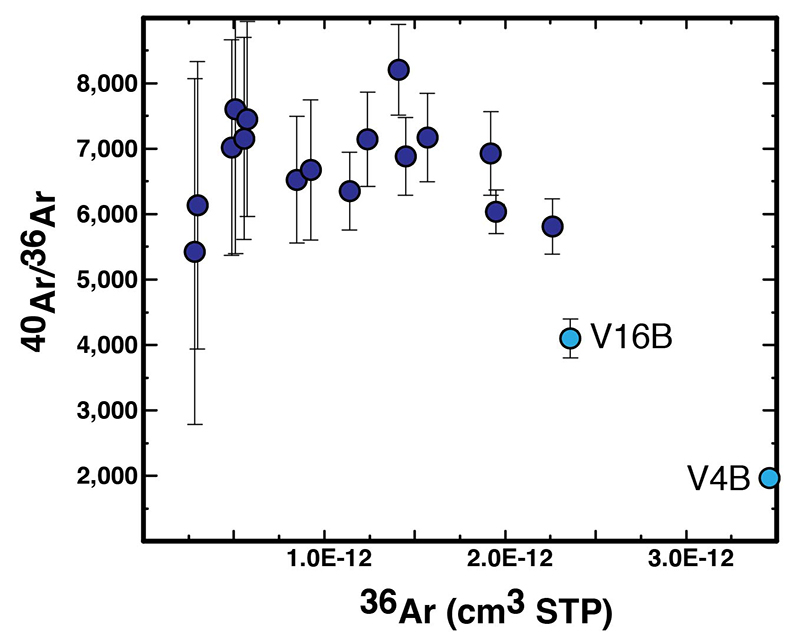
Figure S-8 40Ar/36Ar vs 36Ar (in cm3 STP) for the vesicles. The two contaminated vesicles (V4B and V16B) are in light blue. Except for these two bubbles, the 40Ar/36Ar ratio does not change with the 36Ar concentration, which indicates that the vesicles are not contaminated by air. Vesicles V2A and V11B are not represented because they have too large uncertainties.
Table S-1 Acquisition parameters for X-ray microtomography. The experiments were conducted at the Institute of Earth Sciences (Lausanne, Switzerland) on a Skyscan 1173 system. One piece of sample AHA-NEMO2-D22A has been studied and four for sample AHA-NEMO2-D22B. The piece number is indicated as well as the voltage (in kV), the current (in µA), the rotation step size (in degrees), the number of frames (which is the number of images taken for one position), the filter type used and the resolution (in µm per pixel). The resolution in µm3 per voxel (1 voxel = 1 x 1 x 1 pixel) is the cubic resolution in µm per pixel.
| Sample | # | Voltage | Current | Rotation step size | Number of frames | Filter | Pixel size |
| kV | µA | ° | µm | ||||
| AHA-NEMO2-D22A | 1 | 70 | 114 | 0.225 | 4 | Al 1.0 mm | 5.7 |
| AHA-NEMO2-D22B | 1 | 70 | 114 | 0.225 | 4 | Al 1.0 mm | 8.2 |
| AHA-NEMO2-D22B | 2 | 70 | 114 | 0.225 | 4 | Al 1.0 mm | 6.4 |
| AHA-NEMO2-D22B | 3 | 70 | 114 | 0.225 | 4 | Al 1.0 mm | 5.7 |
| AHA-NEMO2-D22B | 4 | 70 | 114 | 0.225 | 8 | Al 1.0 mm | 9.3 |
Table S-2 CO2 and noble gas (4He, 22Ne and 36Ar) abundances (in cm3 STP) for all the vesicles for samples AHA-NEMO2-D22A and AHA-NEMO2-D22B (Fernandina, Galápagos). The ablation time for each vesicle is indicated in brackets. The piece number (refer to Table S-1) and the depth of each vesicle below the sample surface are mentioned. The vesicle volumes were calculated with the 3D Object Counter plugin of ImageJ. The CO2 contents were determined using the pressure jump recorded on the manometer, calibrated with the air standard, and assuming that CO2 is the major gas (Moore et al., 1977). Errors are 1 sigma uncertainties.
| Sample | # | Depth | Volume | CO2 | ± | 4He | ± | 22Ne | ± | 36Ar | ± |
| µm | x106 µm3 | x10-4 cm3 | x10-8 cm3 | x10-13 cm3 | x10-13 cm3 | ||||||
| AHA-NEMO2-D22A vesicles | |||||||||||
| V1A (2’02”) | 1 | 100 | 15.6 | 10.3 | 1.00 | 2.06 | 0.09 | 3.74 | 0.29 | 9.25 | 0.38 |
| V2A (25”) | 1 | 48 | 11.6 | 7.45 | 0.72 | 1.48 | 0.09 | 2.70 | 0.27 | 1.72 | 0.38 |
| AHA-NEMO2-D22B vesicles | |||||||||||
| V1B (41”) | 1 | 15 | 34.3 | 22.1 | 2.10 | 4.34 | 0.08 | 8.35 | 0.26 | 22.6 | 0.38 |
| V2B (16”) | 1 | 20 | 10.5 | 6.48 | 0.64 | 1.29 | 0.08 | 1.90 | 0.26 | 5.09 | 0.36 |
| V3B (2’02”) | 1 | 110 | 29.6 | 18.9 | 1.80 | 3.75 | 0.08 | 6.10 | 0.26 | 15.7 | 0.37 |
| V4B (12”) | 1 | 22 | 16.3 | 10.2 | 1.00 | 1.96 | 0.08 | 4.51 | 0.26 | 34.6 | 0.42 |
| V5B (30”) | 1 | 60 | 4.1 | 2.64 | 0.31 | 0.51 | 0.08 | 0.99 | 0.26 | 2.84 | 0.36 |
| V6B (1’50”) | 2 | 50 | 4.8 | 3.04 | 0.34 | 0.60 | 0.09 | 1.01 | 0.26 | 3.00 | 0.37 |
| V7B (16”) | 4 | 90 | 32.5 | 19.6 | 1.90 | 3.82 | 0.09 | 6.95 | 0.33 | 19.5 | 0.45 |
| V8B (17”) | 4 | 110 | 19.1 | 12.6 | 1.20 | 2.44 | 0.09 | 3.91 | 0.28 | 11.4 | 0.40 |
| V9B (50”) | 3 | 155 | 26.7 | 16.9 | 1.60 | 3.36 | 0.09 | 6.40 | 0.32 | 14.5 | 0.42 |
| V10B (40”) | 3 | 195 | 14.8 | 9.48 | 0.91 | 1.89 | 0.09 | 3.44 | 0.28 | 8.49 | 0.39 |
| V11B (8”) | 4 | 18 | 1.0 | 1.41 | 0.22 | 0.29 | 0.09 | 0.50 | 0.26 | 1.08 | 0.37 |
| V12B (15”) | 4 | 100 | 9.4 | 5.97 | 0.59 | 1.18 | 0.09 | 2.67 | 0.27 | 4.88 | 0.38 |
| V13B (23”) | 3 | 130 | 11.5 | 7.31 | 0.71 | 1.45 | 0.09 | 2.72 | 0.27 | 5.74 | 0.38 |
| V14B (25”) | 3 | 155 | 11.4 | 6.87 | 0.67 | 1.32 | 0.09 | 2.48 | 0.27 | 5.57 | 0.38 |
| V15B (25”) | 2 | 90 | 35.9 | 22.7 | 2.10 | 4.44 | 0.09 | 7.38 | 0.34 | 19.2 | 0.41 |
| V16B (3’39”) | 2 | 145 | 25.7 | 15.8 | 1.50 | 3.13 | 0.09 | 6.49 | 0.33 | 23.6 | 0.42 |
| V17B (3’) | 1 | 220 | 26.0 | 15.4 | 1.50 | 3.03 | 0.09 | 5.59 | 0.33 | 12.4 | 0.39 |
| V18B (45”) | 2 | 100 | 31.2 | 19.5 | 1.80 | 3.86 | 0.09 | 6.61 | 0.36 | 14.1 | 0.39 |
Table S-3 Isotopic compositions of the vesicles for samples AHA-NEMO2-D22A and AHA-NEMO2-D22B (Fernandina, Galápagos). Ra is the air 3He/4He ratio and is equal to 1.384 x 10⁻⁶ (Clarke et al., 1976) . 40Ar* is radiogenic 40Ar. We consider a 40Ar/36Ar ratio of 298.6 for the air (Lee et al., 2006) to determine the 40Ar/36Ar and 4He/40Ar* ratios. n.d. means not determined when gases from the vesicle are indistinguishable from the matrix blank. Errors are 1 sigma uncertainties.
| Sample | CO2/3He | ± | 3He/4He | ± | 20Ne/22Ne | ± | 21Ne/22Ne | ± | 38Ar/36Ar | ± | 40Ar/36Ar | ± | 4He/40Ar* | ± |
| x109 | (xRa) | |||||||||||||
| AHA-NEMO2-D22A vesicles | ||||||||||||||
| V1A | 1.55 | 0.17 | 23.50 | 0.56 | 12.67 | 0.13 | 0.0373 | 0.0017 | 0.2043 | 0.0039 | 6674 | 1072 | 3.49 | 0.62 |
| V2A | 1.64 | 0.19 | 22.15 | 0.63 | 12.66 | 0.19 | 0.0373 | 0.0014 | 0.1967 | 0.0145 | n.d. | n.d. | 3.53 | 2.52 |
| AHA-NEMO2-D22B vesicles | ||||||||||||||
| V1B | 1.62 | 0.16 | 22.74 | 0.49 | 12.54 | 0.07 | 0.0350 | 0.0009 | 0.1884 | 0.0018 | 5809 | 425 | 3.48 | 0.28 |
| V2B | 1.61 | 0.19 | 22.60 | 0.56 | 13.07 | 0.27 | 0.0353 | 0.0026 | 0.2019 | 0.0084 | 7601 | 2208 | 3.47 | 1.10 |
| V3B | 1.56 | 0.16 | 23.28 | 0.52 | 12.83 | 0.09 | 0.0330 | 0.0010 | 0.1901 | 0.0027 | 7171 | 674 | 3.47 | 0.36 |
| V4B | 1.66 | 0.18 | 22.61 | 0.62 | 11.92 | 0.11 | 0.0347 | 0.0015 | 0.1892 | 0.0016 | 1962 | 59 | 3.41 | 0.19 |
| V5B | 1.63 | 0.34 | 22.97 | 0.76 | 12.33 | 0.36 | 0.0323 | 0.0045 | 0.1974 | 0.0094 | 5426 | 2641 | 3.50 | 1.95 |
| V6B | 1.69 | 0.31 | 21.58 | 0.46 | 12.99 | 0.55 | 0.0399 | 0.0054 | 0.1711 | 0.0153 | 6138 | 2197 | 3.43 | 1.44 |
| V7B | 1.62 | 0.16 | 22.92 | 0.43 | 12.73 | 0.09 | 0.0335 | 0.0011 | 0.1877 | 0.0017 | 6038 | 332 | 3.42 | 0.23 |
| V8B | 1.62 | 0.17 | 23.16 | 0.47 | 12.64 | 0.13 | 0.0352 | 0.0017 | 0.1905 | 0.0029 | 6350 | 593 | 3.52 | 0.39 |
| V9B | 1.58 | 0.16 | 23.07 | 0.46 | 12.64 | 0.10 | 0.0338 | 0.0015 | 0.1889 | 0.0024 | 6880 | 597 | 3.51 | 0.35 |
| V10B | 1.53 | 0.17 | 23.65 | 0.58 | 12.55 | 0.11 | 0.0314 | 0.0023 | 0.1865 | 0.0035 | 6525 | 966 | 3.57 | 0.60 |
| V11B | 1.64 | 0.56 | 21.79 | 1.24 | 12.00 | 0.44 | 0.0297 | 0.0051 | n.d. | n.d. | n.d. | n.d. | n.d. | n.d. |
| V12B | 1.54 | 0.19 | 23.59 | 0.54 | 12.52 | 0.17 | 0.0360 | 0.0020 | 0.1721 | 0.0088 | 7019 | 1646 | 3.61 | 0.96 |
| V13B | 1.61 | 0.19 | 22.57 | 0.66 | 12.59 | 0.12 | 0.0350 | 0.0017 | 0.1744 | 0.0068 | 7453 | 1490 | 3.53 | 0.80 |
| V14B | 1.68 | 0.20 | 22.46 | 0.58 | 12.17 | 0.13 | 0.0323 | 0.0020 | 0.1958 | 0.0053 | 7155 | 1546 | 3.45 | 0.84 |
| V15B | 1.60 | 0.16 | 23.11 | 0.45 | 12.74 | 0.09 | 0.0346 | 0.0010 | 0.1895 | 0.0019 | 6927 | 642 | 3.48 | 0.35 |
| V16B | 1.57 | 0.16 | 23.36 | 0.46 | 12.34 | 0.09 | 0.0330 | 0.0015 | 0.1842 | 0.0020 | 4101 | 300 | 3.49 | 0.30 |
| V17B | 1.64 | 0.17 | 22.47 | 0.51 | 12.58 | 0.07 | 0.0345 | 0.0009 | 0.1877 | 0.0023 | 7142 | 723 | 3.56 | 0.41 |
| V18B | 1.59 | 0.16 | 22.85 | 0.56 | 12.81 | 0.07 | 0.0345 | 0.0011 | 0.1891 | 0.0018 | 8206 | 695 | 3.47 | 0.33 |
Table S-4 Noble gas abundances of the matrix blanks (in cm3 STP) for samples AHA-NEMO2-D22A and AHA-NEMO2-D22B (Fernandina, Galápagos). The ablation times are indicated in brackets. Errors are 1 sigma uncertainties.
| Sample | 4He | ± | 22Ne | ± | 36Ar | ± |
| x10-10 cm3 | x10-13 cm3 | x10-12 cm3 | ||||
| AHA-NEMO2-D22A matrix | ||||||
| Blank 1 (2’02”) | 3.98 | 0.28 | 1.01 | 0.23 | 1.55 | 0.03 |
| Blank 2 (25”) | 3.59 | 0.28 | 0.91 | 0.23 | 1.17 | 0.03 |
| AHA-NEMO2-D22B matrix | ||||||
| Blank 1 (41”) | 3.69 | 0.28 | 1.29 | 0.23 | 1.74 | 0.03 |
| Blank 2 (16”) | 3.83 | 0.28 | 1.50 | 0.23 | 1.54 | 0.03 |
| Blank 3 (2’01”) | 3.78 | 0.28 | 1.15 | 0.23 | 1.18 | 0.03 |
| Blank 4 (15”) | 3.83 | 0.28 | 1.07 | 0.23 | 1.46 | 0.03 |
| Blank 5 (2’) | 3.69 | 0.28 | 1.33 | 0.23 | 1.13 | 0.03 |
| Blank 6 (4’30”) | 3.90 | 0.28 | 0.76 | 0.23 | 1.12 | 0.03 |
| Blank 7 (50”) | 3.92 | 0.28 | 0.79 | 0.23 | 1.32 | 0.03 |
| Blank 8 (16”) | 4.00 | 0.28 | 0.84 | 0.23 | 1.20 | 0.03 |
| Blank 9 (25”) | 4.37 | 0.28 | 0.79 | 0.23 | 1.25 | 0.03 |
| Blank 10 (27”) | 3.71 | 0.28 | 0.91 | 0.23 | 1.86 | 0.03 |
| Blank 11 (3’) | 3.56 | 0.28 | 1.75 | 0.24 | 1.98 | 0.03 |
| Blank 12 (3’) | 3.85 | 0.28 | 0.63 | 0.23 | 1.31 | 0.03 |
| Blank 13 (45”) | 3.86 | 0.28 | 0.74 | 0.23 | 1.24 | 0.03 |
Table S-5 Isotopic compositions of the matrix blanks for samples AHA-NEMO2-D22A and AHA-NEMO2-D22B (Fernandina, Galápagos). Errors are 1 sigma uncertainties.
| Sample | 3He/4He | ± | 20Ne/22Ne | ± | 21Ne/22Ne | ± | 38Ar/36Ar | ± | 40Ar/36Ar | ± |
| (xRa) | ||||||||||
| AHA-NEMO2-D22A matrix | ||||||||||
| Blank 1 (2’02”) | 1.9 | 0.6 | 10.40 | 0.16 | 0.0278 | 0.0022 | 0.1901 | 0.0011 | 297 | 2 |
| Blank 2 (25”) | 1.8 | 0.6 | 10.13 | 0.17 | 0.0297 | 0.0024 | 0.1933 | 0.0014 | 296 | 2 |
| AHA-NEMO2-D22B matrix | ||||||||||
| Blank 1 (41”) | 1.5 | 0.5 | 10.26 | 0.09 | 0.0247 | 0.0021 | 0.1886 | 0.0016 | 299 | 2 |
| Blank 2 (16”) | 1.0 | 0.5 | 10.00 | 0.09 | 0.0322 | 0.0020 | 0.1839 | 0.0020 | 296 | 3 |
| Blank 3 (2’01”) | 1.1 | 0.7 | 10.18 | 0.18 | 0.0285 | 0.0033 | 0.1954 | 0.0018 | 296 | 3 |
| Blank 4 (15”) | 6.5 | 0.8 | 10.07 | 0.16 | 0.0312 | 0.0018 | 0.1913 | 0.0014 | 291 | 3 |
| Blank 5 (2’) | 1.8 | 0.4 | 10.23 | 0.22 | 0.0293 | 0.0019 | 0.2027 | 0.0014 | 309 | 2 |
| Blank 6 (4’30”) | 2.2 | 0.8 | 9.99 | 0.17 | 0.0304 | 0.0026 | 0.2001 | 0.0018 | 301 | 2 |
| Blank 7 (50”) | 15.5 | 15.0 | 10.42 | 0.11 | 0.0350 | 0.0027 | 0.1964 | 0.0015 | 290 | 2 |
| Blank 8 (16”) | 2.3 | 5.2 | 10.26 | 0.11 | 0.0305 | 0.0014 | 0.2000 | 0.0014 | 303 | 2 |
| Blank 9 (25”) | 1.1 | 0.7 | 10.24 | 0.15 | 0.0301 | 0.0038 | 0.1889 | 0.0017 | 293 | 2 |
| Blank 10 (27”) | 2.6 | 0.6 | 10.46 | 0.12 | 0.0304 | 0.0028 | 0.1922 | 0.0011 | 300 | 1 |
| Blank 11 (3’) | 2.6 | 0.9 | 10.02 | 0.16 | 0.0308 | 0.0021 | 0.2039 | 0.0013 | 312 | 2 |
| Blank 12 (3’) | 1.0 | 0.6 | 10.26 | 0.21 | 0.0351 | 0.0021 | 0.1989 | 0.0011 | 303 | 2 |
| Blank 13 (45”) | 1.8 | 0.6 | 10.56 | 0.20 | 0.0299 | 0.0020 | 0.1912 | 0.0010 | 301 | 2 |


