Climate driven carbon and microbial signatures through the last ice age
Affiliations | Corresponding Author | Cite as | Funding information- Share this article


Article views:7,020Cumulative count of HTML views and PDF downloads.
- Download Citation
- Rights & Permissions
Abstract
Figures and Tables
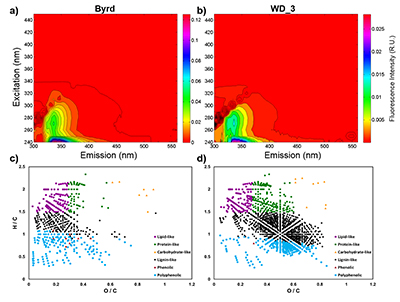 Figure 1 Organic matter (OM) characterisation of Byrd and WAIS Divide deviation #3 (WD_3) Antarctic ice cores by (a-b) fluorescence spectroscopy and (c-d) Fourier transform ion cyclotron resonance mass spectrometry van Krevelen diagrams. | 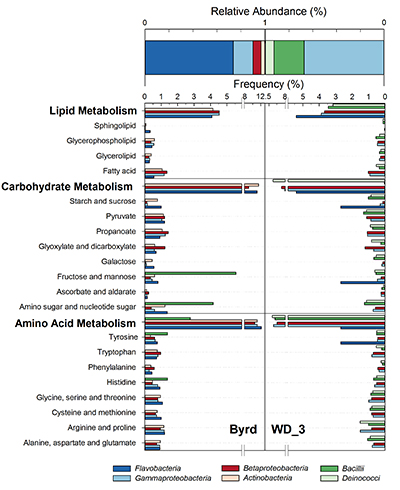 Figure 2 Top: Relative abundance of 16S rRNA gene sequences representing the distribution of microbial assemblages within the Byrd and WAIS Divide deviation #3 (WD_3) ice core sections. Bottom: Comparisons of predicted genes involved in lipid, carbohydrate, and amino acid pathways for the dominant bacterial classes. | 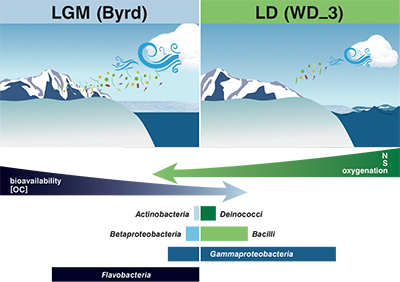 Figure 3 Schematic depicting Antarctic palaeoecological markers of organic carbon (OC) and microbial community structure from the Last Glacial Maximum (LGM) and last deglaciation (LD). |
| Figure 1 | Figure 2 | Figure 3 |
Supplementary Figures and Tables
 Table S-1 Volatile organic compounds, diesel range organics, and total extractable hydrocarbon concentrations for the inner ice core of Byrd and WAIS Divide deviation #3 (WD_3), and the outer shavings removed during decontamination procedures of the WD_3 ice core. Environmental Protection Agency (EPA) detection methods were used for contaminant analyses. |  Table S-2 Antarctic ice core location, approximate ages, climate descriptions and concentrations of organic carbon (OC), bacteria, Cl-, NO3-, PO43-, and SO42- (± 1 SD) for Byrd Research Station and the WAIS Divide deviation #3 (WD_3) ice core samples of the Last Glacial Maximum (LGM) and the last deglaciation (LD) climate periods. |  Table S-3 Molecular composition of CcHhNnOoSs containing organic matter from Byrd Research Station and WAIS Divide deviation #3 (WD_3) ice core sections determined by negative ion electrospray ionisation 9.4 tesla Fourier transform ion cyclotron resonance mass spectrometry. |
| Table S-1 | Table S-2 | Table S-3 |
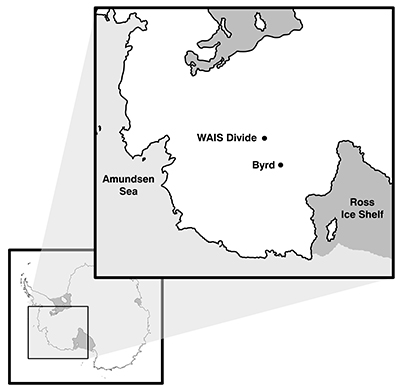 Figure S-1 Geographical location of the Byrd and WAIS Divide drilling sites. | 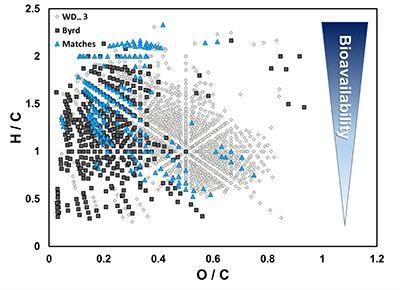 Figure S-2 H/C and O/C molecular formulae of organic matter (OM) characterised in the WAIS Divide deviation #3 (WD_3) and Byrd Antarctic ice core OM sections, highlighting the degree of overlap, and exact composition matches between both samples on a van Krevelen diagram. Chemically labile OM (easily altered) is shown as a function of hydrogen saturation. | 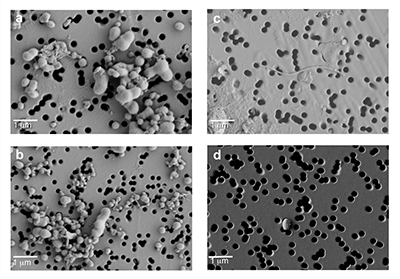 Figure S-3 Field emission scanning electron microscopy (FESEM) images from (a-b) WAIS Divide deviation #3 (WD_3) and (c-d) Byrd Antarctic ice core sections. Scale bar is 1 µm. |
| Figure S-1 | Figure S-2 | Figure S-3 |
top
Introduction
In reconstructing palaeoclimatic conditions, entrapped gases, dissolved chemicals, and dust have served as millennial-scale climate proxies in ice cores (Mahowald et al., 1999
Mahowald, N., Kohfeld, K., Hansson, M., Balkanski, Y., Harrison, S.P., Prentice, I.C., Schulz, M., Rodhe, H. (1999) Dust sources and deposition during the last glacial maximum and current climate: A comparison of model results with paleodata from ice cores and marine sediments. Journal of Geophysical Research-Atmospheres 104, 15895–15916.
; Petit et al., 1999Petit, J.R., Jouzel, J., Raynaud, D., Barkov, N.I., Barnola, J.M., Basile, I., Bender, M., Chappellaz, J., Davis, M., Delaygue, G., Delmotte, M., Kotlyakov, V.M., Legrand, M., Lipenkov, V.Y., Lorius, C., Pepin, L., Ritz, C., Saltzman, E., Stievand, M. (1999) Climate and atmospheric history of the past 420,000 years from the Vostok ice core, Antarctica. Nature 399, 429–436.
). More recently, the integration of biology into palaeoclimate research is gaining recognition, with distinct microbial assemblages and fluorescent organic matter (OM) signatures in ice indicative of depositional events related to climate (Miteva et al., 2009Miteva, V., Teacher, C., Sowers, T., Brenchley, J. (2009) Comparison of the microbial diversity at different depths of the GISP2 Greenland ice core in relationship to deposition climates. Environmental Microbiology 11, 640–656.
, 2015Miteva, V., Rinehold, K., Sowers, T., Sebastian, A., Brenchley, J. (2015) Abundance, viability and diversity of the indigenous microbial populations at different depths of the NEEM Greenland ice core. Polar Research 34, 25057.
; D'Andrilli et al., 2017D'Andrilli, J., Foreman, C.M., Sigl, M., Priscu, J.C., McConnell, J.R. (2017) A 21,000 year record of fluorescent organic matter markers in the WAIS Divide ice core. Climate of the Past 13, 533–544.
). We hypothesise that OM composition is conserved across climate periods, providing a chronological record in ice, similar to trapped gases and inorganic compounds.Here we present OM molecular composition and microbial community structure within two sections from the Byrd Station (Byrd) and West Antarctic Ice Sheet (WAIS) Divide deviation #3 (WD_3) ice core sections (Fig. S-1) from the Last Glacial Maximum (LGM) and last deglaciation (LD) periods. Collecting ice cores for biological analyses is challenging due to significant contamination risks from drilling, retrieval, and processing. Rightfully, focus has been placed on developing rigorous decontamination protocols (Christner et al., 2005
Christner, B.C., Mikucki, J.A., Foreman, C.M., Denson, J., Priscu, J.C. (2005) Glacial ice cores: A model system for developing extraterrestrial decontamination protocols. Icarus 174, 572–584.
; Miteva et al., 2014Miteva, V., Burlingame, C., Sowers, T., Brenchley, J. (2014) Comparative evaluation of the indigenous microbial diversity vs. drilling fluid contaminants in the NEEM Greenland ice core. FEMS Microbiology Ecology 89, 238–256.
), essential for producing credible results. Therefore, stringent next generation sequencing protocols and Fourier transform ion cyclotron resonance mass spectrometry (FT-ICR MS) were applied in concert with bulk characterisation metrics (see Supplementary Information) to link deep ice core microbial assemblages and OM molecular composition to different climate periods.top
Results
The ice core sections, Byrd and WD_3, correspond to approximately 20.5 ka BP (before present 1950) (Pedro et al., 2012
Pedro, J.B., Rasmussen, S.O., van Ommen, T.D. (2012) Tightened constraints on the time-lag between Antarctic temperature and CO2 during the last deglaciation. Climate of the Past 8, 1213–1221.
) and 14.5 ka BP (WAIS Divide Project Members, 2013WAIS Divide Project Members (2013) Onset of deglacial warming in West Antarctica driven by local orbital forcing. Nature 500, 440–444.
), respectively. Decontamination removed hydrocarbon-based drilling fluid constituents, with diesel range organic concentrations below detection in both samples (Table S-1). The organic carbon (OC) concentration in the Byrd sample was 445 µM, ~38 times higher than the younger WD_3 (11.8 µM; Table S-2). Concentrations of Cl-, NO3-, and SO42- were approximately two times higher in Byrd compared to anion concentrations in WD_3 (Table S-2). Phosphate (PO43-) concentrations were 2.77 µM for Byrd and below detection limit in WD_3. Both Byrd and WD_3 OM exhibited fluorescence in nearly identical regions of the excitation emission matrices; however, intensities differed by an order of magnitude (EEMs; Fig. 1a-b). Fluorescing OM was situated at low excitation and emission wavelengths (Ex: 240–300 nm and Em: 300–400 nm) with maxima in regions characteristic of tryptophan-like chemical species (Coble et al., 1990Coble, P.G., Green, S.A., Blough, N.V., Gagosian, R.B. (1990) Characterization of dissolved organic-matter in the Black-Sea by fluorescence spectroscopy. Nature 348, 432–435.
).OM composition was comprised of CcHhOo (63.1 % and 74.4 %) and CcHhOoS1 (22.6 % and 19.3 %) chemical species for Byrd and WD_3, respectively. Other molecular combinations containing N and/or S comprised <15 % for both samples (Table S-3). Only 12.2 % of the molecular formulae identified in both ice cores were compositional matches (Fig. S-2). Byrd OM showed a wide range of hydrogen saturation (H/C: 0.3–2.4) at lower oxygenation, indicative of reduced OM species (Fig. 1c). Conversely, more oxygenated molecular species were observed for WD_3 OM, characteristic of lignin-like, protein-like, and polyphenolic compounds (Fig. 1d). Overall, Byrd OM exhibited more labile molecular formulae (D'Andrilli et al., 2015
D'Andrilli, J., Cooper, W.T., Foreman, C.M., Marshall, A.G. (2015) An ultrahigh-resolution mass spectrometry index to estimate natural organic matter lability. Rapid Communications in Mass Spectrometry 29, 2385–2401.
) compared to WD_3 OM (33.1 % versus 21.3 %).
Figure 1 Organic matter (OM) characterisation of Byrd and WAIS Divide deviation #3 (WD_3) Antarctic ice cores by (a-b) fluorescence spectroscopy and (c-d) Fourier transform ion cyclotron resonance mass spectrometry van Krevelen diagrams.
Microscopic analysis identified bacterial cells in both cores, with filamentous cells only found in Byrd (Fig. S-3). Bacterial cell concentrations ranged 1.92 x 10⁵ ± 1.23 x 10⁴ cells mL-1 for Byrd and 1.28 x 10⁴ ± 2.48 x 10³ cells mL-1 for WD_3. Bacterial cell abundances in the outer ice core layers removed during decontamination were two orders of magnitude greater.
Examination of 16S RNA gene amplicons, post quality control and blank subtraction, produced 220,899 and 5,991 high quality bacterial sequences, clustering into 66 and 22 operational taxonomic units (OTUs) for Byrd and WD_3. Overall, microbial assemblages differed significantly (Libshuff; P < 0.001) between cores, with only two shared OTUs. Taxonomic analysis at the class level (Fig. 2) showed that the Byrd microbial assemblage was dominated by Flavobacteria (74 %) and Gammaproteobacteria (16 %), while Gammaproteobacteria (67 %) and Bacilli (25 %) prevailed in WD_3. The dominant microbial phylotypes from the two cores were phylogenetically similar to taxa found in modern icy environments. OTUs 1 and 5, accounting for 65 % and 7 % of the Byrd assemblage, had ≥97 % 16S rRNA gene sequence identity to Antarctic strains Flavobacterium micromati and Rhodoferax antarcticus (Madigan et al., 2000
Madigan, M.T., Jung, D.O., Woese, C.R., Achenbach, L.A. (2000) Rhodoferax antarcticus sp. nov., a moderately psychrophilic purple nonsulfur bacterium isolated from an Antarctic microbial mat. Archives of Microbiology 173, 449–449.
; Van Trappen et al., 2004Van Trappen, S., Vandecandelaere, I., Mergaert, J., Swings, J. (2004) Flavobacterium degerlachei sp nov., F. frigoris sp nov and F. micromati sp nov., novel psychrophilic bacteria isolated from microbial mats in Antarctic lakes. International Journal of Systematic and Evolutionary Microbiology 54, 85–92.
). OTUs 8 and 12 encompassed 32 % and 4 % of the WD_3 library, with 96 % and 97 % sequence identity to Pseudomonas proteolytica from Antarctic ponds (Reddy et al., 2004Reddy, G.S.N., Matsumoto, G.I., Schumann, P., Stackebrandt, E., Shivaji, S. (2004) Psychrophilic pseudomonads from Antarctica: Pseudomonas antarctica sp nov., P. meridiana sp nov and P. proteolytica sp nov. International Journal of Systematic and Evolutionary Microbiology 54, 713–719.
). An unclassified Actinobacter from Arctic sea ice (99 % sequence match, Brinkmeyer et al., 2003Brinkmeyer, R., Knittel, K., Jurgens, J., Weyland, H., Amann, R., Helmke, E. (2003) Diversity and structure of bacterial communities in arctic versus antarctic pack ice. Applied and Environmental Microbiology 69, 6610–6619.
), made up 9 % and 32 % of the Byrd and WD_3 microbial assemblages. Cumulatively, these abundant, yet low numbers of OTUs described 81 % and 67 % of the microbial assemblages within Byrd and WD_3. Chao diversity was 43.5 (26.2–117.8; 95 % CI) and 156.3 (105.4–273.1; 95 % CI) for WD_3 and Byrd; ~two times greater than the observed number of OTUs. The Inverse Simpson estimated low biodiversity across both samples (Byrd: 2.2–2.2; WD_3: 3.9–4.0; 95 % CI) when compared to other deep ice core communities (Miteva et al., 2015Miteva, V., Rinehold, K., Sowers, T., Sebastian, A., Brenchley, J. (2015) Abundance, viability and diversity of the indigenous microbial populations at different depths of the NEEM Greenland ice core. Polar Research 34, 25057.
).Using 16S marker gene datasets, 57 % (Byrd) and 51 % (WD_3) of in silico predicted genes were attributed to metabolism. Of the 64 generally assigned functional classes, 58 of the predicted functions differed significantly between the two microbial assemblages (P < 0.012). Of relevance were carbohydrate (Byrd: 10.1 %, WD_3: 10.0 %), lipid (Byrd: 3.7%, WD_3: 3.5 %), and amino acid (Byrd: 9.8 %, WD_3: 9.7 %; Fig. 2) metabolism.

Figure 2 Top: Relative abundance of 16S rRNA gene sequences representing the distribution of microbial assemblages within the Byrd and WAIS Divide deviation #3 (WD_3) ice core sections. Bottom: Comparisons of predicted genes involved in lipid, carbohydrate, and amino acid pathways for the dominant bacterial classes.
top
Discussion
Studies proposing OM as climate proxies have come from aquatic sedimentary records (e.g., Meyers, 1994
Meyers, P.A. (1994) Preservation of elemental and isotopic source identification of sedimentary organic-matter. Chemical Geology 114, 289–302.
; Pailler and Bard, 2002Pailler, D., Bard, E. (2002) High frequency palaeoceanographic changes during the past 140,000yr recorded by the organic matter in sediments of the Iberian Margin. Palaeogeography Palaeoclimatology Palaeoecology 181, 431–452.
; Cartapanis et al., 2016Cartapanis, O., Bianchi, D., Jaccard, S.L., Galbraith, E.D. (2016) Global pulses of organic carbon burial in deep-sea sediments during glacial maxima. Nature Communications 7.
). Fundamental differences exist, however, between sedimentation processes and aeolian deposition in these environments. Varying amounts of dust in ice attest to both hydro- and lithospheric changes on the continents and long distance transport (Palais and Legrand, 1985Palais, J.M., Legrand, M. (1985) Soluble Impurities in the Byrd Station Ice Core, Antarctica-Their Origin and Sources. Journal of Geophysical Research-Oceans 90, 1143–1154.
; Mahowald et al., 1999Mahowald, N., Kohfeld, K., Hansson, M., Balkanski, Y., Harrison, S.P., Prentice, I.C., Schulz, M., Rodhe, H. (1999) Dust sources and deposition during the last glacial maximum and current climate: A comparison of model results with paleodata from ice cores and marine sediments. Journal of Geophysical Research-Atmospheres 104, 15895–15916.
; Petit et al., 1999Petit, J.R., Jouzel, J., Raynaud, D., Barkov, N.I., Barnola, J.M., Basile, I., Bender, M., Chappellaz, J., Davis, M., Delaygue, G., Delmotte, M., Kotlyakov, V.M., Legrand, M., Lipenkov, V.Y., Lorius, C., Pepin, L., Ritz, C., Saltzman, E., Stievand, M. (1999) Climate and atmospheric history of the past 420,000 years from the Vostok ice core, Antarctica. Nature 399, 429–436.
; Sigl et al., 2016Sigl, M., Fudge, T.J., Winstrup, M., Cole-Dai, J., Ferris, D., McConnell, J.R., Taylor, K.C., Welten, K.C., Woodruff, T.E., Adolphi, F., Bisiaux, M., Brook, E.J., Buizert, C., Caffee, M.W., Dunbar, N.W., Edwards, R., Geng, L., Iverson, N., Koffman, B., Layman, L., Maselli, O.J., McGwire, K., Muscheler, R., Nishiizumi, K., Pasteris, D.R., Phodes, R.H., Sowers, T.A. (2016) The WAIS Divide deep ice core WD2014 chronology–Part 2: Annual-layer counting (0–31 ka BP). Climate of the Past 12, 769–786.
). Ion loads in Byrd and WD_3 corroborate these reports, with OM quantity and quality assessments, alongside traditional climate indicators, proving suitable as palaeoecological markers.Although the limited data impose constraints on broader generalisations, the concentration, fluorescence intensity, and molecular composition of OM stored in the examined cores varied on glacial-interglacial timescales (Fig. 3). Fluorescent OM chemical species and intensities were consistent with a larger dataset of LGM and LD comparisons (D'Andrilli et al., 2017
D'Andrilli, J., Foreman, C.M., Sigl, M., Priscu, J.C., McConnell, J.R. (2017) A 21,000 year record of fluorescent organic matter markers in the WAIS Divide ice core. Climate of the Past 13, 533–544.
). Byrd OM consisted of reduced chemical species of less degraded carbon character, indicative of greater bioavailability. Correlations between less degraded OM fractions (i.e. amino sugars, amino acids, and non-humic-like chemical species) and aridity have previously been reported (Scott et al., 1998Scott, M.J., Jones, M.N., Woof, C., Tipping, E. (1998) Concentrations and fluxes of dissolved organic carbon in drainage water from an upland peat system. Environment International 24, 537–546.
), agreeing with our interpretation of the OM molecular characteristics (higher chemical lability) found in the drier climate of the LGM. Conversely, OM in WD_3 was representative of more lignin-like species (Fig. 3). Although other compounds (carboxyl-rich alicyclic molecules and material derived from linear terpenoids) can occupy the lignin-like region on the van Krevelen diagram, the presence of more lignin-like species may reflect vegetation shifts between glacial-interglacial periods (Lamy et al., 1999Lamy, F., Hebbeln, D., Wefer, G. (1999) High-resolution marine record of climatic change in mid-latitude Chile during the last 28,000 years based on terrigenous sediment parameters. Quaternary Research 51, 83–93.
).
Figure 3 Schematic depicting Antarctic palaeoecological markers of organic carbon (OC) and microbial community structure from the Last Glacial Maximum (LGM) and last deglaciation (LD).
While we argue that transport and deposition patterns of biotic and abiotic material onto the ice sheet is the result of climate induced changes at the source, there is evidence for post-depositional OM processing in near surface environments (Antony et al., 2017
Antony, R., Willoughby, A.S., Grannas, A.M., Catanzano, V., Sleighter, R.L., Thamban, M., Hatcher, P.G., Nair, S. (2017) Molecular insights on dissolved organic matter transformation by supraglacial microbial communities. Environmental Science & Technology 51, 4328–4337.
). Further, the chemical composition of OM is believed to drive microbial community structure and underlying metabolic strategies (McCarren et al., 2010McCarren, J., Becker, J.W., Repeta, D.J., Shi, Y.M., Young, C.R., Malmstrom, R.R., Chisholm, S.W., DeLong, E.F. (2010) Microbial community transcriptomes reveal microbes and metabolic pathways associated with dissolved organic matter turnover in the sea. Proceedings of the National Academy of Sciences of the United States of America 107, 16420–16427.
; Landa et al., 2016Landa, M., Blain, S., Christaki, U., Monchy, S., Obernosterer, I. (2016) Shifts in bacterial community composition associated with increased carbon cycling in a mosaic of phytoplankton blooms. Isme Journal 10, 39–50.
). Flavobacteria, for instance, are largely involved in the degradation of amino acid-like OM (Kirchman 2002Kirchman, D.L. (2002) The ecology of Cytophaga–Flavobacteria in aquatic environments. FEMS Microbiology Ecology 39, 91–100.
). Predicted lipid, carbohydrate, and amino acid pathways identified in Flavobacteria and Actinobacteria suggest genetic evidence for the utilisation of more bioavailable OM and its degradation products; traits which were significantly less (P < 0.022) prominent in Bacillii and Deinococci (Fig. 2). Hence, variations in OM composition between Byrd and WD_3 (Fig. 1c-d and Fig. S-2) could favour microbial communities based on their metabolic capabilities; a concept of community evolution supported by recent findings on microorganisms in Antarctic snow (Antony et al., 2016Antony, R., Sanyal, A., Kapse, N., Dhakephalkar, P.K., Thamban, M., Nair, S. (2016) Microbial communities associated with Antarctic snow pack and their biogeochemical implications. Microbiological Research 192, 192–202.
). Although metabolic functions can be inferred from 16S RNA gene datasets (Bowman and Ducklow, 2015Bowman, J.S., Ducklow, H.W. (2015) Microbial communities can be described by metabolic structure: A general framework and application to a seasonally variable, depth-stratified microbial community from the coastal west Antarctic Peninsula. PLoS One 10, e0135868.
), obvious limitations exist compared to more detailed ‘omics’ studies; thus, our interpretations should be viewed as highly conservative, first approximations.Overall, phylogenetic diversity in the Byrd and WD_3 cores were low compared to microbial communities found in Arctic ice during similar time periods (Miteva et al., 2004
Miteva, V.I., Sheridan, P.P., Brenchley, J.E. (2004) Phylogenetic and physiological diversity of microorganisms isolated from a deep Greenland glacier ice core. Applied and Environmental Microbiology 70, 202–213.
, 2009Miteva, V., Teacher, C., Sowers, T., Brenchley, J. (2009) Comparison of the microbial diversity at different depths of the GISP2 Greenland ice core in relationship to deposition climates. Environmental Microbiology 11, 640–656.
, 2015Miteva, V., Rinehold, K., Sowers, T., Sebastian, A., Brenchley, J. (2015) Abundance, viability and diversity of the indigenous microbial populations at different depths of the NEEM Greenland ice core. Polar Research 34, 25057.
), potentially from higher deposition rates on the Greenland Ice Sheet (GIS) (Mahowald et al., 1999Mahowald, N., Kohfeld, K., Hansson, M., Balkanski, Y., Harrison, S.P., Prentice, I.C., Schulz, M., Rodhe, H. (1999) Dust sources and deposition during the last glacial maximum and current climate: A comparison of model results with paleodata from ice cores and marine sediments. Journal of Geophysical Research-Atmospheres 104, 15895–15916.
). Winds from nearby land masses intersect the GIS (Biscaye et al., 1997Biscaye, P.E., Grousset, F.E., Revel, M., VanderGaast, S., Zielinski, G.A., Vaars, A., Kukla, G. (1997) Asian provenance of glacial dust (stage 2) in the Greenland Ice Sheet project 2 ice core, Summit, Greenland. Journal of Geophysical Research-Oceans 102, 26765–26781.
), while distant locations (i.e. Patagonia) have been suggested as the source for palaeo-deposits in Antarctica (e.g., Sugden et al., 2009Sugden, D.E., McCulloch, R.D., Bory, A.J.M., Hein, A.S. (2009) Influence of Patagonian glaciers on Antarctic dust deposition during the last glacial period. Nature Geoscience 2, 281–285.
). Assuming a positive correlation between dust and attached microorganisms in ice (Abyzov et al., 1998Abyzov, S.S., Mitskevich, I.N., Poglazova, M.N. (1998) Microflora of the deep glacier horizons of Central Antarctica. Microbiology 67, 451–458.
; Miteva et al., 2009Miteva, V., Teacher, C., Sowers, T., Brenchley, J. (2009) Comparison of the microbial diversity at different depths of the GISP2 Greenland ice core in relationship to deposition climates. Environmental Microbiology 11, 640–656.
), effects of climatic and environmental changes on their distribution would be expected. From their study on the vertical profile of microorganisms in ice, Zhang et al. (2006)Zhang, X.F., Ya, T.D., An, L.Z., Tian, L., Xu, S.J. (2006) A study on the vertical profile of bacterial DNA structure in the Puruogangri (Tibetan Plateau) ice core using denaturing gradient gel electrophoresis. Annals of Glaciology, 43, 160–166.
concluded that less dust and microbial species were deposited during warmer periods. The three-fold lower numbers of OTUs and lower dust concentrations in the WD_3 core (Sigl et al., 2016Sigl, M., Fudge, T.J., Winstrup, M., Cole-Dai, J., Ferris, D., McConnell, J.R., Taylor, K.C., Welten, K.C., Woodruff, T.E., Adolphi, F., Bisiaux, M., Brook, E.J., Buizert, C., Caffee, M.W., Dunbar, N.W., Edwards, R., Geng, L., Iverson, N., Koffman, B., Layman, L., Maselli, O.J., McGwire, K., Muscheler, R., Nishiizumi, K., Pasteris, D.R., Phodes, R.H., Sowers, T.A. (2016) The WAIS Divide deep ice core WD2014 chronology–Part 2: Annual-layer counting (0–31 ka BP). Climate of the Past 12, 769–786.
) follow this trend. It is important to note that although both cores were retrieved from West Antarctica (separated by ~161 km), aerosols over ice sheets may differ between locations (Rothlisberger et al., 2000Rothlisberger, R., Hutterli, M.A., Sommer, S., Wolff, E.W., Mulvaney, R. (2000) Factors controlling nitrate in ice cores: Evidence from the Dome C deep ice core. Journal of Geophysical Research-Atmospheres 105, 20565–20572.
).top
Conclusion
The onset of a warmer climate during the LD changed the southern polar front activity and ocean-atmospheric patterns circumventing Antarctica, inevitably affecting aerosol composition, long distance transport, and inland penetration of impurity-burdened air masses (Broecker and Denton, 1989
Broecker, W.S., Denton, G.H. (1989) The role of ocean-atmosphere reorganizations in glacial cycles. Geochimica et Cosmochimica Acta 53, 2465–2501.
; Morse et al., 1998Morse, D.L., Waddington, E.D., Steig, E.J. (1998) Ice age storm trajectories inferred from radar stratigraphy at Taylor Dome, Antarctica. Geophysical Research Letters 25, 3383–3386.
). Distinct chemical and biological signatures were detected in the Byrd and WD_3 ice cores, unique to each climate period. Major ion concentrations were consistent with values reported for Antarctic ice from different climate periods (Palais and Legrand, 1985Palais, J.M., Legrand, M. (1985) Soluble Impurities in the Byrd Station Ice Core, Antarctica-Their Origin and Sources. Journal of Geophysical Research-Oceans 90, 1143–1154.
; Rothlisberger et al., 2000Rothlisberger, R., Hutterli, M.A., Sommer, S., Wolff, E.W., Mulvaney, R. (2000) Factors controlling nitrate in ice cores: Evidence from the Dome C deep ice core. Journal of Geophysical Research-Atmospheres 105, 20565–20572.
; Wolff et al., 2010Wolff, E.W., Barbante, C., Becagli, S., Bigler, M., Boutron, C.F., Castellano, E., de Angelis, M., Federer, U., Fischer, H., Fundel, F., Hansson M., Hutteril, M., Jonsell, U., Karlin, T., Kauffman, P., Lambert, F., Littot, G.C., Mulvaney, R., Rothlisberger, R., Ruth. U., Severi, M., Siggaard-Andersen, M.L., Sime, L.C., Steffensen, J.P., Stocker, T.F., Traversi, R., Twarloh, B., Udisti, R., Wagenbach, D., Wegner, A. (2010) Changes in environment over the last 800,000 years from chemical analysis of the EPICA Dome C ice core. Quaternary Science Reviews 29, 285–295.
; Sigl et al., 2016Sigl, M., Fudge, T.J., Winstrup, M., Cole-Dai, J., Ferris, D., McConnell, J.R., Taylor, K.C., Welten, K.C., Woodruff, T.E., Adolphi, F., Bisiaux, M., Brook, E.J., Buizert, C., Caffee, M.W., Dunbar, N.W., Edwards, R., Geng, L., Iverson, N., Koffman, B., Layman, L., Maselli, O.J., McGwire, K., Muscheler, R., Nishiizumi, K., Pasteris, D.R., Phodes, R.H., Sowers, T.A. (2016) The WAIS Divide deep ice core WD2014 chronology–Part 2: Annual-layer counting (0–31 ka BP). Climate of the Past 12, 769–786.
). Dissimilarities in cell and phylogenetic abundances, and OC concentrations collectively support our view of different deposition patterns onto the Antarctic Ice Sheet during distinct climate periods. Changes in the OM composition between the LGM and LD may further reflect changes in environmental sources (Lamy et al., 1999Lamy, F., Hebbeln, D., Wefer, G. (1999) High-resolution marine record of climatic change in mid-latitude Chile during the last 28,000 years based on terrigenous sediment parameters. Quaternary Research 51, 83–93.
). Differences in predicted metabolic capabilities are proposed to result from variations in LGM and LD OM composition. Therefore, similar to other palaeo-ecological materials, OM composition and microbial assemblages in ice may preserve past environmental conditions, and merit future investigation as palaeoclimate indicators.top
Acknowledgements
Any opinions, findings, or conclusions expressed in this material are those of the authors and do not necessarily reflect the views of the National Science Foundation (NSF). This work was supported by NSF through ANT-1141936 to C.M.F., DGE-0654336 to C.M.F. and H.J.S., and DMR-11-57490 for mass spectral analysis. H.J.S. was supported by a NASA Earth and Science Space Fellowship. We thank the WAIS Divide team and ice core community, the National Ice Core Laboratory (NICL) and D.C. Podgorski, E.A. Bermel, Joseph Parchen, and L. McKittrick for assistance.
Editor: Liane G. Benning
top
References
Abyzov, S.S., Mitskevich, I.N., Poglazova, M.N. (1998) Microflora of the deep glacier horizons of Central Antarctica. Microbiology 67, 451–458.
 Show in context
 Assuming a positive correlation between dust and attached microorganisms in ice (Abyzov et al., 1998; Miteva et al., 2009), effects of climatic and environmental changes on their distribution would be expected.
View in article
Antony, R., Sanyal, A., Kapse, N., Dhakephalkar, P.K., Thamban, M., Nair, S. (2016) Microbial communities associated with Antarctic snow pack and their biogeochemical implications. Microbiological Research 192, 192–202.
 Show in context
 Hence, variations in OM composition between Byrd and WD_3 (Fig. 1c-d and Fig. S-2) could favour microbial communities based on their metabolic capabilities; a concept of community evolution supported by recent findings on microorganisms in Antarctic snow (Antony et al., 2016).
View in article
Antony, R., Willoughby, A.S., Grannas, A.M., Catanzano, V., Sleighter, R.L., Thamban, M., Hatcher, P.G., Nair, S. (2017) Molecular insights on dissolved organic matter transformation by supraglacial microbial communities. Environmental Science & Technology 51, 4328–4337.
 Show in context
 While we argue that transport and deposition patterns of biotic and abiotic material onto the ice sheet is the result of climate induced changes at the source, there is evidence for post-depositional OM processing in near surface environments (Antony et al., 2017).
View in article
Biscaye, P.E., Grousset, F.E., Revel, M., VanderGaast, S., Zielinski, G.A., Vaars, A., Kukla, G. (1997) Asian provenance of glacial dust (stage 2) in the Greenland Ice Sheet project 2 ice core, Summit, Greenland. Journal of Geophysical Research-Oceans 102, 26765–26781.
 Show in context
 Winds from nearby land masses intersect the GIS (Biscaye et al., 1997), while distant locations (i.e. Patagonia) have been suggested as the source for palaeo-deposits in Antarctica (e.g., Sugden et al., 2009).
View in article
Bowman, J.S., Ducklow, H.W. (2015) Microbial communities can be described by metabolic structure: A general framework and application to a seasonally variable, depth-stratified microbial community from the coastal west Antarctic Peninsula. PLoS One 10, e0135868.
 Show in context
 Although metabolic functions can be inferred from 16S RNA gene datasets (Bowman and Ducklow, 2015), obvious limitations exist compared to more detailed ‘omics’ studies; thus, our interpretations should be viewed as highly conservative, first approximations.
View in article
Brinkmeyer, R., Knittel, K., Jurgens, J., Weyland, H., Amann, R., Helmke, E. (2003) Diversity and structure of bacterial communities in arctic versus antarctic pack ice. Applied and Environmental Microbiology 69, 6610–6619.
 Show in context
 An unclassified Actinobacter from Arctic sea ice (99 % sequence match, Brinkmeyer et al., 2003), made up 9 % and 32 % of the Byrd and WD_3 microbial assemblages.
View in article
Broecker, W.S., Denton, G.H. (1989) The role of ocean-atmosphere reorganizations in glacial cycles. Geochimica et Cosmochimica Acta 53, 2465–2501.
 Show in context
 The onset of a warmer climate during the LD changed the southern polar front activity and ocean-atmospheric patterns circumventing Antarctica, inevitably affecting aerosol composition, long distance transport, and inland penetration of impurity-burdened air masses (Broecker and Denton, 1989; Morse et al., 1998).
View in article
Cartapanis, O., Bianchi, D., Jaccard, S.L., Galbraith, E.D. (2016) Global pulses of organic carbon burial in deep-sea sediments during glacial maxima. Nature Communications 7.
 Show in context
 Studies proposing OM as climate proxies have come from aquatic sedimentary records (e.g., Meyers, 1994; Pailler and Bard, 2002; Cartapanis et al., 2016).
View in article
Christner, B.C., Mikucki, J.A., Foreman, C.M., Denson, J., Priscu, J.C. (2005) Glacial ice cores: A model system for developing extraterrestrial decontamination protocols. Icarus 174, 572–584.
 Show in context
 Rightfully, focus has been placed on developing rigorous decontamination protocols (Christner et al., 2005; Miteva et al., 2014), essential for producing credible results.
View in article
Coble, P.G., Green, S.A., Blough, N.V., Gagosian, R.B. (1990) Characterization of dissolved organic-matter in the Black-Sea by fluorescence spectroscopy. Nature 348, 432–435.
 Show in context
 Fluorescing OM was situated at low excitation and emission wavelengths (Ex: 240–300 nm and Em: 300–400 nm) with maxima in regions characteristic of tryptophan-like chemical species (Coble et al., 1990).
View in article
D'Andrilli, J., Cooper, W.T., Foreman, C.M., Marshall, A.G. (2015) An ultrahigh-resolution mass spectrometry index to estimate natural organic matter lability. Rapid Communications in Mass Spectrometry 29, 2385–2401.
 Show in context
 Overall, Byrd OM exhibited more labile molecular formulae (D'Andrilli et al., 2015) compared to WD_3 OM (33.1 % versus 21.3 %).
View in article
D'Andrilli, J., Foreman, C.M., Sigl, M., Priscu, J.C., McConnell, J.R. (2017) A 21,000 year record of fluorescent organic matter markers in the WAIS Divide ice core. Climate of the Past 13, 533–544.
 Show in context
 More recently, the integration of biology into palaeoclimate research is gaining recognition, with distinct microbial assemblages and fluorescent organic matter (OM) signatures in ice indicative of depositional events related to climate (Miteva et al., 2009; 2015; D'Andrilli et al., 2017).
View in article
Fluorescent OM chemical species and intensities were consistent with a larger dataset of LGM and LD comparisons (D'Andrilli et al., 2017).
View in article
Kirchman, D.L. (2002) The ecology of Cytophaga–Flavobacteria in aquatic environments. FEMS Microbiology Ecology 39, 91–100.
 Show in context
 Flavobacteria, for instance, are largely involved in the degradation of amino acid-like OM (Kirchman 2002).
View in article
Lamy, F., Hebbeln, D., Wefer, G. (1999) High-resolution marine record of climatic change in mid-latitude Chile during the last 28,000 years based on terrigenous sediment parameters. Quaternary Research 51, 83–93.
 Show in context
 Although other compounds (carboxyl-rich alicyclic molecules and material derived from linear terpenoids) can occupy the lignin-like region on the van Krevelen diagram, the presence of more lignin-like species may reflect vegetation shifts between glacial-interglacial periods (Lamy et al., 1999).
View in article
Changes in the OM composition between the LGM and LD may further reflect changes in environmental sources (Lamy et al., 1999).
View in article
Landa, M., Blain, S., Christaki, U., Monchy, S., Obernosterer, I. (2016) Shifts in bacterial community composition associated with increased carbon cycling in a mosaic of phytoplankton blooms. Isme Journal 10, 39–50.
 Show in context
 Further, the chemical composition of OM is believed to drive microbial community structure and underlying metabolic strategies (McCarren et al., 2010; Landa et al., 2016).
View in article
Madigan, M.T., Jung, D.O., Woese, C.R., Achenbach, L.A. (2000) Rhodoferax antarcticus sp. nov., a moderately psychrophilic purple nonsulfur bacterium isolated from an Antarctic microbial mat. Archives of Microbiology 173, 449–449.
 Show in context
 OTUs 1 and 5, accounting for 65 % and 7 % of the Byrd assemblage, had ≥97 % 16S rRNA gene sequence identity to Antarctic strains Flavobacterium micromati and Rhodoferax antarcticus (Madigan et al., 2000; Van Trappen et al., 2004).
View in article
Mahowald, N., Kohfeld, K., Hansson, M., Balkanski, Y., Harrison, S.P., Prentice, I.C., Schulz, M., Rodhe, H. (1999) Dust sources and deposition during the last glacial maximum and current climate: A comparison of model results with paleodata from ice cores and marine sediments. Journal of Geophysical Research-Atmospheres 104, 15895–15916.
 Show in context
In reconstructing palaeoclimatic conditions, entrapped gases, dissolved chemicals, and dust have served as millennial-scale climate proxies in ice cores (Mahowald et al., 1999; Petit et al., 1999).
View in article
Varying amounts of dust in ice attest to both hydro- and lithospheric changes on the continents and long distance transport (Palais and Legrand, 1985; Mahowald et al., 1999; Petit et al., 1999; Sigl et al., 2016).
View in article
Overall, phylogenetic diversity in the Byrd and WD_3 cores were low compared to microbial communities found in Arctic ice during similar time periods (Miteva et al., 2004, 2009, 2015), potentially from higher deposition rates on the Greenland Ice Sheet (GIS) (Mahowald et al., 1999).
View in article
McCarren, J., Becker, J.W., Repeta, D.J., Shi, Y.M., Young, C.R., Malmstrom, R.R., Chisholm, S.W., DeLong, E.F. (2010) Microbial community transcriptomes reveal microbes and metabolic pathways associated with dissolved organic matter turnover in the sea. Proceedings of the National Academy of Sciences of the United States of America 107, 16420–16427.
 Show in context
 Further, the chemical composition of OM is believed to drive microbial community structure and underlying metabolic strategies (McCarren et al., 2010; Landa et al., 2016).
View in article
Meyers, P.A. (1994) Preservation of elemental and isotopic source identification of sedimentary organic-matter. Chemical Geology 114, 289–302.
 Show in context
 Studies proposing OM as climate proxies have come from aquatic sedimentary records (e.g., Meyers, 1994; Pailler and Bard, 2002; Cartapanis et al., 2016).
View in article
Miteva, V.I., Sheridan, P.P., Brenchley, J.E. (2004) Phylogenetic and physiological diversity of microorganisms isolated from a deep Greenland glacier ice core. Applied and Environmental Microbiology 70, 202–213.
 Show in context
 Overall, phylogenetic diversity in the Byrd and WD_3 cores were low compared to microbial communities found in Arctic ice during similar time periods (Miteva et al., 2004, 2009, 2015), potentially from higher deposition rates on the Greenland Ice Sheet (GIS) (Mahowald et al., 1999).
View in article
Miteva, V., Teacher, C., Sowers, T., Brenchley, J. (2009) Comparison of the microbial diversity at different depths of the GISP2 Greenland ice core in relationship to deposition climates. Environmental Microbiology 11, 640–656.
 Show in context
 More recently, the integration of biology into palaeoclimate research is gaining recognition, with distinct microbial assemblages and fluorescent organic matter (OM) signatures in ice indicative of depositional events related to climate (Miteva et al., 2009, 2015; D'Andrilli et al., 2017).
View in article
Overall, phylogenetic diversity in the Byrd and WD_3 cores were low compared to microbial communities found in Arctic ice during similar time periods (Miteva et al., 2004, 2009, 2015), potentially from higher deposition rates on the Greenland Ice Sheet (GIS) (Mahowald et al., 1999).
View in article
Assuming a positive correlation between dust and attached microorganisms in ice (Abyzov et al., 1998; Miteva et al., 2009), effects of climatic and environmental changes on their distribution would be expected.
View in article
Miteva, V., Burlingame, C., Sowers, T., Brenchley, J. (2014) Comparative evaluation of the indigenous microbial diversity vs. drilling fluid contaminants in the NEEM Greenland ice core. FEMS Microbiology Ecology 89, 238–256.
 Show in context
 Rightfully, focus has been placed on developing rigorous decontamination protocols (Christner et al., 2005; Miteva et al., 2014), essential for producing credible results.
View in article
Miteva, V., Rinehold, K., Sowers, T., Sebastian, A., Brenchley, J. (2015) Abundance, viability and diversity of the indigenous microbial populations at different depths of the NEEM Greenland ice core. Polar Research 34, 25057.
 Show in context
 More recently, the integration of biology into palaeoclimate research is gaining recognition, with distinct microbial assemblages and fluorescent organic matter (OM) signatures in ice indicative of depositional events related to climate (Miteva et al., 2009, 2015; D'Andrilli et al., 2017).
View in article
The Inverse Simpson estimated low biodiversity across both samples (Byrd: 2.22.2; WD_3: 3.9–4.0; 95 % CI) when compared to other deep ice core communities (Miteva et al., 2015).
View in article
Overall, phylogenetic diversity in the Byrd and WD_3 cores were low compared to microbial communities found in Arctic ice during similar time periods (Miteva et al., 2004, 2009, 2015), potentially from higher deposition rates on the Greenland Ice Sheet (GIS) (Mahowald et al., 1999).
View in article
Morse, D.L., Waddington, E.D., Steig, E.J. (1998) Ice age storm trajectories inferred from radar stratigraphy at Taylor Dome, Antarctica. Geophysical Research Letters 25, 3383–3386.
 Show in context
 The onset of a warmer climate during the LD changed the southern polar front activity and ocean-atmospheric patterns circumventing Antarctica, inevitably affecting aerosol composition, long distance transport, and inland penetration of impurity-burdened air masses (Broecker and Denton, 1989; Morse et al., 1998).
View in article
Pailler, D., Bard, E. (2002) High frequency palaeoceanographic changes during the past 140,000yr recorded by the organic matter in sediments of the Iberian Margin. Palaeogeography Palaeoclimatology Palaeoecology 181, 431–452.
 Show in context
 Studies proposing OM as climate proxies have come from aquatic sedimentary records (e.g., Meyers, 1994; Pailler and Bard, 2002; Cartapanis et al., 2016).
View in article
Palais, J.M., Legrand, M. (1985) Soluble Impurities in the Byrd Station Ice Core, Antarctica-Their Origin and Sources. Journal of Geophysical Research-Oceans 90, 1143–1154.
 Show in context
 Varying amounts of dust in ice attest to both hydro- and lithospheric changes on the continents and long distance transport (Palais and Legrand, 1985; Mahowald et al., 1999; Petit et al., 1999; Sigl et al., 2016).
View in article
Major ion concentrations were consistent with values reported for Antarctic ice from different climate periods (Palais and Legrand, 1985; Rothlisberger et al., 2000; Wolff et al., 2010; Sigl et al., 2016).
View in article
Pedro, J.B., Rasmussen, S.O., van Ommen, T.D. (2012) Tightened constraints on the time-lag between Antarctic temperature and CO2 during the last deglaciation. Climate of the Past 8, 1213–1221.
 Show in context
 The ice core sections, Byrd and WD_3, correspond to approximately 20.5 ka BP (before present 1950) (Pedro et al., 2012) and 14.5 ka BP (WAIS Divide Project Members, 2013), respectively.
View in article
Petit, J.R., Jouzel, J., Raynaud, D., Barkov, N.I., Barnola, J.M., Basile, I., Bender, M., Chappellaz, J., Davis, M., Delaygue, G., Delmotte, M., Kotlyakov, V.M., Legrand, M., Lipenkov, V.Y., Lorius, C., Pepin, L., Ritz, C., Saltzman, E., Stievand, M. (1999) Climate and atmospheric history of the past 420,000 years from the Vostok ice core, Antarctica. Nature 399, 429–436.
 Show in context
 In reconstructing palaeoclimatic conditions, entrapped gases, dissolved chemicals, and dust have served as millennial-scale climate proxies in ice cores (Mahowald et al., 1999; Petit et al., 1999).
View in article
Varying amounts of dust in ice attest to both hydro- and lithospheric changes on the continents and long distance transport (Palais and Legrand, 1985; Mahowald et al., 1999; Petit et al., 1999; Sigl et al., 2016).
View in article
Reddy, G.S.N., Matsumoto, G.I., Schumann, P., Stackebrandt, E., Shivaji, S. (2004) Psychrophilic pseudomonads from Antarctica: Pseudomonas antarctica sp nov., P. meridiana sp nov and P. proteolytica sp nov. International Journal of Systematic and Evolutionary Microbiology 54, 713–719.
 Show in context
 OTUs 8 and 12 encompassed 32 % and 4 % of the WD_3 library, with 96 % and 97 % sequence identity to Pseudomonas proteolytica from Antarctic ponds (Reddy et al., 2004).
View in article
Rothlisberger, R., Hutterli, M.A., Sommer, S., Wolff, E.W., Mulvaney, R. (2000) Factors controlling nitrate in ice cores: Evidence from the Dome C deep ice core. Journal of Geophysical Research-Atmospheres 105, 20565–20572.
 Show in context
 It is important to note that although both cores were retrieved from West Antarctica (separated by ~161 km), aerosols over ice sheets may differ between locations (Rothlisberger et al., 2000).
View in article
Major ion concentrations were consistent with values reported for Antarctic ice from different climate periods (Palais and Legrand, 1985; Rothlisberger et al., 2000; Wolff et al., 2010; Sigl et al., 2016).
View in article
Scott, M.J., Jones, M.N., Woof, C., Tipping, E. (1998) Concentrations and fluxes of dissolved organic carbon in drainage water from an upland peat system. Environment International 24, 537–546.
 Show in context
 Correlations between less degraded OM fractions (i.e. amino sugars, amino acids, and non-humic-like chemical species) and aridity have previously been reported (Scott et al., 1998), agreeing with our interpretation of the OM molecular characteristics (higher chemical lability) found in the drier climate of the LGM.
View in article
Sigl, M., Fudge, T.J., Winstrup, M., Cole-Dai, J., Ferris, D., McConnell, J.R., Taylor, K.C., Welten, K.C., Woodruff, T.E., Adolphi, F., Bisiaux, M., Brook, E.J., Buizert, C., Caffee, M.W., Dunbar, N.W., Edwards, R., Geng, L., Iverson, N., Koffman, B., Layman, L., Maselli, O.J., McGwire, K., Muscheler, R., Nishiizumi, K., Pasteris, D.R., Phodes, R.H., Sowers, T.A. (2016) The WAIS Divide deep ice core WD2014 chronology–Part 2: Annual-layer counting (0–31 ka BP). Climate of the Past 12, 769–786.
 Show in context
 Varying amounts of dust in ice attest to both hydro- and lithospheric changes on the continents and long distance transport (Palais and Legrand, 1985; Mahowald et al., 1999; Petit et al., 1999; Sigl et al., 2016).
View in article
The three-fold lower numbers of OTUs and lower dust concentrations in the WD_3 core (Sigl et al., 2016) follow this trend.
View in article
Major ion concentrations were consistent with values reported for Antarctic ice from different climate periods (Palais and Legrand, 1985; Rothlisberger et al., 2000; Wolff et al., 2010; Sigl et al., 2016).
View in article
Sugden, D.E., McCulloch, R.D., Bory, A.J.M., Hein, A.S. (2009) Influence of Patagonian glaciers on Antarctic dust deposition during the last glacial period. Nature Geoscience 2, 281–285.
 Show in context
 Winds from nearby land masses intersect the GIS (Biscaye et al., 1997), while distant locations (i.e. Patagonia) have been suggested as the source for palaeo-deposits in Antarctica (e.g., Sugden et al., 2009).
View in article
Van Trappen, S., Vandecandelaere, I., Mergaert, J., Swings, J. (2004) Flavobacterium degerlachei sp nov., F. frigoris sp nov and F. micromati sp nov., novel psychrophilic bacteria isolated from microbial mats in Antarctic lakes. International Journal of Systematic and Evolutionary Microbiology 54, 85–92.
 Show in context
 OTUs 1 and 5, accounting for 65 % and 7 % of the Byrd assemblage, had ≥97 % 16S rRNA gene sequence identity to Antarctic strains Flavobacterium micromati and Rhodoferax antarcticus (Madigan et al., 2000; Van Trappen et al., 2004).
View in article
WAIS Divide Project Members (2013) Onset of deglacial warming in West Antarctica driven by local orbital forcing. Nature 500, 440–444.
 Show in context
 The ice core sections, Byrd and WD_3, correspond to approximately 20.5 ka BP (before present 1950) (Pedro et al., 2012) and 14.5 ka BP (WAIS Divide Project Members, 2013), respectively.
View in article
Wolff, E.W., Barbante, C., Becagli, S., Bigler, M., Boutron, C.F., Castellano, E., de Angelis, M., Federer, U., Fischer, H., Fundel, F., Hansson M., Hutteril, M., Jonsell, U., Karlin, T., Kauffman, P., Lambert, F., Littot, G.C., Mulvaney, R., Rothlisberger, R., Ruth. U., Severi, M., Siggaard-Andersen, M.L., Sime, L.C., Steffensen, J.P., Stocker, T.F., Traversi, R., Twarloh, B., Udisti, R., Wagenbach, D., Wegner, A. (2010) Changes in environment over the last 800,000 years from chemical analysis of the EPICA Dome C ice core. Quaternary Science Reviews 29, 285–295.
 Show in context
 Major ion concentrations were consistent with values reported for Antarctic ice from different climate periods (Palais and Legrand, 1985; Rothlisberger et al., 2000; Wolff et al., 2010; Sigl et al., 2016).
View in article
Zhang, X.F., Ya, T.D., An, L.Z., Tian, L., Xu, S.J. (2006) A study on the vertical profile of bacterial DNA structure in the Puruogangri (Tibetan Plateau) ice core using denaturing gradient gel electrophoresis. Annals of Glaciology, 43, 160–166.
 Show in context
 From their study on the vertical profile of microorganisms in ice, Zhang et al. (2006) concluded that less dust and microbial species were deposited during warmer periods.
View in article
top
Supplementary Information
Methods
Sample collection and decontamination
Ice cores were obtained from the National Ice Core Laboratory (NICL), originally recovered from West Antarctica at the Byrd Research Station (80.01 °S, 119.32 °W, elevation 1,553 m) in 1968, and at the West Antarctic Ice Sheet Divide (deviation #3; WD_3: 79.48 °S, 112.11 °W, elevation 1,759 m) in 2013 (see Fig. S-1). The analysed ice core sections depths were 2,225.00 m and 1,344.00 m below the surface, respectively. There were strict sample volume limitations imposed by working with decontaminated ice cores so as to obtain enough ice core meltwater for the biological and chemical analyses, yet maintain 0.5 m of total ice core to preserve a relatively low grouping of annual layers (estimations include <50 years for the Byrd sample from the Last Glacial Maximum and approximately six years for the WD_3 sample from the last deglaciation period). Outer ice core layers (2–3 mm) were removed to decontaminate the ice cores using UV-irradiated clean razor blades within a class 1000 clean room in the Subzero Science and Engineering Research Facility at Montana State University maintained at -10 °C, following protocols developed for use on the Vostok ice core (Christner et al., 2005). Ice core sections containing fractures (cracked ice or broken sections) which provide the means for contaminants to penetrate to the core interior, were removed prior to melting. Meltwater from the outer layers was collected to identify potential contaminants at the bulk level (i.e. organic matter [OM] fluorescence signals, OM concentration, and bacterial cell abundances). Decontaminated inner core samples were placed in a clean, combusted (450 °C for 5 hr) glass carboy, and sealed for controlled melting at 5 °C for 72 hr. The inner ice core meltwater (~3 and 5 L) was then aliquoted into combusted glassware and stored in the dark at 4 °C for the suite of bulk and molecular level chemical and biological experiments.
Bulk geochemical concentration and fluorescence analyses
Total organic carbon concentrations were measured on ice core meltwater in quadruplicate with a GE Sievers 900 Total Organic Carbon Analyzer. Milli-Q water samples were run as blanks in between each ice core sample. The organic carbon analyser had an internal acidification step; therefore acidification of samples prior to analysis was not required.
Samples for anion analyses were filtered through 0.4 μm, 47 mm nucleopore filters, deionised water was used as a filtration blank, and 2 mL of each sample were analysed in triplicate on a Dionex ICS-1100 ion chromatography system (Thermo-Scientific) for trace element and nutrient concentrations. Excitation Emission Matrices (EEMs) of fluorescent OM were obtained on a Horiba Jobin Yvon spectrofluorometer. For fluorescence spectroscopy measurements, detailed descriptions of UV/Vis absorbance and data acquisition specifications are provided in D'Andrilli et al. (2017). Due to the limited number of samples, multivariate parallel factor analysis was not appropriate for further decomposition of this data.
FT-ICR MS analysis
OM was extracted from the ice core meltwater prior to FT-ICR MS with 100 mg Bond Elut PPL Solid Phase Extraction cartridges (Agilent Technologies) following a procedure previously reported (Dittmar et al., 2008). Samples were eluted with 2 mL of HPLC grade methanol. A blank control was generated with Milli-Q Water passed through the SPE cartridges and eluted with methanol. All samples were stored in a 4 °C refrigerator in the dark prior to experimentation. Mass spectra were generated by a custom-built Electrospray Ionisation (ESI) source, operated in negative mode, coupled to a custom built superconducting 9.4 tesla magnet FT-ICR mass spectrometer at the National High Magnetic Field Laboratory (NHMFL), in Tallahassee, Florida (Blakney et al., 2011; Kaiser et al., 2011). Sample syringes were triplicate rinsed with methanol between samples and spectra were collected between samples to ensure no sample-to-sample contamination within the instrument.
Singly charged, negative gaseous ions were produced by a custom-built micro-electrospray ionisation source (Emmett et al., 1998). Positive ESI and atmospheric pressure photoionisation were also considered for this work, however were not included based on the sample volumes available and the further use of chemicals needed for efficient ionisation (e.g., formic acid, ammonium hydroxide, and toluene). ESI and FT-ICR MS experimental parameters were as follows: 50 µm i.d. fused-silica tube, syringe pump flow rate 0.5 µL/min, needle voltage -2700 V, tube lens -350 V, heated metal capillary operated at 3.37 W, ion funnels -120 and -70 V, chirp rate of 50 Hz/µs ranging between m/z 100–1500, and octopole ion guide frequencies set at 2.0 MHz. Multiple time domain acquisitions were co-added (50–200), Hanning apodised, and zero-filled once before rapid Fourier transformation and magnitude calculation (Marshall and Verdun 1990). FT-ICR MS mass resolving power (m/Δm50%) was reported >800,000 at m/z 400 for both samples.
NHMFL software was employed for mass spectral calibration and to generate peak lists for molecular formula assignment limited to mass spectral peaks 6x the baseline rms noise, a conservative threshold. Ice core mass spectra were internally calibrated with two known methylene homologous compound series ranging 200–700 Da and the data were sorted for molecular formula assignment by established methods (Stenson et al., 2003). Elemental composition assignments of singly charged OM species included all possible naturally occurring molecular combinations of C, H, N, O, and S, confirmed with individual monoisotopic mass spectral peaks, rms error < 1 ppm, and homologous series, a robust, unambiguous method for individual molecular formulae assignments; details described in D’Andrilli et al. (2015). Such constraints greatly reduce the possibility for error in molecular formulae determination, and monoisotopic mass spectra spacing patterns were used to confirm each molecular assignment individually. Only molecular formulae assigned above the S/N threshold were compared between samples in this work. Any molecular formulae above the S/N threshold (6σ) in the blank control sample were removed from Byrd and WD_3 ice core mass spectral peak lists prior to further interpretation. Singly charged chemical species were confirmed by the 13C isotopic mass spectral peak separations of m/z 1.0034 between ions differing in elemental composition by 12Cc vs. 12Cc-1-13C1.
Ice core molecular formulae were analysed to compare and contrast chemical speciation in compound classes, molecular heterogeneity, hydrogen saturation, oxygenation, aromaticity, and chemical lability (Kim et al., 2003; Koch and Dittmar 2006; D’Andrilli et al., 2015). OM characterisation is readily visualised on Van Krevelen diagrams, and composition percentages (molecular heterogeneity, aromaticity, and chemical lability) were calculated based on the numbers of molecular formulae within compound class boundaries (modified from Hodgkins et al., 2014) relative to each sample.
Bacterial cell abundances and imaging
Samples for bacterial cell enumeration were preserved with prefiltered (0.2 μm) formalin to a final concentration of 2 % v/v. Ice core meltwater (5 mL) was filtered onto polycarbonate membranes (0.2 μm pore size) and stained with SYBR® Green (final concentration 25X, Invitrogen). A Nikon E800 epifluorescence microscope was used to count at least 30 randomly selected fields, with each field containing a minimum of 20 cells per grid (Lisle et al., 2004), resulting in the enumeration of a minimum of 600 cells. Triplicate filters for each sample were prepared and counted.
Samples for Field Emission Scanning Electron Microscopy (FE SEM) were filtered onto a 0.02 μm, 10 mm diameter PES membrane filter. Filtered volumes included 10, 50, and 100 mL. Filters were sputter coated with 10 nm of Au-Pd and both filters and cell like structures were imaged with a Zeiss SUPRA 55VP FE SEM.
DNA Extraction and PCR Amplification
For microbial community analysis of ice core samples, ice core meltwater (500 mL) was filtered onto 47 mm Supor®-200 (0.2 μm pore size) sterile membranes (PALL) under low pressure (<7 psi). Filters were transferred to cryovials and stored at -80 °C until DNA extraction. Genomic DNA was extracted using the PowerSoil DNA extraction kit (MoBio, Carlsbad, CA, USA) following manufacturer’s recommendations. Extracted genomic DNA was quantified using the high sensitivity Qubit DNA Assay Kit (Molecular Probes, Eugene, OR, USA) and was found to be below the detection limit (<0.2 ng).
The low biomass in ice cores combined with the age of DNA has been shown to impede the amplification of genomic DNA. Multiple displacement amplification (MDA) has been successfully used to amplify genomic DNA from low biomass samples (Binga et al., 2008); however, it has also been shown to be biased in study. In this study subsamples were both analysed directly and with MDA. No difference was found between the MDA amplicons and the corresponding extraction blanks, therefore, our MDA treated samples were not considered for further analysis.
An initial PCR was performed with primers 9F (5′ -GAGTTTGATCCTGGCTCAG) and 1492R (5′-GGTTACCTTGTTACGACTT) (Stackebrandt et al., 1993). The partial 16S rRNA gene was amplified in 50 μL PCR reactions. PCR reactions contained extracted genomic DNA, 0.1 μM of each primer, a 1X final concentration of Bull’s Eye PREMIUM Taq 2X Mix (Midwest Scientific, St Louis, MO, USA), and an adjusted volume of nuclease free water. The amplification protocol consisted of an initial denaturation at 94 °C for 4 min, followed by 30 cycles of denaturation at 94 °C for 30 s, annealing at 56 °C for 1 min, extension at 72 °C for 1 min, and a final extension step at 72 °C for 10 min. Subsequently, 16S RNA gene amplicons were subjected to a nested PCR using primers specific to the V3-V4 regions of the 16S rRNA gene. Primer complexes included the Illumina adaptor sequences followed by either the universal primers 341F (5'acactctttccctacacgacgctcttccgatctCCTACGGGNGGCWGCAG-3') or 805R (5'gtgactggagttcagacgtgtgctcttccgatctGACTACHVGGGTATCTAATCC-3') (UW Biotechnology Center, Madison, WI, USA). The 50 μL PCR reaction contained 2.5 µL of PCR amplicon and concentrations of PCR reagents akin to the protocol above. The nested PCR amplification consisted of an initiation denaturation at 95 °C for 3 min followed by 12 cycles of denaturation at 95 °C for 30 s, annealing at 55 °C for 30 s, extension at 72 °C for 30 s, and a final extension step at 72 °C for 5 min. PCR was performed in an Eppendorf Mastercycler pro S. The presence of PCR products of the correct size was confirmed by band visualisation in a 0.8 % agarose Tris-acetate EDTA gel stained with GelRed™. Locus-specific, amplified DNA was submitted to the University of Wisconsin-Madison Biotechnology Center. Both blank samples for the nested PCR, and extraction procedure were included in the sequence libraries. Paired end, 250 bp sequencing was performed using the Illumina MiSeq Sequencer and a MiSeq 500 bp (v2) sequencing cartridge. Images were analysed using the standard Illumina Pipeline, version 1.8.2.
DNA sequence analysis
Forward and reverse sequence libraries were joined with the Quantitative Insights Into Microbial Ecology (QIIME) toolkit version 1.9.0 (Caporaso et al., 2010), sequences were overlapped with a minimum overlap of 50 base pairs and a minimum quality score of 30. The resulting overlapped sequences were analysed with the Mothur platform v.1.34.4 (Schloss et al., 2009). Sequences containing ambiguous bases, homopolymers longer than eight bases, or an average quality score below 30 over a 50 bp window were excluded from further analysis (Schloss et al., 2011). The maximum sequence length from a bidirectional MiSeq run was 467, and sequences shorter than 450 bp were removed. The processed sequences were aligned against the SILVA Gold database in Mothur. Chimeric sequences were identified and removed with UCHIME (Edgar et al., 2011), in combination with the SILVA Gold database in Mothur, and a second chimera check using the sequence collection from the present study as a database. Sequences were classified with a Bayesian method (Wang et al., 2007), using the Mothur formatted version of the RDP classifier. An operational taxonomic unit (OTU) was defined at ≥97 % 16S rRNA sequence identity. All OTUs found in the sequenced blank samples (extraction and PCR) were removed from each ice core sample to eliminate any potential source of contamination. Only OTUs unique to the ice core samples were further analysed. All raw sequences were deposited in GenBank NCBI under the following accession numbers SRP090439.
Statistical analyses were performed calculating alpha diversity defined by Chao 1 (Chao, 1984) and inverse Simpson, an estimator for eveness and richness (Simpson, 1949), on the Mothur platform. For pairwise comparisons, both ice core sequence libraries were rarefied to n = 5,000 sequences per library. The libshuff method using the Cramer-von Mises test statistic was implemented to determine differences between the communities (Singleton et al., 2004). The construction of a potential functional profile for ice core bacterial assemblages was predicted with the Phylogenetic Investigation of Communities by Reconstruction of Unobserved States (PICRUSt) bioinformatics tool (Langille et al., 2013) from OTUs classified with Greengenes within Mothur. PICRUSt takes the relative abundances of 16S rRNA gene sequences to predict gene family abundances from a database of reference genomes. The generation of functional profiles using PICRUSt is based on the assumption that there is an association between 16S rRNA detected phylogeny and genetic content (Bowman and Ducklow, 2015). Functional gene profiles were subsequently generated with the Statistical Analysis of Metagenomic Profiles (STAMP; version 2.1.3) software.
Volatile organic carbon and hydrocarbon contamination assessment
Samples of ice cores were sent to Energy Laboratories, Inc., (Billings, Montana, USA) for diesel range organics (DROs) and total extractable hydrocarbons analysis to confirm or deny the presence of drilling fluid contamination present in the ice cores. DROs and petroleum hydrocarbons were analysed by the methods SW8015M, and volatile organic compound (VOC) concentrations were measured by method SW8260B. Furthermore, samples were tested for Isopar-K drilling fluid contamination using the 8015B method for diesel range organics with a slight modification to specifically detect the fluid. A low-level liquid chromatography reference experiment was run to provide a chromatogram for the Isopar-K drilling fluid.
Supplementary Tables and Figures
Table S-1 Volatile organic compounds, diesel range organics, and total extractable hydrocarbon concentrations for the inner ice core of Byrd and WAIS Divide deviation #3 (WD_3), and the outer shavings removed during decontamination procedures of the WD_3 ice core. Environmental Protection Agency (EPA) detection methods were used for contaminant analyses.
| Volatile Organics and Contaminants | EPA | Byrd | WD_3 | WD_3 |
| Method | (inner core) | (inner core) | (outer shavings) | |
| Volatile Organic Compounds (VOCs) | SW8260B | 0.00061 mg/L | 0.017 mg/L | 0.9 mg/L |
| (1,1-Dichloro-1-fluoroethane) | ||||
| Diesel Range Organics (DROs) | SW8015M | ND | ND | 7.7 mg/L |
| RL = 0.24 mg/L | RL = 0.31 mg/L | |||
| Total Extractable Hydrocarbons | SW8015M | ND | ND | 7.9 mg/L |
| RL = 0.24 mg/L | RL = 0.31 mg/L |
RL: Analyte reporting limit
ND: Not detected
Table S-2 Antarctic ice core location, approximate ages, climate descriptions and concentrations of organic carbon (OC), bacteria, Cl-, NO3-, PO43-, and SO42- (± 1 SD) for Byrd Research Station and the WAIS Divide deviation #3 (WD_3) ice core samples of the Last Glacial Maximum (LGM) and the last deglaciation (LD) climate periods.
| Age | Climate | OC | Bacteria | Cl- | NO3- | PO43- | SO42- | |
| Ice Core Sample | (ka BP 1950) | Period | (µM) | (105 cells/mL) | (µM) | (µM) | (µM) | (µM) |
| Byrd | 20.458 | LGM | 445 (±5.3) | 1.92 (±0.13) | 2.90 (±0.07) | 5.16 (±0.16) | 2.77 (±2.08) | 8.08 (±4.18) |
| WD_3 | 14.528 | LD | 11.8 (±0.29) | 0.13 (±0.03) | 1.95 (±0.07) | 0.156 (±0.020) | ND | 1.01 (±0.08) |
ND = Below detection limit
Download in ExcelTable S-3 Molecular composition of CcHhNnOoSs containing organic matter from Byrd Research Station and WAIS Divide deviation #3 (WD_3) ice core sections determined by negative ion electrospray ionisation 9.4 tesla Fourier transform ion cyclotron resonance mass spectrometry.
| Byrd | WD_3 | |
| Molecular Species | (%) | (%) |
| CHO | 63.1 | 74.4 |
| CHOS1 | 22.6 | 19.3 |
| CHON1 | 2.4 | 1.6 |
| CHON1S1 | 2.4 | 1.33 |
| CHON2 | 6.51 | 2.26 |
| CHON2S1 | 2.91 | 1.13 |

Figure S-1 Geographical location of the Byrd and WAIS Divide drilling sites.

Figure S-2 H/C and O/C molecular formulae of organic matter (OM) characterised in the WAIS Divide deviation #3 (WD_3) and Byrd Antarctic ice core OM sections, highlighting the degree of overlap, and exact composition matches between both samples on a van Krevelen diagram. Chemically labile OM (easily altered) is shown as a function of hydrogen saturation.

Figure S-3 Field emission scanning electron microscopy (FESEM) images from (a-b) WAIS Divide deviation #3 (WD_3) and (c-d) Byrd Antarctic ice core sections. Scale bar is 1 µm.
Supplementary Information References
Blakney, G.T., Hendrickson, C.L., Marshall, A.G. (2011) Predator data station: A fast data acquisition system for advanced FT-ICR MS experiments. International Journal of Mass Spectrometry 306, 246–252.
Bowman, J.S., Ducklow, H.W. (2015) Microbial communities can be described by metabolic structure: A general framework and application to a seasonally variable, depth-stratified microbial community from the coastal west Antarctic Peninsula. PLoS One 10, e0135868.
Caporaso, J.G., Kuczynski, J., Stombaugh, J., Bittinger, K., Bushman, F.D., Costello, E.K., Fierer, N., Pena, A.G., Goodrich, J.K., Gordon, J.I., Huttley, G.A., Kelley, S.T., Knights, D., Koenig, J.E., Ley, R.E., Lozupone, C.A., McDonald, D., Muegge, B.D., Pirrung, M., Reeder, J., Sevinsky, J.R., Tumbaugh, P.J., Walters, W.A., Widmann, J., Yatsunenko, T., Zaneveld, J., Knight, R. (2010) QIIME allows analysis of high-throughput community sequencing data. Nature Methods 7, 335–336.
Chao, A. (1984) Nonparametric estimation of the number of classes in a population. Scandinavian Journal of Statistics 11, 265–270.
Christner, B.C., Mikucki, J.A., Foreman, C.M., Denson, J., Priscu, J.C. (2005) Glacial ice cores: A model system for developing extraterrestrial decontamination protocols. Icarus 174, 572–584.
D'Andrilli, J., Cooper, W., Foreman, C., Marshall, A. (2015) An ultrahigh resolution mass spectrometry index to estimate natural organic matter lability. Rapid Communications in Mass Spectrometry 29, 2385–2401, doi: 10.1002/rcm.7400.
D'Andrilli, J., Foreman, C.M., Sigl, M., Priscu, J.C., McConnell, J.R. (2017) A 21,000 year record of fluorescent organic matter markers in the WAIS Divide ice core. Climate of the Past 13, 533–544, doi: 10.5194/cp-13-533-2017.
Dittmar, T., Koch, B., Hertkorn, N., Kattner, G. (2008) A simple and efficient method for the solid-phase extraction of dissolved organic matter (SPE-DOM) from seawater. Limnology and Oceanography-Methods 6, 230–235.
Edgar, R.C., Haas, B.J., Clemente, J.C., Quince, C., Knight, R. (2011) UCHIME improves sensitivity and speed of chimera detection. Bioinformatics 27, 2194–2200.
Emmett, M.R., White, F.M., Hendrickson, C.L., Shi, S.D.H., Marshall, A.G. (1998) Application of micro-electrospray liquid chromatography techniques to FT-ICR MS to enable high-sensitivity biological analysis. Journal of the American Society for Mass Spectrometry 9, 333–340.
Hodgkins, S.B., Tfaily, M.M., McCalley, C.K., Logan, T.A., Crill, P.M., Saleska, S.R., Rich, V.I., Chanton, J.P. (2014) Changes in peat chemistry associated with permafrost thaw increase greenhouse gas production. Proceedings of the National Academy of Sciences USA 111, 5819–5824.
Kaiser, N.K., Quinn, J.P., Blakney, G.T., Hendrickson, C.L., Marshall, A.G. (2011) A Novel 9.4 Tesla FTICR Mass Spectrometer with Improved Sensitivity, Mass Resolution, and Mass Range. Journal of the American Society for Mass Spectrometry 22, 1343–1351.
Kim, S., Kramer, R.W., Hatcher, P.G. (2003) Graphical method for analysis of ultrahigh-resolution broadband mass spectra of natural organic matter, the van Krevelen diagram. Analytical Chemistry 75, 5336–5344.
Koch, B.P., Dittmar, T. (2006) From mass to structure: an aromaticity index for high-resolution mass data of natural organic matter. Rapid Communications in Mass Spectrometry 20, 926–932.
Langille, M.G.I., Zaneveld, J., Caporaso, J.G., McDonald, D., Knights, D., Reyes, J.A., Clemente, J.C., Burkepile, D.E., Thurber, R.L.V., Knight, R., Beiko, R.G., Huttenhower, C. (2013) Predictive functional profiling of microbial communities using 16S rRNA marker gene sequences. Nature Biotechnology 31, 814–821.
Lisle, J.T., Hamilton, M.A., Willse, A.R., McFeters, G.A. (2004) Comparison of fluorescence microscopy and solid-phase cytometry methods for counting bacteria in water. Applied and Environmental Microbiology 70, 5343–5348.
Marshall, A.G., Verdun, F.R. (1990) Fourier Transforms in NMR, Optical, and Mass Spectrometry: A User's Handbook. Elsevier, Amsterdam.
Schloss, P.D., Westcott, S.L., Ryabin, T., Hall, J.R., Hartmann, M., Hollister, E.B., Lesniewski, R.A., Oakley, B.B., Parks, D.H., Robinson, C.J., Sahl, J.W., Stres, B., Thallinger, G.G., Van Horn, D.J., Weber, C.F. (2009) Introducing mothur: Open-Source, platform-independent, community-supported software for describing and comparing microbial communities. Applied and Environmental Microbiology 75, 7537–7541.
Schloss, P.D., Gevers, D., Westcott, S.L. (2011) Reducing the effects of PCR amplification and sequencing artifacts on 16S rRNA-Based Studies. PLoS One 6, e27310.
Simpson, E.H. (1949) Measurement of diversity. Nature 163, 688–688.
Singleton, D.R., Rathbun, S.L., Dyszynski, G.E., Whitman, W.B. (2004) Section 7 update: LIBSHUFF Comparisons of 16S rRNA Gene Clone Libraries. In: Kowalchuk, G.A., de Bruijn, F.J., Head, I.M., Akkermans, A.D., van Elsas, J.D. (Eds.) Molecular Microbial Ecology Manual. Springer Netherlands, Dordrecht, 3263–3274.
Stackebrandt, E., Liesack, W., Goebel, B.M. (1993) Bacterial diversity in a soil sample from a subtropical australian environment as determined by 16s rDNA Analysis. Faseb Journal 7, 232–236.
Stenson, A.C., Marshall, A.G., Cooper, W.T. (2003) Exact masses and chemical formulas of individual Suwannee River fulvic acids from ultrahigh resolution electrospray ionization Fourier transform ion cyclotron resonance mass spectra. Analytical Chemistry 75, 1275–1284.
Wang, Q., Garrity, G.M., Tiedje, J.M., Cole, J.R. (2007) Naive Bayesian classifier for rapid assignment of rRNA sequences into the new bacterial taxonomy. Applied and Environmental Microbiology 73, 5261–5267.
Figures and Tables
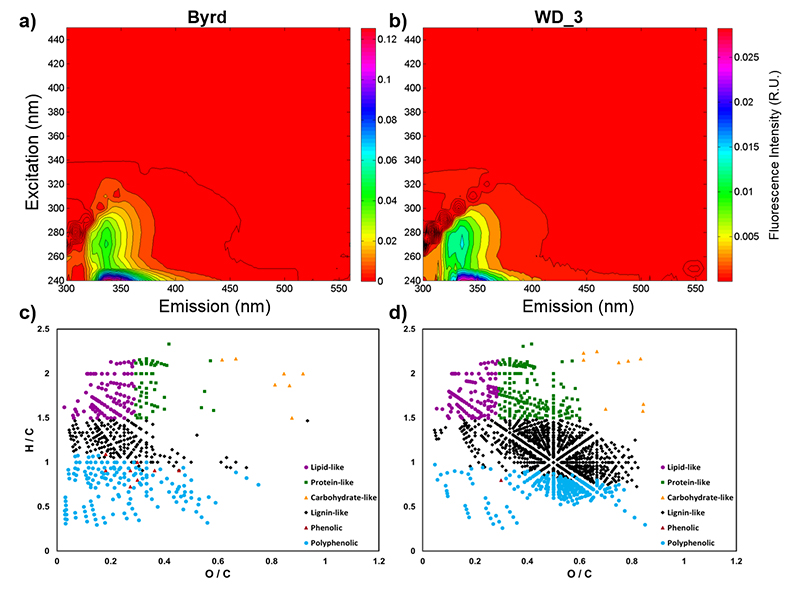
Figure 1 Organic matter (OM) characterisation of Byrd and WAIS Divide deviation #3 (WD_3) Antarctic ice cores by (a-b) fluorescence spectroscopy and (c-d) Fourier transform ion cyclotron resonance mass spectrometry van Krevelen diagrams.
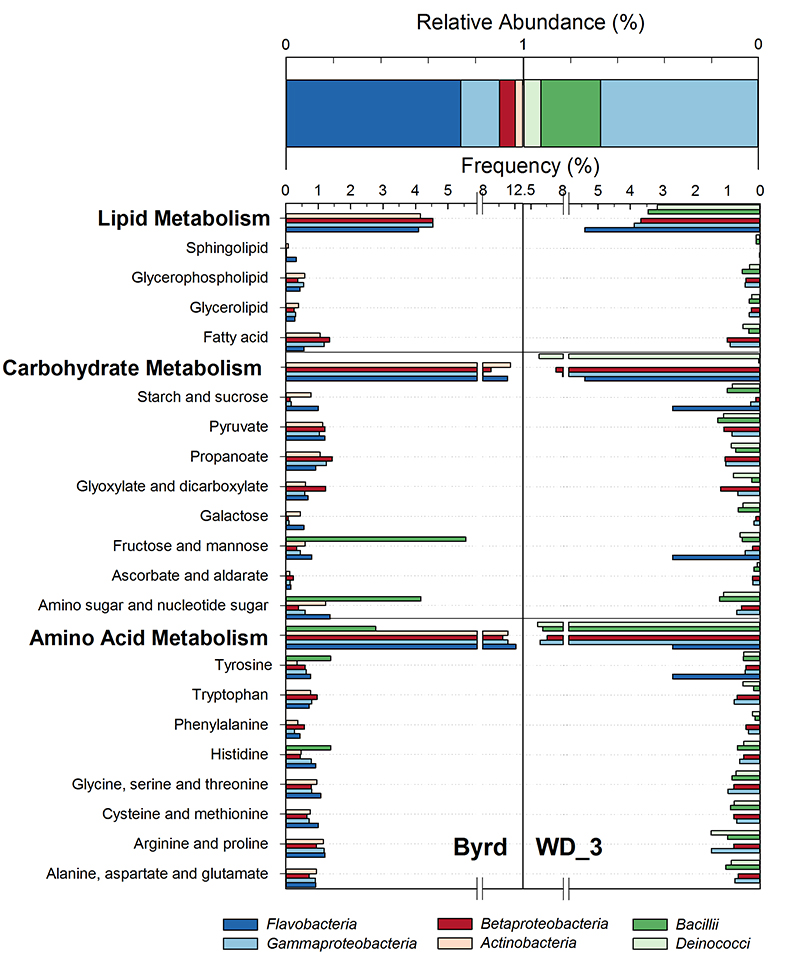
Figure 2 Top: Relative abundance of 16S rRNA gene sequences representing the distribution of microbial assemblages within the Byrd and WAIS Divide deviation #3 (WD_3) ice core sections. Bottom: Comparisons of predicted genes involved in lipid, carbohydrate, and amino acid pathways for the dominant bacterial classes.
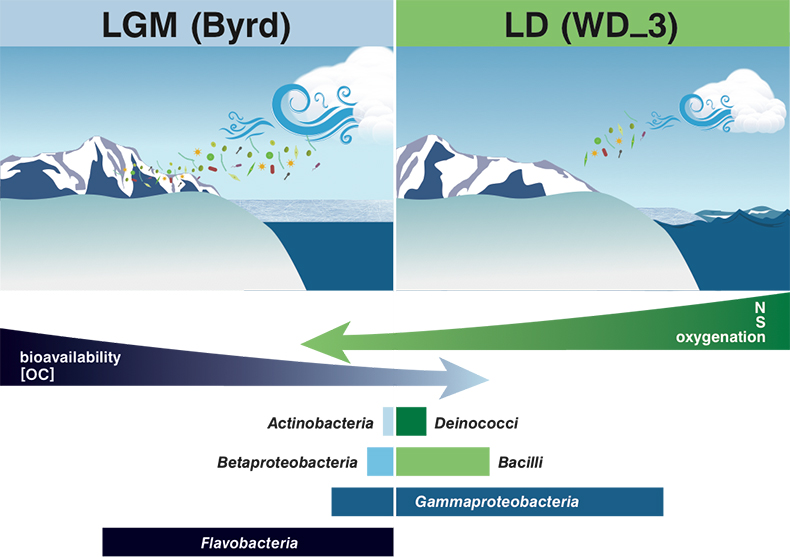
Figure 3 Schematic depicting Antarctic palaeoecological markers of organic carbon (OC) and microbial community structure from the Last Glacial Maximum (LGM) and last deglaciation (LD).
Back to article
Supplementary Figures and Tables
Table S-1 Volatile organic compounds, diesel range organics, and total extractable hydrocarbon concentrations for the inner ice core of Byrd and WAIS Divide deviation #3 (WD_3), and the outer shavings removed during decontamination procedures of the WD_3 ice core. Environmental Protection Agency (EPA) detection methods were used for contaminant analyses.
| Volatile Organics and Contaminants | EPA | Byrd | WD_3 | WD_3 |
| Method | (inner core) | (inner core) | (outer shavings) | |
| Volatile Organic Compounds (VOCs) | SW8260B | 0.00061 mg/L | 0.017 mg/L | 0.9 mg/L |
| (1,1-Dichloro-1-fluoroethane) | ||||
| Diesel Range Organics (DROs) | SW8015M | ND | ND | 7.7 mg/L |
| RL = 0.24 mg/L | RL = 0.31 mg/L | |||
| Total Extractable Hydrocarbons | SW8015M | ND | ND | 7.9 mg/L |
| RL = 0.24 mg/L | RL = 0.31 mg/L |
RL: Analyte reporting limit
ND: Not detected
Table S-2 Antarctic ice core location, approximate ages, climate descriptions and concentrations of organic carbon (OC), bacteria, Cl-, NO3-, PO43-, and SO42- (± 1 SD) for Byrd Research Station and the WAIS Divide deviation #3 (WD_3) ice core samples of the Last Glacial Maximum (LGM) and the last deglaciation (LD) climate periods.
| Age | Climate | OC | Bacteria | Cl- | NO3- | PO43- | SO42- | |
| Ice Core Sample | (ka BP 1950) | Period | (µM) | (105 cells/mL) | (µM) | (µM) | (µM) | (µM) |
| Byrd | 20.458 | LGM | 445 (±5.3) | 1.92 (±0.13) | 2.90 (±0.07) | 5.16 (±0.16) | 2.77 (±2.08) | 8.08 (±4.18) |
| WD_3 | 14.528 | LD | 11.8 (±0.29) | 0.13 (±0.03) | 1.95 (±0.07) | 0.156 (±0.020) | ND | 1.01 (±0.08) |
ND = Below detection limit
Back to article | Download in ExcelTable S-3 Molecular composition of CcHhNnOoSs containing organic matter from Byrd Research Station and WAIS Divide deviation #3 (WD_3) ice core sections determined by negative ion electrospray ionisation 9.4 tesla Fourier transform ion cyclotron resonance mass spectrometry.
| Byrd | WD_3 | |
| Molecular Species | (%) | (%) |
| CHO | 63.1 | 74.4 |
| CHOS1 | 22.6 | 19.3 |
| CHON1 | 2.4 | 1.6 |
| CHON1S1 | 2.4 | 1.33 |
| CHON2 | 6.51 | 2.26 |
| CHON2S1 | 2.91 | 1.13 |
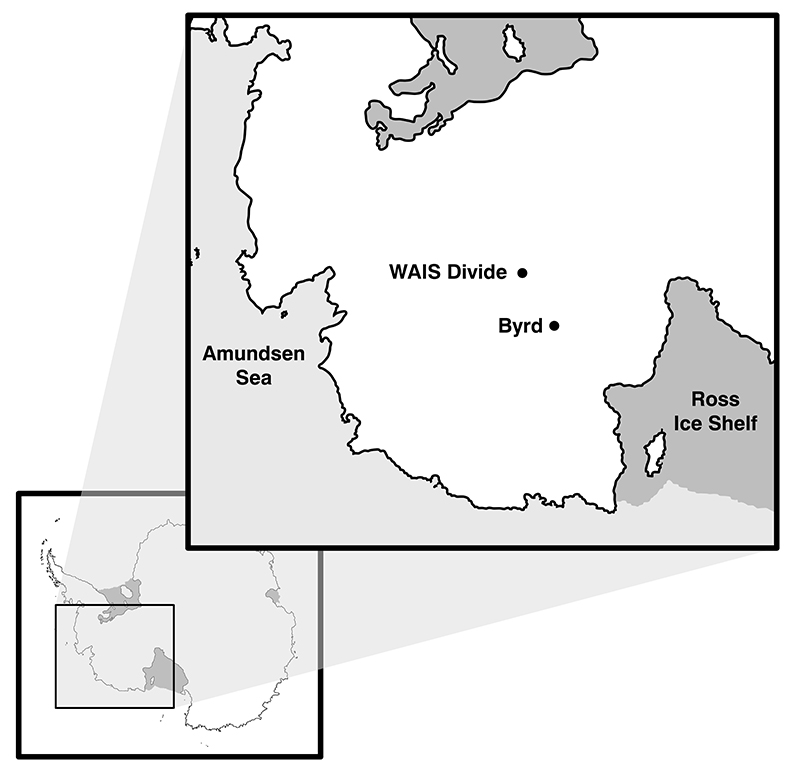
Figure S-1 Geographical location of the Byrd and WAIS Divide drilling sites.

Figure S-2 H/C and O/C molecular formulae of organic matter (OM) characterised in the WAIS Divide deviation #3 (WD_3) and Byrd Antarctic ice core OM sections, highlighting the degree of overlap, and exact composition matches between both samples on a van Krevelen diagram. Chemically labile OM (easily altered) is shown as a function of hydrogen saturation.
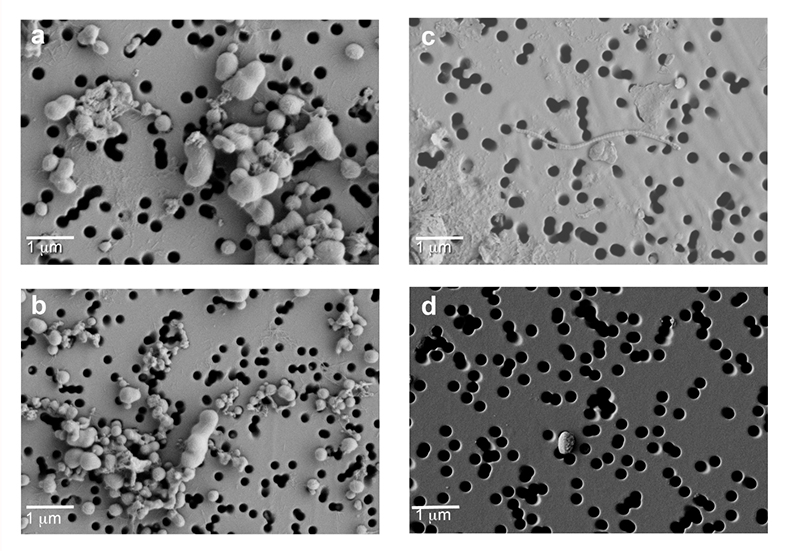
Figure S-3 Field emission scanning electron microscopy (FESEM) images from (a-b) WAIS Divide deviation #3 (WD_3) and (c-d) Byrd Antarctic ice core sections. Scale bar is 1 µm.


