The gravitas of gravitational isotope fractionation revealed in an isolated aquifer
Affiliations | Corresponding Author | Cite as | Funding informationKeywords: gravitational settling, chlorine, bromine, stable isotopes, sedimentary aquifers, residence-time
- Share this article


Article views:8,023Cumulative count of HTML views and PDF downloads.
- Download Citation
- Rights & Permissions
top
Abstract
Craig, H., Horibe, Y., Sowers, T. (1988) Gravitational separation of gases and isotopes in polar ice caps. Science 242, 1675–1678.
; Severinghaus et al., 1996Severinghaus, J.P., Bender, M.L., Keeling, R.F., Broecker, W.S. (1996) Fractionation of soil gases by diffusion of water vapor, gravitational settling, and thermal diffusion. Geochimica et Cosmochimica Acta 60, 1005–1018.
, 1998Severinghaus, J.P., Sowers, T., Brook, E.J., Alley, R.B., Bender, M.L. (1998) Timing of abrupt climate change at the end of the Younger Dryas interval from thermally fractionated gases in polar ice. Nature 391, 141–146.
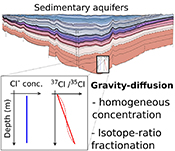
). Yet, in a motionless and chemically homogeneous water column, dissolved isotopic substances must be distributed according to their masses. Here we report the first resolvable isotopic variations resulting from gravitational effects on solutes, identified on dissolved chloride (Cl-) and bromide (Br-) in a sedimentary aquifer from the Illinois Basin (USA). We show that the correlations between depth and both 37Cl/35Cl and 81Br/79Br – varying by 1.1 ‰ and 1.6 ‰ respectively – reflect the evolution toward a gravity-diffusion equilibrium of porewater in the sediment column. This observation reveals that these deep groundwaters have been mostly stagnant for at least 20 Myr, possibly up to 300 Myr. As chloride and bromide are often conservative in groundwater systems, we highlight their essential role in unravelling the hydrodynamics and residence times of isolated aquifers. Furthermore, this study reveals gravitational fractionation as a viable process, potentially affecting other isotopic systems in various geological settings.Figures and Tables
 Table 1 Porewaters sampled at nine discrete depths within the MSS from a single, multi-level observation well. All data except the δ37Cl and δ81Br were measured at the ISGS (Panno et al., 2013; Labotka et al., 2015). δ37Cl and δ81Br were measured at IPGP. Errors are reported in 2σ. | 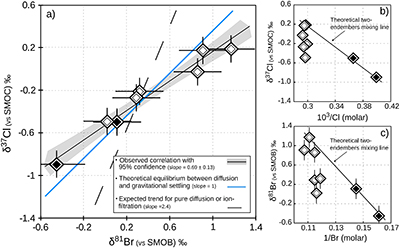 Figure 1 Isotope ratios and concentrations co-variations in the Upper (black diamonds) and in the Lower units (white diamonds). δ37Cl and δ81Br are apparently linearly correlated (R2 = 0.95) throughout the MSS (a). This linear correlation cannot be attributed to mixing between the Upper and Lower porewaters given the absence of inverse correlation with concentrations (b,c). Instead, this correlation is explained by gravitational settling affecting both systems. Errors are 2σ. | 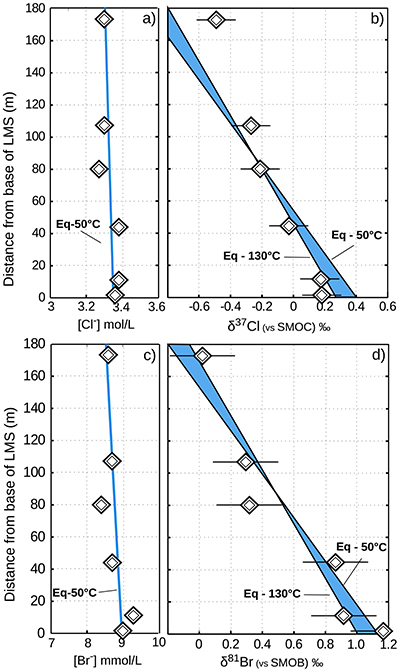 Figure 2 The gravitation-diffusion equilibrium slope dependence on temperature. When z is sufficiently small, Eq. 1 might be simplified to a first order approximation such that | 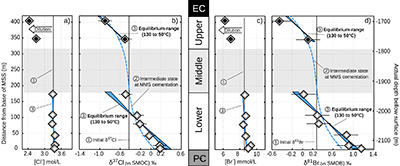 Figure 3 Concentrations and isotopic distributions for Cl (a,b) and for Br (c,d) reported with depth in the MSS. EC is the Eau-Claire Shale and PC is the Precambrian basement. We hypothesise the following scenario: 1) An all homogeneous (in concentrations and in isotope compositions) motionless fluid in the MSS (thin black line). 2) The cementation of the Middle unit occurred relatively rapidly, before equilibrium is reached throughout the entire MSS (dashed line). 3) Disconnected Upper and Lower aquifers then separately pursue their evolution toward equilibrium (blue shaded areas). The concentration decrease in the Upper unit (a,c) is then resulting from a dilution event (as proposed by Panno et al., 2013) which must have occurred after stage (2). |
| Table 1 | Figure 1 | Figure 2 | Figure 3 |
Supplementary Figures and Tables
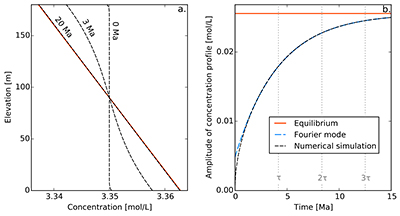 Figure S-1 Gravity settling of chlorine in a still aquifer. (a) Evolution of the concentration profile. (b) Relaxation of the amplitude of the concentration profile C(z = 0) − C(z = h). Equilibrium corresponds to Eq. S-4, Fourier mode to Eq. S-19, and numerical simulations to Eq. S-11. Parameters estimated for the LMS aquifer (Table S-1). |  Table S-1 Quantities used in A.4. Brackets indicate typical range. |  Table S-2 This Table is similar to the one presented in the main text (Table 1). In addition we added the Cl and Br concentrations and isotopic compositions measured in the Ironton-Galesville Sandstone, the Cambrian formation covering the Eau-Claire Shale. Isotopic data are reported versus Standard Mean Oceanic Chloride and Bromide, respectively. Error is 2σ. |  Figure S-2 The Illinois Basin (bright coloured) and the different geological structures surrounding it. Decatur is the location chosen for the CO2 sequestration project and is therefore the location of the multi-level observation borehole where porewaters were sampled. (b) Geological cross section of the Illinois Basin between A and A’. The Mount Simon Formation corresponds to the deepest strata of the Cambrian units. Figures modified after Panno et al. (2013). |  Figure S-3 Stratigraphic column from the igneous basement to the Ironton-Galesville Sandstone and the approximate depth for each different unit. Red circles indicate the depth at which porewaters were sampled in the course of the Decatur Project. Figure modified after Labotka et al. (2015). |  Figure S-4 White diamonds are referring to samples from the Lower Mount Simon (LMS), black diamonds are referring to the samples from the Upper Mount Simon (UMS) and grey circles are referring to IG. We reported the isotopic compositions versus the inverse of the concentrations. Here we also plotted the data for the Ironton-Galesville formation, in order to show that Ironton-Galesville brines cannot neither be associated to any possible mixing with any of the units from the Mount Simon Sandstone. |
| Figure S-1 | Table S-1 | Table S-2 | Figure S-2 | Figure S-3 | Figure S-4 |
top
Letter
With the growing need to sequester anthropogenic material (CO2 and nuclear waste) in stable geological formations, the characterisation of hydrodynamics and residence time of deep groundwaters is a first order societal challenge. In order to demonstrate the sustainability of sequestration sites on long timescales, it is crucial to justify that fluid movement and/or mixing with other reservoirs are limited. Long residence time groundwaters revealed by the accumulation of radiogenic noble gases suggest that some aquifers in sedimentary basins remained isolated for millions of years (Marty et al., 2003
Marty, B., Dewonck, S., France-Lanord, C. (2003) Geochemical evidence for efficient aquifer isolation over geological timeframes. Nature 425, 55–58.
; Clark et al., 2013Clark, I.D., Al, T., Jensen, M., Kennell, L., Mazurek, M., Mohapatra, R., Raven, K.G. (2013) Paleozoic-aged brine and authigenic helium preserved in an Ordovician shale aquiclude. Geology 41, 951–954.
), or even billions of years in deeper fracture-controlled systems in crystalline bedrock (Holland et al., 2013Holland, G., Sherwood Lollar, B., Li, L., Lacrampe-Couloume, G., Slater, G.F., Ballentine, C.J. (2013) Deep fracture fluids isolated in the crust since the Precambrian era. Nature 497, 357–360.
). However, the accuracy of this technique depends on the estimation of crucial parameters such as the average porosity, the content of radioactive elements (U, Th and K) within host rocks, as well as assuming a closed system (Lippmann et al., 2003Lippmann, J., Stute, M., Torgersen, T., Moser, D.P., Hall, J.A., Lin, L., Onstott, T.C. (2003) Dating ultra-deep mine waters with noble gases and 36 Cl, Witwatersrand Basin, South Africa. Geochimica et Cosmochimica Acta 67, 4597–4619.
). Unfortunately, these parameters are often poorly constrained. Here we expand upon the largely ignored historic concept of solute gravitational settling within a static water column (Russell et al., 1933Russell, W.L. (1933) Subsurface concentration of chloride brines. AAPG Bulletin 17, 1213–1228.
) and present the first evidence that isotopic ratios can be affected by this process, providing a new tool to constrain the degree and timing of isolation for sedimentary aquifers.If fluids within an aquifer are sufficiently isolated to become effectively motionless (i.e. no net advective component), the transport of solutes will be dominated by diffusion, but the Earth's gravitational field would prevent complete homogenisation of solute concentrations by tending to concentrate solute species downward. At equilibrium, the vertical distribution of a solute concentration Ci reaches a Boltzmann distribution such as Ci ∝ e-EiRT where R is the ideal gas constant, T is the temperature (°K) and Ei is the gravitational potential energy corrected for buoyancy expressed as Ei = (Mi – ρV̄i)gz (Pytkowicz, 1963
Pytkowicz, R. (1963) Gravity and the properties of sea water. Limnology and Oceanography 8, 286–287.
), where Mi is the molar mass (kg mol-1), ρ is the density of the fluid, V̄i is the partial molar volume (m3 mol-1), g is the acceleration of the Earth's gravitational field (m s-2), and z is the depth (m). The potential effects of gravitation on solute distribution have been previously explored to determine if it could influence seawater salinity distribution (Pytkowicz, 1963Pytkowicz, R. (1963) Gravity and the properties of sea water. Limnology and Oceanography 8, 286–287.
) or the salinity enrichment with depth (Mangelsdorf et al., 1970Mangelsdorf, P.C., Manheim, F.T., Gieskes, J.M.T.M. (1970) Role of gravity, temperature gradients, and ion-exchange media in formation of fossil brines. AAPG Bulletin 54, 617–626.
) often observed in sedimentary basins (e.g., Kharaka and Hanor, 2003Kharaka, Y.K., Hanor, J.S. (2003) Deep fluids in the continents: I. Sedimentary basins. Treatise on Geochemistry 5, 605.
). However, all these studies concluded that the effect on solute concentrations must be too minor to be detected, with for instance the equilibrium distribution of chloride (Cl-) resulting (see Supplementary Information) in a ~0.5 % concentration enrichment per 100-metres at 25 °C (i.e. within the typical 3–5 % analytical error on the determination of Cl concentrations).Yet, the same reasoning also predicts that isotope ratios should be fractionated according to their mass. Here, we propose that isotope ratio measurements, for which the sensitivity is much better than that for solute concentrations, should allow identification of a gravitational distribution. Such evidence arises when writing the equilibrium distribution for an isotopic ratio Ri = CH/CL, which also has a Boltzmann distribution Ri ∝ e-∆Ei/RT, where ∆Ei is the difference of gravitational potential energy between two isotopic substances of masses MH (heavy isotope) and ML (light isotope). Since the difference in partial molar volume between two isotopes is negligible, the relative per mille enrichment of the isotopic ratio ΔRi(z) as function of depth reads:
Eq. 1

Accordingly, the ratio between two isotopes of two-neutron mass difference, such as the stable isotopes of chlorine (37Cl/35Cl) or bromine (81Br/79Br), should be enriched by ~0.78 ‰ per 100 metres at 25 °C. This is significantly above the analytical uncertainties on δ37Cl or δ81Br measurements, respectively of ±0.10 ‰ (Godon et al., 2004
Godon, A., Jendrzejewski, N., Eggenkamp, H.G., Banks, D.A., Ader, M., Coleman, M.L., Pineau, F. (2004) A cross-calibration of chlorine isotopic measurements and suitability of seawater as the international reference material. Chemical Geology 207, 1–12.
; Giunta et al., 2015Giunta, T., Ader, M., Bonifacie, M., Agrinier, P., Coleman, M. (2015) Pre-concentration of chloride in dilute water-samples for precise δ37Cl determination using a strong ion-exchange resin: Application to rainwaters. Chemical Geology 413, 86–93.
) and ±0.24 ‰ (Louvat et al., 2016Louvat, P., Bonifacie, M., Giunta, T., Michel, A., Coleman, M. (2016) Determination of bromine stable isotope ratios from saline solutions by “wet plasma” MC-ICPMS including a comparison between high-and low-resolution modes, and three introduction systems. Analytical Chemistry 88, 3891–3898.
), for 2σ. To identify such fractionation in a sedimentary aquifer therefore requires a high resolution multi-level sampling of the porewater column.The Cambrian age Mount Simon Sandstone (MSS), a highly saline (TDS > 150 g/L) Na-Ca-Cl type aquifer, was chosen by the Illinois State Geological Survey as the injection reservoir for a large scale CO2 sequestration demonstration project. The MSS is dominantly composed of quartz, with three main lithostratigraphic units (Freiburg et al., 2014
Freiburg, J.T., Morse, D.G., Leetaru, H.E., Hoss, R.P., Yan, Q. (2014) A Depositional and Diagenetic Characterization of the Mt. Simon Sandstone at the Illinois Basin-Decatur Project Carbon Capture and Storage Site, Decatur, Illinois, USA. Illinois State Geological Survey, Prairie Research Institute, University of Illinois. Circular 583.
): the Lower, Middle, and Upper units. The Middle unit is considered a low permeability (i.e. “tight”) zone because of the massive diagenetic quartz cementation that has filled its primary porosity and likely prevents hydrogeological connection between the Upper and the Lower units. Importantly, the MSS is confined between two very low permeability units, the crystalline Precambrian basement (below) and the Eau-Claire Shale (above). Porewaters were sampled through a single, multi-level observation well (Locke et al., 2013Locke, R.A., Larssen, D., Salden, W., Patterson, C., Kirksey, J., Iranmanesh, A., Wimmer, B., Krapac, I. (2013) Preinjection reservoir fluid characterization at a CCS demonstration site: Illinois Basin–Decatur Project, USA. Energy Procedia 37, 6424–6433.
) at two and six discrete depths in the Upper and Lower units, respectively (the low permeability of the Middle unit precluded sampling). While the Upper unit has been shown to have experienced minor dilution (Panno et al., 2013Panno, S.V., Hackley, K.C., Locke, R.A., Krapac, I.G., Wimmer, B., Iranmanesh, A., Kelly, W.R. (2013) Formation waters from Cambrian-age strata, Illinois Basin, USA: Constraints on their origin and evolution. Geochimica et Cosmochimica Acta 122, 184–197.
; Labotka et al., 2015Labotka, D.M., Panno, S.V., Locke, R.A., Freiburg, J.T. (2015) Isotopic and geochemical characterization of fossil brines of the Cambrian Mt. Simon Sandstone and Ironton–Galesville Formation from the Illinois Basin, USA. Geochimica et Cosmochimica Acta 165, 342–360.
), both Upper and Lower porewaters were recently interpreted as dominated by modified Cambrian seawater (Labotka et al., 2016Labotka, D.M., Panno, S.V., Locke, R.A. (2016) A sulfate conundrum: Dissolved sulfates of deep-saline brines and carbonate-associated sulfates. Geochimica et Cosmochimica Acta 190, 53–71.
), illustrating the long-standing isolation of these brines.In this set of porewater samples, δ37Cl and δ81Br are strongly correlated (Fig. 1a), and are both consistently increasing with depth, from -0.90 to +0.18 ‰ and from -0.45 to +1.17 ‰ (Table 1), respectively. The absence of correlation between concentrations and isotopic compositions for both Cl and Br (Fig. 1b,c) suggests that these vertical profiles do not reflect mixing relationships between the Upper and Lower unit porewaters, and that the observed δ37Cl-δ81Br correlation is rather inherited from a process conjointly affecting both isotopic compositions. Because the MSS is free from salt/evaporite deposits, these variations cannot result from salt dissolution. Nor can they result from processes such as pure diffusion (Eggenkamp and Coleman, 2009
Eggenkamp, H.G.M., Coleman, M.L. (2009) The effect of aqueous diffusion on the fractionation of chlorine and bromine stable isotopes.Geochimica et Cosmochimica Acta 73, 3539–3548.
) or ion filtration (i.e. electrolyte flow forced through a negatively charged membrane such as clay; see Phillips and Bentley, 1987Phillips, F.M., Bentley, H.W. (1987) Isotopic fractionation during ion filtration: I. Theory. Geochimica et Cosmochimica Acta 51, 683–695.
) because of (i) the rather homogeneous Cl- and Br- concentration profiles – while both diffusion and ion filtration should conjointly affect isotopes and concentrations; and (ii) the wider variations of δ81Br, expected to be less fractionated than δ37Cl because of the smaller relative mass difference of bromine isotopes.In contrast, these large isotopic variations are associated with remarkably homogenous concentrations and salinities in each of the considered units (only 3 % variations in the Lower unit). This observation, together with the relatively good agreement between the observed δ37Cl-δ81Br regression slope and the theoretical slope predicted for equilibrium between diffusion and gravitation (Fig. 1a), are thus supporting the idea of a long term vertical immobility of the MSS porewaters.
Table 1 Porewaters sampled at nine discrete depths within the MSS from a single, multi-level observation well. All data except the δ37Cl and δ81Br were measured at the ISGS (Panno et al., 2013
Panno, S.V., Hackley, K.C., Locke, R.A., Krapac, I.G., Wimmer, B., Iranmanesh, A., Kelly, W.R. (2013) Formation waters from Cambrian-age strata, Illinois Basin, USA: Constraints on their origin and evolution. Geochimica et Cosmochimica Acta 122, 184–197.
; Labotka et al., 2015Labotka, D.M., Panno, S.V., Locke, R.A., Freiburg, J.T. (2015) Isotopic and geochemical characterization of fossil brines of the Cambrian Mt. Simon Sandstone and Ironton–Galesville Formation from the Illinois Basin, USA. Geochimica et Cosmochimica Acta 165, 342–360.
). δ37Cl and δ81Br were measured at IPGP. Errors are reported in 2σ.| Sample | Depth (m) | T (°C) | TDS (g/L) | [Cl-] mmol/L | [Br-] mmol/L | Cl/Br | δ18O–SMOW (±0.6) ‰ | δD–SMOW (±4.0) ‰ | δ37Cl–SMOC (±0.10) ‰ | δ81Br–SMOB (±0.24) ‰ | |
| Upper Mt. Simon | |||||||||||
| VWS 9 | -1714 | 46 | 150.8 | 2504 | 6.2 | 404 | -4.9 | -32 | -0.90 | -0.45 | |
| VWS 8 | -1770 | 48 | 172.9 | 2732 | 6.9 | 396 | -5 | -34 | -0.50 | 0.11 | |
| Lower Mt. Simon | |||||||||||
| VWS 7 | -1944 | 50 | 203.8 | 3371 | 8.6 | 392 | -3.8 | -25 | -0.49 | 0.02 | |
| VWS 6 | -2010 | 51 | 205.3 | 3397 | 8.7 | 390 | -3.6 | -25 | -0.27 | 0.29 | |
| VWS 5 | -2036 | 48 | 203 | 3341 | 8.4 | 398 | -2.9 | -23 | -0.21 | 0.32 | |
| VWS 4 | -2072 | 48 | 205.5 | 3414 | 8.7 | 392 | -2.8 | -22 | -0.03 | 0.86 | |
| VWS 3 | -2105 | 50 | 207.3 | 3384 | 9.3 | 364 | -2.9 | -23 | 0.18 | 0.91 | |
| VWS 2 | -2116 | 50 | 208.5 | 3362 | 9 | 374 | -3 | -24 | 0.18 | 1.17 | |

Figure 1 Isotope ratios and concentrations co-variations in the Upper (black diamonds) and in the Lower units (white diamonds). δ37Cl and δ81Br are apparently linearly correlated (R2 = 0.95) throughout the MSS (a). This linear correlation cannot be attributed to mixing between the Upper and Lower porewaters given the absence of inverse correlation with concentrations (b,c). Instead, this correlation is explained by gravitational settling affecting both systems. Errors are 2σ.
In the Lower unit, δ37Cl and δ81Br are respectively enriched by +0.67 ‰ and +1.15 ‰. Given the thickness of the sediment column (~180 m), these variations are typically within the equilibrium range for temperatures between 50 °C (current temperature of the aquifer) and 130 °C (maximal cementation temperature; Fishman, 1997
Fishman, N.S. (1997) Basin-wide fluid movement in a Cambrian paleoaquifer: evidence from the Mt. Simon Sandstone, Illinois and Indiana. In: Montañez, I.P., Gregg, J.M., Shelton, K.L. (Eds.) Basin-Wide Diagenetic Patterns. SEPM Special Publications 57, 231–234.
; Pollington et al., 2011Pollington, A.D., Kozdon, R., Valley, J.W. (2011) Evolution of quartz cementation during burial of the Cambrian Mount Simon Sandstone, Illinois Basin: In situ microanalysis of δ18O. Geology 39, 1119–1122.
) – see Figure 2. It is unclear yet why the uppermost sample (VWS7) has a δ37Cl (-0.49 ‰) that is not fitting the expected range, but we speculate that it could indicate that chloride has not fully reached equilibrium yet. Such equilibrium is established after t ≈ 5τ, where the characteristic time (τ) is defined analytically as (details in Supplementary Information):Eq. 2

with h is the height of the water-column and D is the effective diffusion coefficient (accounting for the effects of ionic composition and of tortuosity – see Supplementary Information). As a first order estimation, using h = 180 m and D = 2.5 x 10⁻¹¹ m2 s-1 (effective diffusion coefficient in a sandstone similar to the one in Al et al. (2015)
Al, T.A., Clark, I.D., Kennell, L., Jensen, M., Raven, K.G. (2015) Geochemical evolution and residence time of porewater in low-permeability rocks of the Michigan Basin, Southwest Ontario. Chemical Geology 404, 1–17.
, corresponding to a low-end tortuosity factor of ~3, see Supplementary Information for details), we calculate a characteristic time of 4.2 Myr. This means that the gravity-diffusion equilibrium should be fully established in the Lower unit after ~20 Myr (i.e. about five times the characteristic time). We recognise that the role of a complex electrolyte mixture on equilibrium dynamics is, as yet, poorly understood. For instance, while Cl- and Br- have almost identical self diffusion coefficients in water (Li and Gregory, 1974Li, Y., Gregory, S. (1974) Diffusion of ions in sea water and in deep-sea sediments. Geochimica et Ccosmochimica Acta 38, 703–714.
), because of NaCl or CaCl2 salt diffusion, they might have distinct diffusion coefficients (see Supplementary Information for additional details), yielding slightly different characteristic times according to Eq. 2.
Figure 2 The gravitation-diffusion equilibrium slope dependence on temperature. When z is sufficiently small, Eq. 1 might be simplified to a first order approximation such that
 where the enrichment of the isotopic ratio is therefore linearly correlated to depth. This approximation attests that for a given isotopic system, the slope of the equilibrium will only depend on the temperature. We report Cl- and Br- concentrations (a,c), as well as δ37Cl and δ81Br (b,d) from the Lower unit aquifer, together with equilibrium enrichment profiles calculated for temperatures of 50 °C (actual temperature of the formation) and of 130 °C (cementation temperature; though highest temperature reached during burial was probably closer to 150 °C). Given the scale of the concentration plots (a,c) 50 °C and 130 °C equilibrium profiles are not distinguishable. Error is 2σ.
The long term immobility of Lower unit porewaters is reinforced by observations of the Upper unit, where δ37Cl and δ81Br variations are also consistent with equilibrium profiles (see Fig. 3). Interestingly, while Upper and Lower unit porewaters are now separated by the highly cemented Middle unit, they share a similar and homogeneous Cl/Br ratio (388 ± 13), indicating that a single and relatively homogenous aquifer may have existed over the entire MSS. Overall, δ37Cl and δ81Br profiles would then support the idea of a whole MSS dynamic towards equilibrium (dashed line in Fig. 3), that was interrupted by the cementation of the Middle unit. Subsequently, the Upper and Lower unit porewaters evolved independently toward equilibrium (shaded area in Fig. 2). This model suggests that before cementation, the palaeo-aquifer had a δ37Cl close to -0.4 ‰, therefore in agreement with the evaporative origin (Eggenkamp et al., 2016
Eggenkamp, H.G.M., Bonifacie, M., Ader, M., Agrinier, P. (2016) Experimental determination of stable chlorine and bromine isotope fractionation during precipitation of salt from a saturated solution. Chemical Geology 433, 46–56.
) inferred from the low Cl/Br ratios (Panno et al., 2013Panno, S.V., Hackley, K.C., Locke, R.A., Krapac, I.G., Wimmer, B., Iranmanesh, A., Kelly, W.R. (2013) Formation waters from Cambrian-age strata, Illinois Basin, USA: Constraints on their origin and evolution. Geochimica et Cosmochimica Acta 122, 184–197.
). Fluid inclusion microthermometry and in situ δ18O analyses of authigenic quartz (Fishman, 1997Fishman, N.S. (1997) Basin-wide fluid movement in a Cambrian paleoaquifer: evidence from the Mt. Simon Sandstone, Illinois and Indiana. In: Montañez, I.P., Gregg, J.M., Shelton, K.L. (Eds.) Basin-Wide Diagenetic Patterns. SEPM Special Publications 57, 231–234.
; Pollington et al., 2011Pollington, A.D., Kozdon, R., Valley, J.W. (2011) Evolution of quartz cementation during burial of the Cambrian Mount Simon Sandstone, Illinois Basin: In situ microanalysis of δ18O. Geology 39, 1119–1122.
) both support a cementation temperature ranging between 100 and 130 °C in the presence of a brine with a salinity of ~20 % wt. equivalent NaCl (similar to present day salinity in Lower unit). This temperature range was reached at the maximum burial of the MSS, approximately 300 to 350 Myr ago (Fishman, 1997Fishman, N.S. (1997) Basin-wide fluid movement in a Cambrian paleoaquifer: evidence from the Mt. Simon Sandstone, Illinois and Indiana. In: Montañez, I.P., Gregg, J.M., Shelton, K.L. (Eds.) Basin-Wide Diagenetic Patterns. SEPM Special Publications 57, 231–234.
). According to this model, MSS porewaters were relatively static just before the significant cementation event. We speculate that the Lower unit, and to a certain extent the Upper unit (if we exclude the later dilution event), have been reasonably stagnant and isolated since then. These conclusions are consistent with the Cambrian age origin of these fluids (Labotka et al., 2016Labotka, D.M., Panno, S.V., Locke, R.A. (2016) A sulfate conundrum: Dissolved sulfates of deep-saline brines and carbonate-associated sulfates. Geochimica et Cosmochimica Acta 190, 53–71.
) and add further support for the continued use of the MSS as CO2 sequestration reservoir.
Figure 3 Concentrations and isotopic distributions for Cl (a,b) and for Br (c,d) reported with depth in the MSS. EC is the Eau-Claire Shale and PC is the Precambrian basement. We hypothesise the following scenario: 1) An all homogeneous (in concentrations and in isotope compositions) motionless fluid in the MSS (thin black line). 2) The cementation of the Middle unit occurred relatively rapidly, before equilibrium is reached throughout the entire MSS (dashed line). 3) Disconnected Upper and Lower aquifers then separately pursue their evolution toward equilibrium (blue shaded areas). The concentration decrease in the Upper unit (a,c) is then resulting from a dilution event (as proposed by Panno et al., 2013) which must have occurred after stage (2).
Our study highlights the effect of gravitational settling on isotope distributions in a deep sedimentary formation, revising our fundamental understanding of the complex dynamics and residence time in continental groundwater systems. As a consequence, future studies on crustal aquifers should consider its potential fingerprint on isotope ratios for which the analytical precision is better than the minimum variation expected (i.e. calculated with Eq. 1) and employ a multi-level sampling approach where possible. Where fluid systems are isolated over sufficient periods of time, isotope gravitational settling could be observed. This opens the intriguing possibility that gravitational settling occurs within a wide variety of geological fluids, spanning a wide range of magnitudes.
top
Acknowledgements
Authors wish to thank Editor Eric Oelkers as well as Ian Bourg and an anonymous reviewer for commenting on this manuscript. Authors also wish to thank P. Cartigny, B. Sherwood Lollar, J.P. Girard, S. Panno and D. Labotka for stimulating exchanges. T.G. thanks J. Labidi, O. Warr, A. Roman and T. Kremer. This work was funded by the ANR CO2FIX (ANR-08-PCO2-003-03) and the IPGP/Ademe/Schlumberger/Total CO2 geological storage program. This is IPGP contribution n° 3873.
Editor: Eric H. Oelkers
top
References
Al, T.A., Clark, I.D., Kennell, L., Jensen, M., Raven, K.G. (2015) Geochemical evolution and residence time of porewater in low-permeability rocks of the Michigan Basin, Southwest Ontario. Chemical Geology 404, 1–17.
 Show in context
As a first order estimation, using h = 180 m and D = 2.5 x 10⁻¹¹ m2 s-1 (effective diffusion coefficient in a sandstone similar to the one in Al et al. (2015), corresponding to a low-end tortuosity factor of ~3, see Supplementary Information for details), we calculate a characteristic time of 4.2 Myr.
View in article
Clark, I.D., Al, T., Jensen, M., Kennell, L., Mazurek, M., Mohapatra, R., Raven, K.G. (2013) Paleozoic-aged brine and authigenic helium preserved in an Ordovician shale aquiclude. Geology 41, 951–954.
 Show in context
 Long residence time groundwaters revealed by the accumulation of radiogenic noble gases suggest that some aquifers in sedimentary basins remained isolated for millions of years (Marty et al., 2003; Clark et al., 2013), or even billions of years in deeper fracture-controlled systems in crystalline bedrock (Holland et al., 2013).
View in article
Craig, H., Horibe, Y., Sowers, T. (1988) Gravitational separation of gases and isotopes in polar ice caps. Science 242, 1675–1678.
 Show in context
 Despite the ubiquitous effects of gravitation on Earth, its potential influence on relative distribution of isotopic substances has remained elusive – and so far only identified in confined gaseous systems (Craig et al., 1988; Severinghaus et al., 1996, 1998).
View in article
Eggenkamp, H.G.M., Coleman, M.L. (2009) The effect of aqueous diffusion on the fractionation of chlorine and bromine stable isotopes.Geochimica et Cosmochimica Acta 73, 3539–3548.
 Show in context
 Nor can they result from processes such as pure diffusion (Eggenkamp and Coleman, 2009) or ion filtration (i.e. electrolyte flow forced through a negatively charged membrane such as clay; see Phillips and Bentley, 1987) because of (i) the rather homogeneous Cl- and Br- concentration profiles – while both diffusion and ion filtration should conjointly affect isotopes and concentrations; and (ii) the wider variations of δ81Br, expected to be less fractionated than δ37Cl because of the smaller relative mass difference of bromine isotopes.
View in article
Eggenkamp, H.G.M., Bonifacie, M., Ader, M., Agrinier, P. (2016) Experimental determination of stable chlorine and bromine isotope fractionation during precipitation of salt from a saturated solution. Chemical Geology 433, 46–56.
 Show in context
 This model suggests that before cementation, the palaeo-aquifer had a δ37Cl close to -0.4 ‰, therefore in agreement (Eggenkamp et al., 2016) with the evaporative origin inferred from the low Cl/Br ratios (Panno et al., 2013).
View in article
Fishman, N.S. (1997) Basin-wide fluid movement in a Cambrian paleoaquifer: evidence from the Mt. Simon Sandstone, Illinois and Indiana. In: Montañez, I.P., Gregg, J.M., Shelton, K.L. (Eds.) Basin-Wide Diagenetic Patterns. SEPM Special Publications 57, 231–234.
 Show in context
Given the thickness of the sediment column (~180 m), these variations are typically within the equilibrium range for temperatures between 50 °C (current temperature of the aquifer) and 130 °C (maximal cementation temperature; Fishman, 1997; Pollington et al., 2011) – see Figure 2.
View in article
Fluid inclusion microthermometry and in situ δ18O analyses of authigenic quartz (Fishman, 1997; Pollington et al., 2011) both support a cementation temperature ranging between 100 and 130 °C in the presence of a brine with a salinity of ~20 % wt. equivalent NaCl (similar to present day salinity in Lower unit).
View in article
This temperature range was reached at the maximum burial of the MSS, approximately 300 to 350 Myr ago (Fishman, 1997).
View in article
Freiburg, J.T., Morse, D.G., Leetaru, H.E., Hoss, R.P., Yan, Q. (2014) A Depositional and Diagenetic Characterization of the Mt. Simon Sandstone at the Illinois Basin-Decatur Project Carbon Capture and Storage Site, Decatur, Illinois, USA. Illinois State Geological Survey, Prairie Research Institute, University of Illinois. Circular 583.
 Show in context
 The MSS is dominantly composed of quartz, with three main lithostratigraphic units (Freiburg et al., 2014): the Lower, Middle, and Upper units.
View in article
Giunta, T., Ader, M., Bonifacie, M., Agrinier, P., Coleman, M. (2015) Pre-concentration of chloride in dilute water-samples for precise δ37Cl determination using a strong ion-exchange resin: Application to rainwaters. Chemical Geology 413, 86–93.
 Show in context
 This is significantly above the analytical uncertainties on δ37Cl or δ81Br measurements, respectively of ±0.10 ‰ (Godon et al., 2004; Giunta et al., 2015) and ±0.24 ‰ (Louvat et al., 2016), for 2σ.
View in article
Godon, A., Jendrzejewski, N., Eggenkamp, H.G., Banks, D.A., Ader, M., Coleman, M.L., Pineau, F. (2004) A cross-calibration of chlorine isotopic measurements and suitability of seawater as the international reference material. Chemical Geology 207, 1–12.
 Show in context
 This is significantly above the analytical uncertainties on δ37Cl or δ81Br measurements, respectively of ±0.10 ‰ (Godon et al., 2004; Giunta et al., 2015) and ±0.24 ‰ (Louvat et al., 2016), for 2σ.
View in article
Holland, G., Sherwood Lollar, B., Li, L., Lacrampe-Couloume, G., Slater, G.F., Ballentine, C.J. (2013) Deep fracture fluids isolated in the crust since the Precambrian era. Nature 497, 357–360.
 Show in context
 Long residence time groundwaters revealed by the accumulation of radiogenic noble gases suggest that some aquifers in sedimentary basins remained isolated for millions of years (Marty et al., 2003; Clark et al., 2013), or even billions of years in deeper fracture-controlled systems in crystalline bedrock (Holland et al., 2013).
View in article
Kharaka, Y.K., Hanor, J.S. (2003) Deep fluids in the continents: I. Sedimentary basins. Treatise on Geochemistry 5, 605.
 Show in context
 The potential effects of gravitation on solute distribution have been previously explored to determine if it could influence seawater salinity distribution (Pytkowicz, 1963) or the salinity enrichment with depth (Mangelsdorf et al., 1970) often observed in sedimentary basins (Kharaka and Hanor, 2003).
View in article
Labotka, D.M., Panno, S.V., Locke, R.A., Freiburg, J.T. (2015) Isotopic and geochemical characterization of fossil brines of the Cambrian Mt. Simon Sandstone and Ironton–Galesville Formation from the Illinois Basin, USA. Geochimica et Cosmochimica Acta 165, 342–360.
 Show in context
 While the Upper unit has been shown to have experienced minor dilution (Panno et al., 2013; Labotka et al., 2015), both Upper and Lower porewaters were recently interpreted as dominated by modified Cambrian seawater (Labotka et al., 2016), illustrating the long-standing isolation of these brines.
View in article
Table 1 [...] All data except the δ37Cl and δ81Br were measured at the ISGS (Panno et al., 2013; Labotka et al., 2015).
View in article
Labotka, D.M., Panno, S.V., Locke, R.A. (2016) A sulfate conundrum: Dissolved sulfates of deep-saline brines and carbonate-associated sulfates. Geochimica et Cosmochimica Acta 190, 53–71.
 Show in context
While the Upper unit has been shown to have experienced minor dilution (Panno et al., 2013; Labotka et al., 2015), both Upper and Lower porewaters were recently interpreted as dominated by modified Cambrian seawater (Labotka et al., 2016), illustrating the long-standing isolation of these brines.
View in article
These conclusions are consistent with the Cambrian age origin of these fluids (Labotka et al., 2016) and add further support for the continued use of the MSS as CO2 sequestration reservoir.
View in article
Li, Y., Gregory, S. (1974) Diffusion of ions in sea water and in deep-sea sediments. Geochimica et Ccosmochimica Acta 38, 703–714.
 Show in context
 For instance, while Cl- and Br- have almost identical self diffusion coefficients in water (Li and Gregory, 1974), because of NaCl or CaCl2 salt diffusion, they might have distinct diffusion coefficients (see Supplementary Information for additional details), yielding slightly different characteristic times according to Eq. 2.
View in article
Lippmann, J., Stute, M., Torgersen, T., Moser, D.P., Hall, J.A., Lin, L., Onstott, T.C. (2003) Dating ultra-deep mine waters with noble gases and 36 Cl, Witwatersrand Basin, South Africa. Geochimica et Cosmochimica Acta 67, 4597–4619.
 Show in context
However, the accuracy of this technique depends on the estimation of crucial parameters such as the average porosity, the content of radioactive elements (U, Th and K) within host rocks, as well as assuming a closed system (Lippmann et al., 2003).
View in article
Locke, R.A., Larssen, D., Salden, W., Patterson, C., Kirksey, J., Iranmanesh, A., Wimmer, B., Krapac, I. (2013) Preinjection reservoir fluid characterization at a CCS demonstration site: Illinois Basin–Decatur Project, USA. Energy Procedia 37, 6424–6433.
 Show in context
 Porewaters were sampled through a single, multi-level observation well (Locke et al., 2013) at two and six discrete depths in the Upper and Lower units, respectively (the low permeability of the Middle unit precluded sampling).
View in article
Louvat, P., Bonifacie, M., Giunta, T., Michel, A., Coleman, M. (2016) Determination of bromine stable isotope ratios from saline solutions by “wet plasma” MC-ICPMS including a comparison between high-and low-resolution modes, and three introduction systems. Analytical Chemistry 88, 3891–3898.
 Show in context
 This is significantly above the analytical uncertainties on δ37Cl or δ81Br measurements, respectively of ±0.10 ‰ (Godon et al., 2004; Giunta et al., 2015) and ±0.24 ‰ (Louvat et al., 2016), for 2σ.
View in article
Mangelsdorf, P.C., Manheim, F.T., Gieskes, J.M.T.M. (1970) Role of gravity, temperature gradients, and ion-exchange media in formation of fossil brines. AAPG Bulletin 54, 617–626.
 Show in context
 The potential effects of gravitation on solute distribution have been previously explored to determine if it could influence seawater salinity distribution (Pytkowicz, 1963) or the salinity enrichment with depth (Mangelsdorf et al., 1970) often observed in sedimentary basins (Kharaka and Hanor, 2003).
View in article
Marty, B., Dewonck, S., France-Lanord, C. (2003) Geochemical evidence for efficient aquifer isolation over geological timeframes. Nature 425, 55–58.
 Show in context
Long residence time groundwaters revealed by the accumulation of radiogenic noble gases suggest that some aquifers in sedimentary basins remained isolated for millions of years (Marty et al., 2003; Clark et al., 2013), or even billions of years in deeper fracture-controlled systems in crystalline bedrock (Holland et al., 2013).
View in article
Panno, S.V., Hackley, K.C., Locke, R.A., Krapac, I.G., Wimmer, B., Iranmanesh, A., Kelly, W.R. (2013) Formation waters from Cambrian-age strata, Illinois Basin, USA: Constraints on their origin and evolution. Geochimica et Cosmochimica Acta 122, 184–197.
 Show in context
 While the Upper unit has been shown to have experienced minor dilution (Panno et al., 2013; Labotka et al., 2015), both Upper and Lower porewaters were recently interpreted as dominated by modified Cambrian seawater (Labotka et al., 2016), illustrating the long-standing isolation of these brines.
View in article
Table 1 [...] All data except the δ37Cl and δ81Br were measured at the ISGS (Panno et al., 2013; Labotka et al., 2015).
View in article
This model suggests that before cementation, the palaeo-aquifer had a δ37Cl close to -0.4 ‰, therefore in agreement (Eggenkamp et al., 2016) with the evaporative origin inferred from the low Cl/Br ratios (Panno et al., 2013).
View in article
Phillips, F.M., Bentley, H.W. (1987) Isotopic fractionation during ion filtration: I. Theory. Geochimica et Cosmochimica Acta 51, 683–695.
 Show in context
 Nor can they result from processes such as pure diffusion (Eggenkamp and Coleman, 2009) or ion filtration (i.e. electrolyte flow forced through a negatively charged membrane such as clay; see Phillips and Bentley, 1987) because of (i) the rather homogeneous Cl- and Br- concentration profiles – while both diffusion and ion filtration should conjointly affect isotopes and concentrations; and (ii) the wider variations of δ81Br, expected to be less fractionated than δ37Cl because of the smaller relative mass difference of bromine isotopes.
View in article
Pollington, A.D., Kozdon, R., Valley, J.W. (2011) Evolution of quartz cementation during burial of the Cambrian Mount Simon Sandstone, Illinois Basin: In situ microanalysis of δ18O. Geology 39, 1119–1122.
 Show in context
 Given the thickness of the sediment column (~180 m), these variations are typically within the equilibrium range for temperatures between 50 °C (current temperature of the aquifer) and 130 °C (maximal cementation temperature; Fishman, 1997; Pollington et al., 2011) – see Figure 2.
View in article
Fluid inclusion microthermometry and in situ δ18O analyses of authigenic quartz (Fishman, 1997; Pollington et al., 2011) both support a cementation temperature ranging between 100 and 130 °C in the presence of a brine with a salinity of ~20 % wt. equivalent NaCl (similar to present day salinity in Lower unit).
View in article
Pytkowicz, R. (1963) Gravity and the properties of sea water. Limnology and Oceanography 8, 286–287.
 Show in context
At equilibrium, the vertical distribution of a solute concentration Ci reaches a Boltzmann distribution such as Ci ∝ e-EiRT where R is the ideal gas constant, T is temperature (°K) and Ei is the gravitational potential energy corrected for buoyancy expressed as Ei = (Mi – ρV̄i)gz (Pytkowicz, 1963), where Mi is the molar mass (kg mol-1), ρ is the density of the fluid, V̄i is the partial molar volume (m3 mol-1), g is the acceleration of the Earth's gravitational field (m s-2), and z is the depth (m).
View in article
The potential effects of gravitation on solute distribution have been previously explored to determine if it could influence seawater salinity distribution (Pytkowicz, 1963) or the salinity enrichment with depth (Mangelsdorf et al., 1970) often observed in sedimentary basins (Kharaka and Hanor, 2003).
View in article
Russell, W.L. (1933) Subsurface concentration of chloride brines. AAPG Bulletin 17, 1213–1228.
 Show in context
Here we expand upon the largely ignored historic concept of solute gravitational settling within a static water column (Russell et al., 1933) and present the first evidence that isotopic ratios can be affected by it, providing a new tool to constrain the degree and timing of isolation for sedimentary aquifers.
View in article
Severinghaus, J.P., Bender, M.L., Keeling, R.F., Broecker, W.S. (1996) Fractionation of soil gases by diffusion of water vapor, gravitational settling, and thermal diffusion. Geochimica et Cosmochimica Acta 60, 1005–1018.
 Show in context
 Despite the ubiquitous effects of gravitation on Earth, its potential influence on relative distribution of isotopic substances has remained elusive – and so far only identified in confined gaseous systems (Craig et al., 1988; Severinghaus et al., 1996, 1998).
View in article
Severinghaus, J.P., Sowers, T., Brook, E.J., Alley, R.B., Bender, M.L. (1998) Timing of abrupt climate change at the end of the Younger Dryas interval from thermally fractionated gases in polar ice. Nature 391, 141–146.
 Show in context
 Despite the ubiquitous effects of gravitation on Earth, its potential influence on relative distribution of isotopic substances has remained elusive – and so far only identified in confined gaseous systems (Craig et al., 1988; Severinghaus et al., 1996, 1998).
View in article
top
Supplementary Information
A. Material and Methods
A.1 δ37Cl and δ81Br measurements
Chlorine stable isotope compositions were measured on CH3Cl gas in a dual-inlet gas source mass spectrometer (Thermo Delta plus XP, Finnigan at Institut de Physique du Globe de Paris). We followed the classical method described by Kaufmann et al. (1984); Long et al. (1993). Dissolved chloride (Cl-) is first precipitated as silver chloride (AgCl) and then reacted with CH3I to quantitatively produce a CH3Cl gas that is introduced in the mass spectrometer. Chlorine stable isotope variations are usually reported versus the Standard Mean Oceanic Chloride (SMOC), using the delta notation as follows: δ37Cl = [(37Cl/35Cl)samp/(37Cl/35Cl)SMOC − 1] x 1000, and are expressed in per mille. In the course of this study, the external reproducibility on a seawater international standard was better than ±0.1 ‰ (2σ, n = 25). Bromine stable isotope composition was measured following the method fully described in Louvat et al. (2016). Dissolved bromide (Br-) is extracted by ion exchange chromatography with NH4NO3 and is measured on a Neptune Plus Multicollector ICPMS in wet plasma conditions. Bromine stable isotope composition is usually reported versus the Standard Mean Oceanic Bromide (SMOB), using the delta notation as follows: δ81Br = [(81Br/79Br)samp/( 81Br/79Br)SMOB − 1] x 1000, and are expressed in per mille. In the course of this study, the external reproducibility on SMOB was better than ±0.24 ‰ (2σ, n = 20).
A.2 Salt-diffusion coefficients
In an electrolyte, ions adapt their diffusion coefficients to their co-diffusing ion so that the electroneutrality is always maintained. Thus if we consider a single electrolyte consisting of an anion (A) and a cation (C), both of them will adopt an identical diffusion coefficient D0AC called salt diffusion coefficient (also referred to as molecular diffusion coefficient) given by Robinson and Stokes (1959):
Eq. S-1

where D0A and D0C are the respective self diffusion coefficients of A and C, and ZA and ZC their respective charges. In the case of the Mount Simon brines, the self diffusion coefficient of Cl- (2 × 10⁻⁹ m2 s-1 at 25 °C) the dominant anion, is therefore decreased by the dominant co-diffusing cations Na+ and Ca2+ which both have lower self diffusion coefficients (respectively of 1.3 and 0.7 × 10⁻⁹ m2 s-1; Li and Gregory, 1974). Importantly, a trace element existing in a saline solution will tend to follow its self diffusion coefficient as the concentration of existing counter-ions are high enough in solution (Li and Gregory, 1974). This will be the case for Br- in the Mount Simon brines which should therefore diffuse as a solitary ion (2 × 10⁻⁹ m2 s-1 at 25 °C).
A.3 Effect of tortuosity
Diffusive transport through a porous media is always slower than in free water because of the effect of tortuosity (θ), an empirical parameter that corresponds to the relative increase of the path length induced by the pore geometry. For a given porous media, the mean hydraulic tortuosity is often determined through diffusion experiments, as the tortuosity relates to diffusion coefficients following Epstein (1989):
Eq. S-2

where D0i is the free water diffusion coefficient of a dissolved species i, Dei is the “effective” diffusion coefficient of this same species in the given porous media, and ϕ is the accessible porosity of the media. In a porous water column such as a sedimentary aquifer, the characteristic time to reach equilibrium should therefore be calculated (Eq. 2) by using the effective diffusion coefficient. Since no diffusion experiments have been conducted in rock cores from the Mount Simon Sandstone we defined the effective diffusion coefficient as D0i / Dei = 100. This reducing factor of 100 is consistent with the effective diffusion coefficient of chloride recently proposed for basal Cambrian sandstone in Southwest Ontario (Al et al. (2015)). Given the porosity of the Mount Simon (0.1–0.15), this effective diffusion coefficient would correspond to a tortuosity factor of ~3.
A.4 Dynamics of gravitational settling
In a still and homogeneous water column, molecular diffusion tends to distribute solutes evenly. The Earth’s gravitational field, on the other hand, concentrates species denser than the surrounding fluid in the lower part of the fluid. From that standpoint, a solute in an ideal water column is analogous to gas in the atmosphere, or to a heavy isotope in a centrifuge (Perrin, 1916). In this section, following (Pytkowicz, 1963; Mangelsdorf et al., 1970; Bons and Gomez-Rivas, 2013), we propose a simple model for the settling of isotopes in an aquifer, and use it to evaluate the characteristic time over which gravity induces a stratification of the isotopic ratio.
We first consider the statistical equilibrium of solutes in a water column, and express the associated stratification in terms of the Boltzmann distribution (see A.4.1). Next we consider the dynamics of gravity-induced settling in a homogeneous water column. The equilibrium distribution resulting from these dynamics, when compared to the Boltzmann distribution, relates the diffusion coefficient to the settling velocity of the solute (see A.4.3). We then propose to extend this reasoning to aquifers, and discuss the role of the matrix tortuosity on the dynamics of gravity-induced settling (see A.4.4). Finally, we use this theory to evaluate the characteristic settling time of isotopes in an aquifer.
A.4.1 Equilibrium distribution of a solute. In a still and homogeneous water column, and after a sufficiently long time, solutes reach statistical equilibrium. For most practical purposes, the equilibrium concentration C of a solute is simply uniform. However, external forces, such as gravity, impact the statistical equilibrium. Under the influence of such a force, the solute concentrates in areas of lower potential energy Ep, as expressed by the Boltzmann distribution. Accordingly, in a water column at equilibrium, the concentration of a solute reads:
Eq. S-3

where C0 is a normalisation constant, kB is the Boltzmann constant and T is the absolute temperature of the water column. In the Earth’s gravity field, the potential energy of a mole of solute is the product of its elevation z with the acceleration of gravity g, times its mass M corrected from the buoyancy induced by the surrounding water ρV̄, where ρ is the density of water and V̄ is the partial molar volume of the solute. Substituting in Eq. S-3, we find that the distribution of a solute at equilibrium is vertically stratified:
Eq. S-4

where NA is the Avogadro constant, and C0 a normalisation constant inherited from the initial solute distribution.
Equation S-4 corresponds to the thermal equilibrium of a solute. It does not depend on the shape of the domain over which the solution extends, provided it is entirely connected. In particular, it holds throughout the connected pores of an aquifer, provided the groundwater it contains has been still long enough. The pore structure of the aquifer matrix affects the dynamics of gravity-induced settling (see A.4.4), but it does not change the resulting equilibrium. Equation S-4 therefore holds in an isolated aquifer at equilibrium. The exponential stratification corresponding to Eq. S-4 defines a characteristic height hc over which the concentration decreases by a factor of about 3:
Eq. S-5

We find hc ≈ 20 km for chloride, and hc ≈ 5 km for bromide (Table S-1). Such large values make gravitational settling hardly visible for concentration measurements in aquifers. For instance, over the thickness of the Lower Mount Simon aquifer (h ≈ 180 m), the relative variation of chloride concentration would be h/hc ≈ 1 % at equilibrium (about 4 % for bromide). The precision of our concentration measurements do not allow us to identify gravity settling in the Mount Simon aquifer (Figs. 2 and 3 in the main text).
A.4.2 Distribution of isotopic ratio. When two stable isotopes coexist in the same water column, they settle independently in the gravity field until they reach thermal equilibrium. At this point, we expect the heavier isotope to be more concentrated near the aquifer’s bottom than its lighter counterpart. We thus anticipate the isotopic ratio to vary, albeit faintly, over the depth of an aquifer at equilibrium.
To estimate the impact of gravity-induced settling on the vertical distribution of an isotopic ratio, we simply evaluate the equilibrium distribution of each isotope using Eq. S-4, and calculate the corresponding isotopic ratio.
The partial molar volume corresponds to the contribution, per mol added of the species, to the overall volume of the solution. For a given species, this parameter depends on the temperature of the solution as well as on the nature of the electrolyte (other species present in solution and their respective concentrations) and is not trivial to define. Few studies have focused on differentiating partial molar volume between isotopic substances. Essentially, the volume of an atom/ionic species is defined by its electronic structure, which should not vary from an isotope to another. Hamann et al. (1984) have measured some isotopic volume increases in cubic crystals at 300 °K, during substitution of 6Li to 7Li (+0.017 × 10⁻⁶ m3 mol-1), of H to D (+0.14 × 10⁻⁶ m3 mol-1) or of 32S to 34S (+0.0013 × 10⁻⁶ m3 mol-1). These variations of volume, although they were not determined for liquid solutions, are extremely small and are therefore not likely to result in significant changes of partial molar volume between the isotopes of chloride (21.6 × 10⁻⁶ m3 mol-1) or bromide (28.5 × 10⁻⁶ m3 mol-1) (Durchschlag and Zipper, 1994).
Assuming that two isotopes have the same partial molar volume, we find:
Eq. S-6

where the indices H and L denote the heavy and light isotopes respectively. Mass spectrometers measure relative isotopic ratios for different samples. Accordingly, we define the relative isotopic ratio between two water samples collected at elevations z1 and z2 as:
Eq. S-7

This expression corresponds to Eq.1 in the main text.
Like the concentration of a solute, the relative isotopic ratio is vertically stratified in a still aquifer. The characteristic depth of this exponential reads:
Eq. S-8

which is about 140 km for isotopes differing by two neutrons. In the Lower Mount Simon aquifer, we therefore expect the relative isotopic ratio of such isotopes to vary by about h/hR ≈ 1.4 ‰. The resolution of modern mass spectrometers allows for such precision (Figs. 2 and 3 in the main text).
A.4.3 Gravity and diffusion. At equilibrium, gravity and molecular diffusion balance each other to maintain the vertical stratification of the solution. However, even a still aquifer needs not be at equilibrium, as the balance between gravity and diffusion requires time to establish itself. When discussing the implication of field observations in terms of gravity settling, we therefore need an estimate of the characteristic time over which the stratification takes place. To do so, we propose a simple one dimensional model.
We first return to a still water column, in the absence of any porous matrix. Assuming, for simplicity, that the solute concentration depends on elevation only, its gradient generates a vertical diffusion flux −D0∂C/∂z, where D0 is the diffusion coefficient of the solute in free water. We can measure its value in laboratory experiments (Table S-1). This flux tends to homogenise the solution.
Conversely, gravity pulls denser solutes downwards at velocity V0, thus inducing a convective flux −V0C which concentrates the solute near the aquifer’s bottom.
The settling velocity is too slow for direct measurements in the laboratory. Fortunately, we can derive its value from the Boltzmann distribution. Indeed, the total flux of solute vanishes at equilibrium, by definition. This condition reads:
Eq. S-9

in steady state, which indicates an exponential concentration profile. Equating this exponential profile with that of the statistical equilibrium, Eq. S-4, yields the Einstein-Smoluchowski relation:
Eq. S-10

For illustration, the settling velocity of chloride in free water is about 0.03 μm yr-1 (Table S-1).
In an aquifer, the porous matrix complicates gravity settling. Molecular diffusion and gravity settling still occur within the pores, but it is unclear how the porous matrix affects these processes at the macroscopic scale (Whitaker, 1967; Koch and Brady, 1987). As a reasonable approximation however, diffusion at the macroscopic scale is often modelled as linear diffusion, using an effective coefficient De that accounts for the effects of tortuosity.
Again, we do not know if this model is an accurate representation of gravity settling in an aquifer. It is, however, the only macroscopic model preserving the form of Eq. S-9 that is compatible with laboratory measurements of the diffusion coefficient, and that reaches statistical equilibrium in steady state.

Figure S-1 Gravity settling of chlorine in a still aquifer. (a) Evolution of the concentration profile. (b) Relaxation of the amplitude of the concentration profile C(z = 0) − C(z = h). Equilibrium corresponds to Eq. S-4, Fourier mode to Eq. S-19, and numerical simulations to Eq. S-11. Parameters estimated for the LMS aquifer (Table S-1).
A.4.4 Gravity settling in an aquifer. Mass balance combines the gravity and diffusion fluxes to change the concentration profile of the solute. Considering that the aquifer’s shape and properties do not vary in the horizontal direction, this balance reduces to the vertical direction:
Eq. S-11

Being second order in space, and first order in time, Eq. S-11 requires two boundary conditions and an initial condition, all of which vary with the specifics of the aquifer they represent. Here, we propose a simple set of boundary and initial conditions, in tune with the order of magnitude model presented in this section.
Assuming that the LMS aquifer is fully confined by cementation, the total flux of solute vanishes at its upper and lower boundaries. Mathematically,
Eq. S-12

Finally, for illustration, we assume that the solute was uniformly distributed at the time of the aquifer’s emplacement, which we define to be t = 0. Strictly speaking, this initial condition is not compatible with the boundary conditions. However, this issue is easily worked around by adding an infinitesimal boundary layer near the aquifer’s boundaries. Figure S-1a shows a numerical simulation of this system, for typical values of the diffusion coefficient, settling velocity and temperature of the LMS aquifer. As expected, the concentration profile departs from its homogeneous initial condition to concentrate more solute near the aquifer’s bottom. After a few tens of million years, the concentration profile is virtually indistinguishable from the Boltzmann equilibrium.
A.4.5 Characteristic settling time. To characterise the relaxation of the concentration profile towards the Boltzmann distribution, we first plot the evolution of the amplitude of the concentration profile, C(z = 0) − C(z = h) as a function of time (Fig. S-1b). After a short transient, this amplitude relaxes exponentially towards its equilibrium value. This behaviour is expected, as Eq. S-11 and its boundary conditions are linear.
We now fully exploit this linearity by applying a Fourier transform to our system. Accordingly, we seek a solution to Eq. S-11 and its boundary conditions in the form of a sum of modes, each of which is a complex exponential:
Eq. S-13

where Cn, kn and σn are the amplitude, the wave number and the growth rate of the n-th mode respectively. All of them are, in general, complex numbers. Substituting this decomposition into Eq. S-11 and its boundary conditions selects a discrete set of acceptable wavenumbers, and yields a relation between the growth rate and the wavenumber. The first mode is stationary:
Eq. S-14

The Einstein-Smoluchowsky equation allows us to identify the ratio De/Ve with the characteristic length hc defined by Eq. S-5. Therefore, the first mode is simply the Boltzmann distribution.
The next modes read
Eq. S-15

where i = √−1 is the imaginary number and n is a positive, non-vanishing integer. Regardless of the wave number kn, the associated growth rate σn is a negative real number. Therefore, all modes decay exponentially after the emplacement of the aquifer, except for the 0-th mode which corresponds to statistical equilibrium. The higher the order n of a mode, the faster it decays. Apart from the zeroth-order mode, the longest living mode corresponds to n = 1. It is the most likely to appear in field data.
For simplicity, we now approximate the concentration profile of a solute by its zeroth- and first order modes only. Mathematically, this is saying that the profile relaxes exponentially towards the Boltzmann distribution:
Eq. S-16

where we have defined τ, the characteristic settling time, as the opposite inverse of σ1, that is
Eq. S-17

This exponential decay towards the Boltzmann distribution accords qualitatively with the numerical simulations of Figure S-1. More quantitatively, we can estimate the settling time for chloride and bromide in the MS aquifer. When so doing, we note that the aquifer depth h (a few hundred metres) is much smaller than the characteristic depth hc (a few kilometres). Accordingly, the characteristic settling time reads
Eq. S-18

This expression, which corresponds to Eq. 2 in the main text, indicates that the settling velocity does not influence significantly the characteristic time, provided the aquifer is shallow enough. Numerically, we find a characteristic time of about 4.2 Myr for chloride in the LMS aquifer.
A.4.6 Shallow aquifer. To find a complete solution to Eq. S-13, we need to calculate the coefficients C0 and C1 corresponding to the initial condition C(t = 0) = Cm, where we define Cm as the average solute concentration in the aquifer. The first coefficient is easily deduced by identifying the corresponding mode with the Boltzmann distribution, and calculating its average. We then calculate the second coefficient by projecting our Fourier expansion on the initial condition. This calculation, although straightforward, yields complicated expressions. For simplicity, we now consider that the aquifer is shallow enough (h << hc), and approximate our expressions accordingly. We finally find:
Eq. S-19

In a shallow aquifer, the equilibrium concentration is essentially linear, and the most long lived mode is a cosine whose wavelength is twice the aquifer’s depth. In the LMS aquifer, this approximate solution is virtually indistinguishable from the numerical solution, except immediately after the aquifer’s emplacement (Fig. S-1).
A.4.7 Isotopic ratios. Apart from their molar masses, the physical properties of two-neutron mass isotopes are reasonably similar. For instance, the relative difference between the diffusion coefficient of 35Cl and that of 37Cl is about 0.15 % (Richter et al., 2003; Eggenkamp and Coleman, 2009). We may therefore assume that their characteristic settling times in an aquifer are about the same. Using Eq. S-19, we find that the concentration ratio for two isotopes reads:
Eq. S-20

where the superscripts H and L denote properties of the heavy and light isotopes, respectively. In accordance with our previous assumptions, we have assumed that the aquifer is shallow to establish the above equation (h << hc where hc corresponds to the heavier isotope). Finally, we can express the relative isotopic ratio between two samples collected at elevations z1 and z2 as:
Eq. S-21

Not surprisingly, the relative isotopic ratio vanishes when the aquifer is too shallow (h << hR), indicating a virtually homogeneous isotopic profile. More remarkably, ∆R does not depend on the distance between samples z1 − z2 only, but only on the absolute elevation of the samples above the aquifer’s bottom. At long times however (t >> τ), this peculiarity fades away, as the relative isotopic ratio returns to its equilibrium profile.
Table S-1 Quantities used in A.4. Brackets indicate typical range.
| Name | Symbol | Typical value |
| Boltzmann constant |  | 1.38 x 10⁻²³ J K-1 |
| Avogadro constant |  | 6.02 x 10²³ mol-1 |
| Acceleration of gravity |  | 9.81 m s-1 |
| Density of water |  | 1000 kg m-3 |
| Solute concentration |  | [2. 10] mol L-1 |
| Elevation |  | [0. 400] m |
| Water temperature |  | 324 K (50 °C) |
| Tortuosity of the porous matrix |  | 10 |
| Partial molar volume (Cl) |  | 21.6 cm3 mol-1 |
| Partial molar volume (Br) |  | 28.6 cm3 mol-1 |
| Molar mass (Cl) |  | 35.5 g mol-1 |
| Molar mass (Br) |  | 79.9 g mol-1 |
| Diffusion coefficient in free water (Cl) |  | 2.5 x 10⁻⁹ m2 s-1 |
| Diffusion coefficient in free water (Br) |  | 2.5 x 10⁻⁹ m2 s-1 |
| Diffusion coefficient in porous matrix (Cl) |  | 2.5 x 10⁻¹¹ m2 s-1 |
| Diffusion coefficient in porous matrix (Br) |  | 2.5 x 10⁻¹¹ m2 s-1 |
| Settling velocity in free water (Cl) |  | 1.06 x 10⁻¹³ m s-1 |
| Settling velocity in free water (Br) |  | 4.42 x 10⁻¹³ m s-1 |
| Settling velocity in porous matrix (Cl) |  | 1.06 x 10⁻¹⁵ m s-1 |
| Settling velocity in porous matrix (Br) |  | 4.42 x 10⁻¹⁵ m s-1 |
B. Supplementary Text and Figures
B.1 Geological background
The Illinois Basin is an intra-cratonic basin of ~150000 km2 which covers most of Illinois as well as parts of Kentucky, Indiana and Tennessee. It was formed during a rifting event in the early Cambrian and is now bound on the North by the Kankakee, the Mississippi River and the Wisconsin arches and on the South by the Cincinnati and the Pascola arches (Fig. S-2). The Basin is composed of Palaeozoic marine sediments ranging from Cambrian to Carboniferous and essentially consists of alternating clay-rich shale formations and sandstone units. The Mount Simon Sandstone is the deepest and less accessible formation of the Illinois Basin and reaches a maximum depth of 4300 m in Southern Illinois (Willman et al., 1975). It unconformably lies on the Precambrian crystalline basement (a low permeability structure composed of granite, granodiorite and rhyolite). The Argenta Sandstone formation is sometimes identified as a singular pre Mount Simon unit lying in between the basement and the Mount Simon Sandstone. In this study, because of the relatively poor thickness (few metres at most) of the Argenta formation, we made no distinction between the Mount Simon and the Argenta Sandstone. The petrographic study of the core allowed to distinguish three units in the Mount Simon Sandstone (Freiburg et al., 2014): the Lower Mount Simon (LMS) lying between depth -2130 m to -1955 m, is characterised by fluvial deposits and is considered as a high quality reservoir rock with 25 % log-porosity and 884 mD log-permeability; the Middle Mount Simon (MMS) occurring between depth -1955 m to -1785 m, has a porosity largely filled with diagenetic quartz and K-feldspar cementation which has resulted in a decrease of log-porosity to 12 % and of the log-permeability to 44 mD; the Upper Mount Simon (UMS) occurring from depth -1785 m to -1690 m, consists of intertidal sandstone and interbedded shale deposits and has a log-porosity of 15 % and log-permeability of 184 mD. The mechanism and the nature of the fluid responsible for the cementation observed in the Mount Simon, mostly in the MMS, has been debated in recent years. Some authors have suggested a basin scale north to south circulation of a warm fluid (Chen et al., 2001) consistent with the 100–130 °C fluid inclusion temperature of homogenisation (Fishman, 1997); but a more recent in situ δ18O-microanalysis study on quartz cements (Pollington et al., 2011) indicates that the cementation is more likely due to the burial of the Mount Simon Sandstone in presence of a brine with 20 % NaCl equivalent salinity.
B.2 Origin of the high salinity: Inferences from the Cl/Br ratio
Brines from the Cambrian strata in the Illinois basin have been sampled and characterised only recently by Locke et al. (2013), Panno et al. (2013) and Labotka et al. (2015). The Mount Simon Sandstone porewaters were sampled at 2 discrete levels in the Upper Mount Simon, and at 6 in the Lower Mount Simon. The shallower Ironton-Galesville sandstone was also sampled at 2 different levels (see Fig. S-3).
Chloride and bromide are conservative species in water. Because they are trace elements in sedimentary rocks that are not evaporitic, the Cl/Br ratio of a saline fluid is often considered as being inherited from the process that led to its salinity increase. Chloride and bromide are differently partitioned into alkali salts, of which the most common is halite (NaCl). Thereby, a fluid with a Cl/Br ratio lower than the seawater Cl/Br ratio (646) is usually interpreted as a seawater-like fluid that has evaporated up to halite saturation. By contrast, a fluid with a Cl/Br ratio above the seawater ratio is usually interpreted as resulting from the dissolution of evaporites (which must be dominated by halite and therefore poor in Br). Based on Cl/Br ratio interpretations, Panno et al. (2013) have thus suggested that both Mount Simon and Ironton-Galesville Sandstone brines must predominantly derive from a primary evaporative fluid (Cl/Br < 600). The fact that Cl− and Na+ concentrations are now far from the NaCl-saturation (≈360 g/L at 20 °C) indicates that primary evaporative fluids have been subsequently diluted (with groundwater or meteoric water or even seawater). However the evaporative scenario remains problematic for explaining high salinity porewaters in the Illinois Basin, since no substantial evaporite units have been found in the Basin. Panno et al. (2013) thus suggested that these brines formed outside of the basin and later migrated into the Illinois Cambrian strata. Panno et al. (2013) also pointed out the similarity of the brine’s Na/Br ratios with that of crystalline brines from the Canadian Shield, possibly indicating a crystalline basement contribution, also supported by the brine’s radiogenic 87Sr/86Sr signature (Labotka et al., 2015).
The uppermost Ironton-Galesville Sandstone aquifer has a distinctly higher Cl/Br ratio. This indicates that the main brine contributor for the Ironton-Galesville aquifer is probably a different primary evaporative brine. Its higher Cl/Br ratio would then indicate a lower extent of Cl precipitation into NaCl and therefore a lower extent of palaeo-seawater evaporation. This observation, together with chlorine and bromine isotope compositions (Table S-2), strongly suggest that the Eau-Claire Shale is preventing hydrogeological connection between the two Cambrian sandstones (Fig. S-4).
Table S-2 This Table is similar to the one presented in the main text (Table 1). In addition we added the Cl and Br concentrations and isotopic compositions measured in the Ironton-Galesville Sandstone, the Cambrian formation covering the Eau-Claire Shale. Isotopic data are reported versus Standard Mean Oceanic Chloride and Bromide, respectively. Error is 2σ.
| Sample | Depth (m) | TDS (g/L) | [Cl-] mmol/L | [Br-] mmol/L | Cl/Br | δ37Cl– SMOC (±0.10) ‰ | δ81Br– SMOB (±0.24) ‰ | |
| Ironton-Galesville | ||||||||
| VWS 11 | -1499 | 63.6 | 1017 | 2.3 | 442.2 | 0.02 | 1.43 | |
| VWS 10 | -1524 | 68.9 | 1110 | 2.4 | 462.5 | -0.08 | -0.35 | |
| Upper Mt. Simon | ||||||||
| VWS 9 | -1714 | 150.8 | 2504 | 6.2 | 404 | -0.90 | -0.45 | |
| VWS 8 | -1770 | 172.9 | 2732 | 6.9 | 396 | -0.50 | 0.11 | |
| Lower Mt. Simon | ||||||||
| VWS 7 | -1944 | 203.8 | 3371 | 8.6 | 392 | -0.49 | 0.02 | |
| VWS 6 | -2010 | 205.3 | 3397 | 8.7 | 390 | -0.27 | 0.29 | |
| VWS 5 | -2036 | 203 | 3341 | 8.4 | 398 | -0.21 | 0.32 | |
| VWS 4 | -2072 | 205.5 | 3414 | 8.7 | 392 | -0.03 | 0.86 | |
| VWS 3 | -2105 | 207.3 | 3384 | 9.3 | 364 | 0.18 | 0.91 | |
| VWS 2 | -2116 | 208.5 | 3362 | 9 | 374 | 0.18 | 1.17 | |
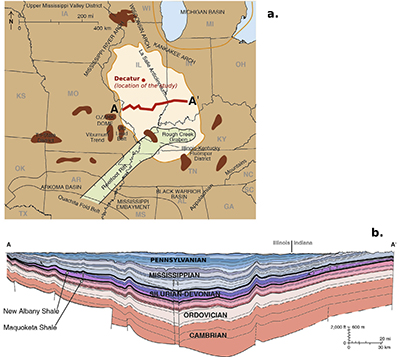
Figure S-2 (a) The Illinois Basin (bright coloured) and the different geological structures surrounding it. Decatur is the location chosen for the CO2 sequestration project and is therefore the location of the multi-level observation borehole where porewaters were sampled. (b) Geological cross section of the Illinois Basin between A and A’. The Mount Simon Formation corresponds to the deepest strata of the Cambrian units. Figures modified after Panno et al. (2013).
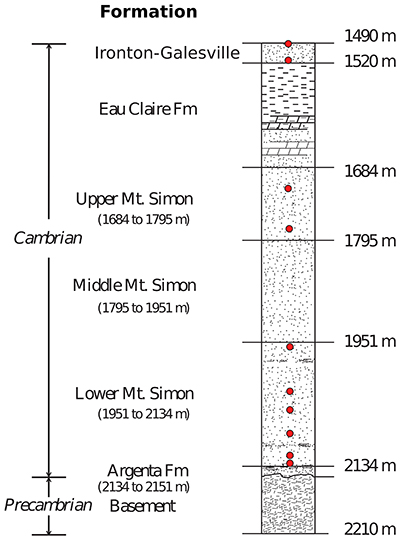
Figure S-3 Stratigraphic column from the igneous basement to the Ironton-Galesville Sandstone and the approximate depth for each different unit. Red circles indicate the depth at which porewaters were sampled in the course of the Decatur Project. Figure modified after Labotka et al. (2015).

Figure S-4 White diamonds are referring to samples from the Lower Mount Simon (LMS), black diamonds are referring to the samples from the Upper Mount Simon (UMS) and grey circles are referring to IG. We reported the isotopic compositions versus the inverse of the concentrations. Here we also plotted the data for the Ironton-Galesville formation, in order to show that Ironton-Galesville brines cannot neither be associated to any possible mixing with any of the units from the Mount Simon Sandstone.
Supplementary Information References
Bons, P.D., Gomez-Rivas, E. (2013) Gravitational fractionation of isotopes and dissolved components as a first-order process in crustal fluids. Economic Geology 108, 1195–1201.
Chen, Z., Riciputi, L.R., Mora, C.I., Fishman, N.S. (2001) Regional fluid migration in the Illinois basin: Evidence from in situ oxygen isotope analysis of authigenic K-feldspar and quartz from the Mount Simon Sandstone. Geology 29, 1067–1070.
Durchschlag, H., Zipper, P. (1994) Calculation of the partial volume of organic compounds and polymers. In: Lechner, M.D. (Ed.) Ultracentrifugation. Steinkopff, Darmstadt, 20–39.
Eggenkamp, H.G.M., Coleman, M.L. (2009) The effect of aqueous diffusion on the fractionation of chlorine and bromine stable isotopes. Geochimica et Cosmochimica Acta 73, 3539–3548.
Epstein, N. (1989) On tortuosity and the tortuosity factor in flow and diffusion through porous media. Chemical Engineering Science 44, 777–779.
Fishman, N.S. (1997) Basin-wide fluid movement in a Cambrian paleoaquifer: evidence from the Mt. Simon Sandstone, Illinois and Indiana. In: Montañez, I.P., Gregg, J.M., Shelton, K.L. (Eds.) Basin-Wide Diagenetic Patterns. SEPM Special Publications 57, 231–234.
Freiburg, J.T., Morse, D.G., Leetaru, H.E., Hoss, R.P., Yan, Q. (2014) A Depositional and Diagenetic Characterization of the Mt. Simon Sandstone at the Illinois Basin-Decatur Project Carbon Capture and Storage Site, Decatur, Illinois, USA. Illinois State Geological Survey, Prairie Research Institute, University of Illinois. Circular 583.
Hamann, S.D., Shaw, R.M., Lusk, J., Batts, B.D. (1984) Isotopic volume differences: The possible influence of pressure on the distribution of sulfur isotopes between sulfide minerals. Australian Journal of Chemistry 37, 1979–1989.
Kaufmann, R., Long, A., Bentley, H., Davis, S. (1984) Natural chlorine isotope variations. Nature 309, 338–340.
Koch, D.L., Brady, J.F. (1987) A non-local description of advection-diffusion with application to dispersion in porous media. Journal of Fluid Mechanics 180, 387–403.
Labotka, D.M., Panno, S.V., Locke, R.A., Freiburg, J.T. (2015) Isotopic and geochemical characterization of fossil brines of the Cambrian Mt. Simon Sandstone and Ironton–Galesville Formation from the Illinois Basin, USA. Geochimica et Cosmochimica Acta 165, 342–360.
Li, Y., Gregory, S. (1974) Diffusion of ions in sea water and in deep-sea sediments. Geochimica et Cosmochimica Acta 38, 703–714.
Locke, R.A., Larssen, D., Salden, W., Patterson, C., Kirksey, J., Iranmanesh, A., Wimmer, B., Krapac, I. (2013). Preinjection reservoir fluid characterization at a CCS demonstration site: Illinois Basin Decatur Project, USA. Energy Procedia 37, 6424–6433.
Long, A., Kaufmann, R.S., Martin, J.G., Wirt, L., Finley, J.B. (1993) High-precision measurement of chlorine stable isotope ratios. Geochimica et Cosmochimica Acta 57, 2907–2912.
Louvat, P., Bonifacie, M., Giunta, T., Michel, A., Coleman, M. (2016) Determination of bromine stable isotope ratios from saline solutions by “wet plasma” MC-ICPMS including a comparison between high-and low-resolution modes, and three introduction systems. Analytical Chemistry 88, 3891–3898.
Mangelsdorf, P.C., Manheim, F.T., Gieskes, J.M.T.M. (1970) Role of gravity, temperature gradients, and ion-exchange media in formation of fossil brines. AAPG Bulletin 54, 617–626.
Panno, S.V., Hackley, K.C., Locke, R.A., Krapac, I.G., Wimmer, B., Iranmanesh, A., Kelly, W.R. (2013) Formation waters from Cambrian-age strata, Illinois Basin, USA: Constraints on their origin and evolution. Geochimica et Cosmochimica Acta 122, 184–197.
Perrin, J. (1916) Atoms. D. Van Nostrand Company, New York.
Pollington, A.D., Kozdon, R., Valley, J.W. (2011) Evolution of quartz cementation during burial of the Cambrian Mount Simon Sandstone, Illinois Basin: In situ microanalysis of 18O. Geology 39, 1119–1122.
Pytkowicz, R. (1963) Gravity and the properties of sea water. Limnology and Oceanography 8, 286–287.
Richter, F.M., Davis, A.M., DePaolo, D.J., Watson, E.B. (2003) Isotope fractionation by chemical diffusion between molten basalt and rhyolite. Geochimica et Cosmochimica Acta 67, 3905–3923.
Robinson, R.A., Stokes, R.H. (1959) Electrolytic solutions. Butterworths Scientific Publication, London.
Willman, H.B., Atherton, E., Buschbach, T.C., Collinson, C.W., Frye, J.C., Hopkins, M.E., Simon, J.A. (1975) Handbook of Illinois Stratigraphy. Bulletin no. 095. Illinois State Geological Survey, Urbana, Illinois.
Whitaker, S. (1967) Diffusion and dispersion in porous media. AIChE Journal 13, 420–427.
Figures and Tables
Table 1 Porewaters sampled at nine discrete depths within the MSS from a single, multi-level observation well. All data except the δ37Cl and δ81Br were measured at the ISGS (Panno et al., 2013
Panno, S.V., Hackley, K.C., Locke, R.A., Krapac, I.G., Wimmer, B., Iranmanesh, A., Kelly, W.R. (2013) Formation waters from Cambrian-age strata, Illinois Basin, USA: Constraints on their origin and evolution. Geochimica et Cosmochimica Acta 122, 184–197.
; Labotka et al., 2015Labotka, D.M., Panno, S.V., Locke, R.A., Freiburg, J.T. (2015) Isotopic and geochemical characterization of fossil brines of the Cambrian Mt. Simon Sandstone and Ironton–Galesville Formation from the Illinois Basin, USA. Geochimica et Cosmochimica Acta 165, 342–360.
). δ37Cl and δ81Br were measured at IPGP. Errors are reported in 2σ.| Sample | Depth (m) | T (°C) | TDS (g/L) | [Cl-] mmol/L | [Br-] mmol/L | Cl/Br | δ18O–SMOW (±0.6) ‰ | δD–SMOW (±4.0) ‰ | δ37Cl–SMOC (±0.10) ‰ | δ81Br–SMOB (±0.24) ‰ | |
| Upper Mt. Simon | |||||||||||
| VWS 9 | -1714 | 46 | 150.8 | 2504 | 6.2 | 404 | -4.9 | -32 | -0.90 | -0.45 | |
| VWS 8 | -1770 | 48 | 172.9 | 2732 | 6.9 | 396 | -5 | -34 | -0.50 | 0.11 | |
| Lower Mt. Simon | |||||||||||
| VWS 7 | -1944 | 50 | 203.8 | 3371 | 8.6 | 392 | -3.8 | -25 | -0.49 | 0.02 | |
| VWS 6 | -2010 | 51 | 205.3 | 3397 | 8.7 | 390 | -3.6 | -25 | -0.27 | 0.29 | |
| VWS 5 | -2036 | 48 | 203 | 3341 | 8.4 | 398 | -2.9 | -23 | -0.21 | 0.32 | |
| VWS 4 | -2072 | 48 | 205.5 | 3414 | 8.7 | 392 | -2.8 | -22 | -0.03 | 0.86 | |
| VWS 3 | -2105 | 50 | 207.3 | 3384 | 9.3 | 364 | -2.9 | -23 | 0.18 | 0.91 | |
| VWS 2 | -2116 | 50 | 208.5 | 3362 | 9 | 374 | -3 | -24 | 0.18 | 1.17 | |
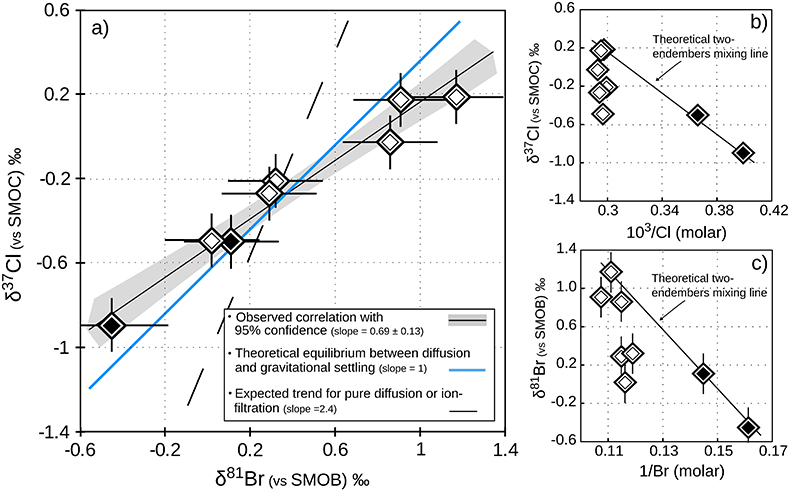
Figure 1 Isotope ratios and concentrations co-variations in the Upper (black diamonds) and in the Lower units (white diamonds). δ37Cl and δ81Br are apparently linearly correlated (R2 = 0.95) throughout the MSS (a). This linear correlation cannot be attributed to mixing between the Upper and Lower porewaters given the absence of inverse correlation with concentrations (b,c). Instead, this correlation is explained by gravitational settling affecting both systems. Errors are 2σ.
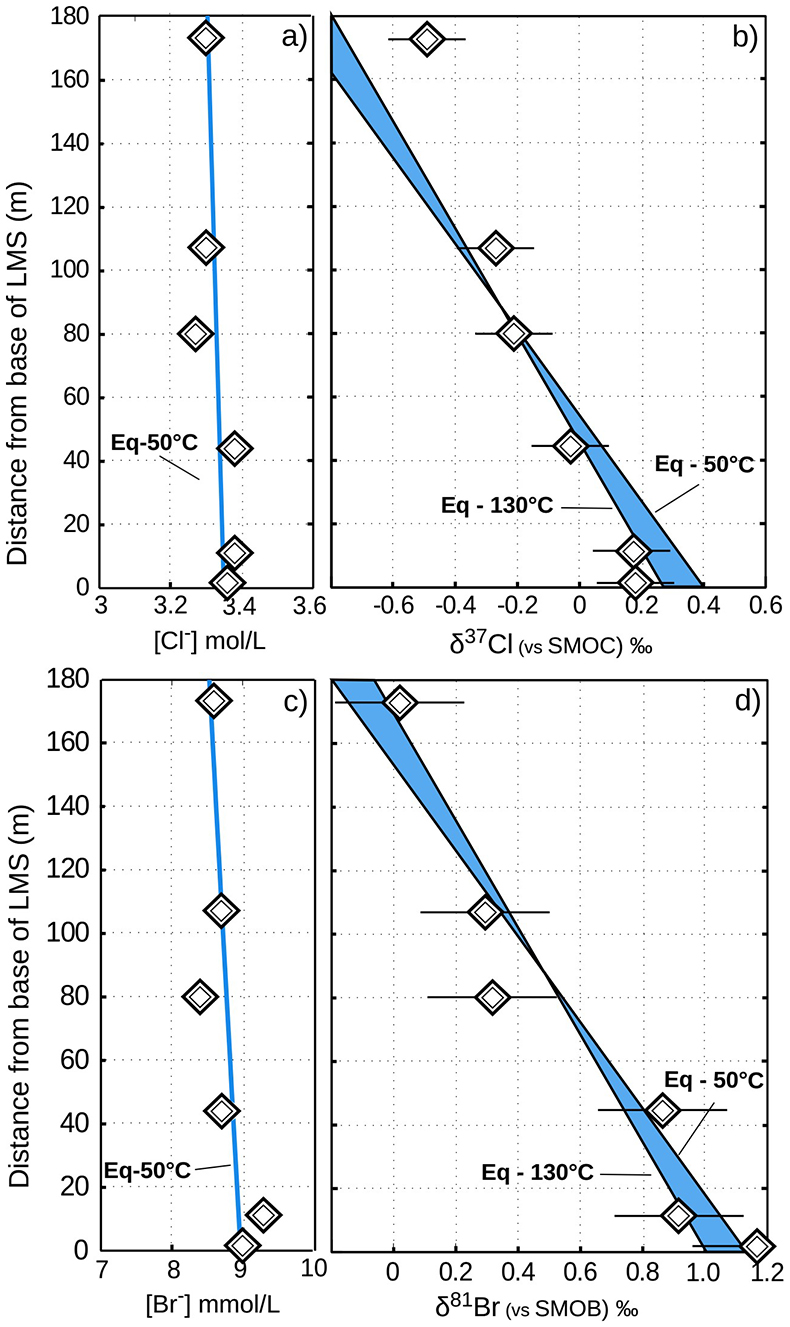
Figure 2 The gravitation-diffusion equilibrium slope dependence on temperature. When z is sufficiently small, Eq. 1 might be simplified to a first order approximation such that
 where the enrichment of the isotopic ratio is therefore linearly correlated to depth. This approximation attests that for a given isotopic system, the slope of the equilibrium will only depend on the temperature. We report Cl- and Br- concentrations (a,c), as well as δ37Cl and δ81Br (b,d) from the Lower unit aquifer, together with equilibrium enrichment profiles calculated for temperatures of 50 °C (actual temperature of the formation) and of 130 °C (cementation temperature; though highest temperature reached during burial was probably closer to 150 °C). Given the scale of the concentration plots (a,c) 50 °C and 130 °C equilibrium profiles are not distinguishable. Error is 2σ.
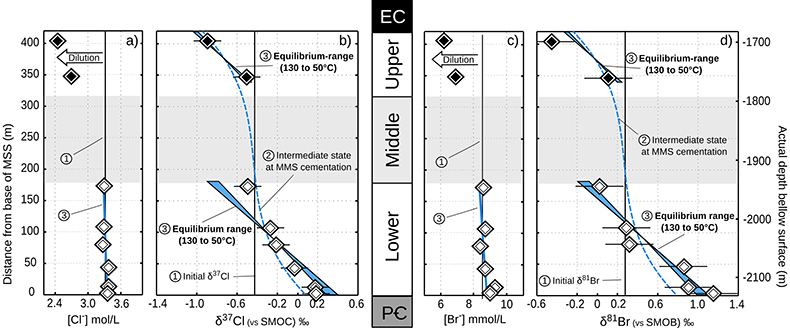
Figure 3 Concentrations and isotopic distributions for Cl (a,b) and for Br (c,d) reported with depth in the MSS. EC is the Eau-Claire Shale and PC is the Precambrian basement. We hypothesise the following scenario: 1) An all homogeneous (in concentrations and in isotope compositions) motionless fluid in the MSS (thin black line). 2) The cementation of the Middle unit occurred relatively rapidly, before equilibrium is reached throughout the entire MSS (dashed line). 3) Disconnected Upper and Lower aquifers then separately pursue their evolution toward equilibrium (blue shaded areas). The concentration decrease in the Upper unit (a,c) is then resulting from a dilution event (as proposed by Panno et al., 2013) which must have occurred after stage (2).
Back to article
Supplementary Figures and Tables
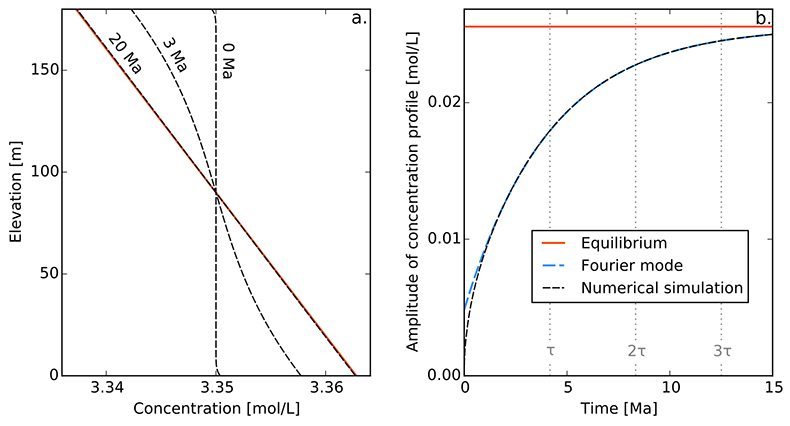
Figure S-1 Gravity settling of chlorine in a still aquifer. (a) Evolution of the concentration profile. (b) Relaxation of the amplitude of the concentration profile C(z = 0) − C(z = h). Equilibrium corresponds to Eq. S-4, Fourier mode to Eq. S-19, and numerical simulations to Eq. S-11. Parameters estimated for the LMS aquifer (Table S-1).
Table S-1 Quantities used in A.4. Brackets indicate typical range.
| Name | Symbol | Typical value |
| Boltzmann constant |  | 1.38 x 10⁻²³ J K-1 |
| Avogadro constant |  | 6.02 x 10²³ mol-1 |
| Acceleration of gravity |  | 9.81 m s-1 |
| Density of water |  | 1000 kg m-3 |
| Solute concentration |  | [2. 10] mol L-1 |
| Elevation |  | [0. 400] m |
| Water temperature |  | 324 K (50 °C) |
| Tortuosity of the porous matrix |  | 10 |
| Partial molar volume (Cl) |  | 21.6 cm3 mol-1 |
| Partial molar volume (Br) |  | 28.6 cm3 mol-1 |
| Molar mass (Cl) |  | 35.5 g mol-1 |
| Molar mass (Br) |  | 79.9 g mol-1 |
| Diffusion coefficient in free water (Cl) |  | 2.5 x 10⁻⁹ m2 s-1 |
| Diffusion coefficient in free water (Br) |  | 2.5 x 10⁻⁹ m2 s-1 |
| Diffusion coefficient in porous matrix (Cl) |  | 2.5 x 10⁻¹¹ m2 s-1 |
| Diffusion coefficient in porous matrix (Br) |  | 2.5 x 10⁻¹¹ m2 s-1 |
| Settling velocity in free water (Cl) |  | 1.06 x 10⁻¹³ m s-1 |
| Settling velocity in free water (Br) |  | 4.42 x 10⁻¹³ m s-1 |
| Settling velocity in porous matrix (Cl) |  | 1.06 x 10⁻¹⁵ m s-1 |
| Settling velocity in porous matrix (Br) |  | 4.42 x 10⁻¹⁵ m s-1 |
Table S-2 This Table is similar to the one presented in the main text (Table 1). In addition we added the Cl and Br concentrations and isotopic compositions measured in the Ironton-Galesville Sandstone, the Cambrian formation covering the Eau-Claire Shale. Isotopic data are reported versus Standard Mean Oceanic Chloride and Bromide, respectively. Error is 2σ.
| Sample | Depth (m) | TDS (g/L) | [Cl-] mmol/L | [Br-] mmol/L | Cl/Br | δ37Cl– SMOC (±0.10) ‰ | δ81Br– SMOB (±0.24) ‰ | |
| Ironton-Galesville | ||||||||
| VWS 11 | -1499 | 63.6 | 1017 | 2.3 | 442.2 | 0.02 | 1.43 | |
| VWS 10 | -1524 | 68.9 | 1110 | 2.4 | 462.5 | -0.08 | -0.35 | |
| Upper Mt. Simon | ||||||||
| VWS 9 | -1714 | 150.8 | 2504 | 6.2 | 404 | -0.90 | -0.45 | |
| VWS 8 | -1770 | 172.9 | 2732 | 6.9 | 396 | -0.50 | 0.11 | |
| Lower Mt. Simon | ||||||||
| VWS 7 | -1944 | 203.8 | 3371 | 8.6 | 392 | -0.49 | 0.02 | |
| VWS 6 | -2010 | 205.3 | 3397 | 8.7 | 390 | -0.27 | 0.29 | |
| VWS 5 | -2036 | 203 | 3341 | 8.4 | 398 | -0.21 | 0.32 | |
| VWS 4 | -2072 | 205.5 | 3414 | 8.7 | 392 | -0.03 | 0.86 | |
| VWS 3 | -2105 | 207.3 | 3384 | 9.3 | 364 | 0.18 | 0.91 | |
| VWS 2 | -2116 | 208.5 | 3362 | 9 | 374 | 0.18 | 1.17 | |
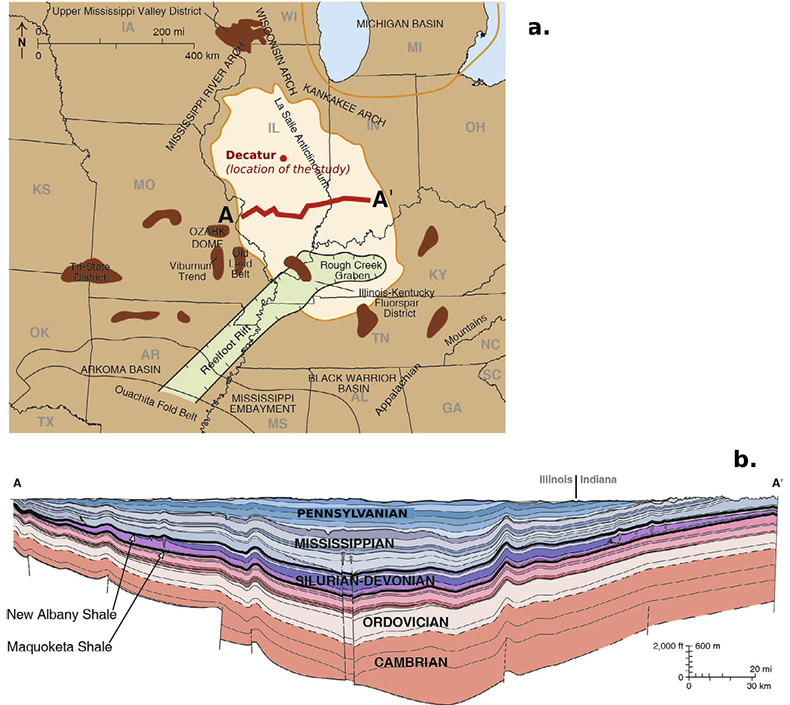
Figure S-2 (a) The Illinois Basin (bright coloured) and the different geological structures surrounding it. Decatur is the location chosen for the CO2 sequestration project and is therefore the location of the multi-level observation borehole where porewaters were sampled. (b) Geological cross section of the Illinois Basin between A and A’. The Mount Simon Formation corresponds to the deepest strata of the Cambrian units. Figures modified after Panno et al. (2013).
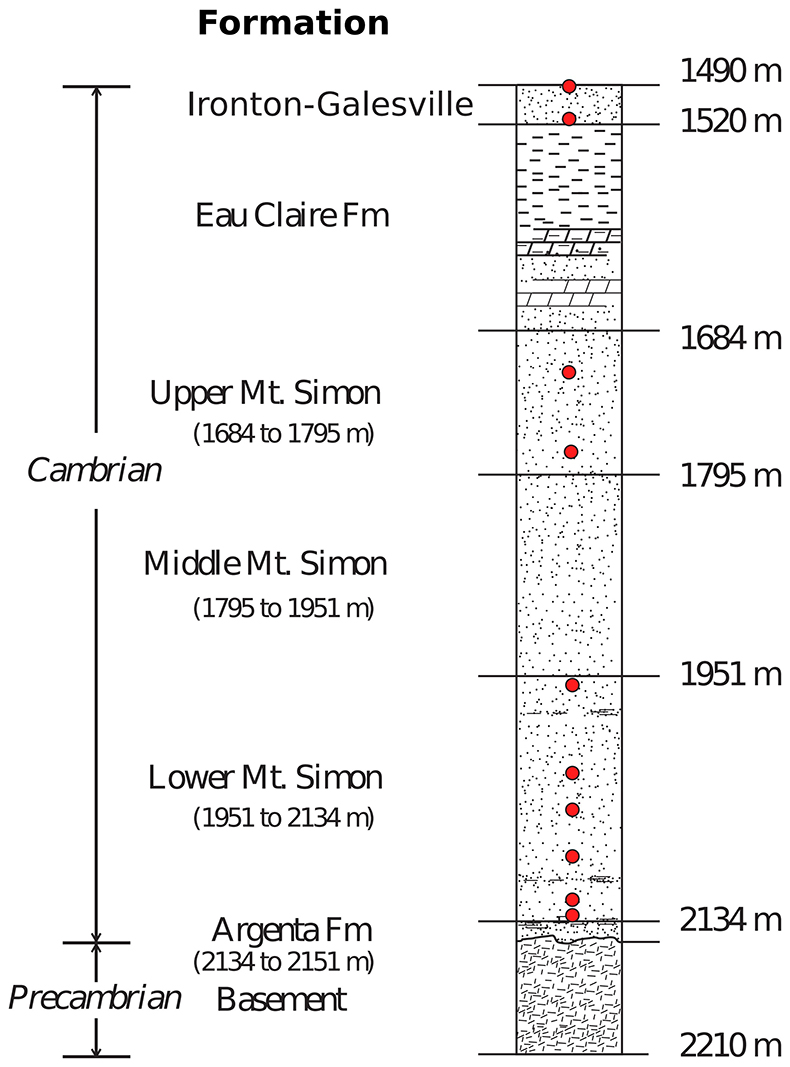
Figure S-3 Stratigraphic column from the igneous basement to the Ironton-Galesville Sandstone and the approximate depth for each different unit. Red circles indicate the depth at which porewaters were sampled in the course of the Decatur Project. Figure modified after Labotka et al. (2015).
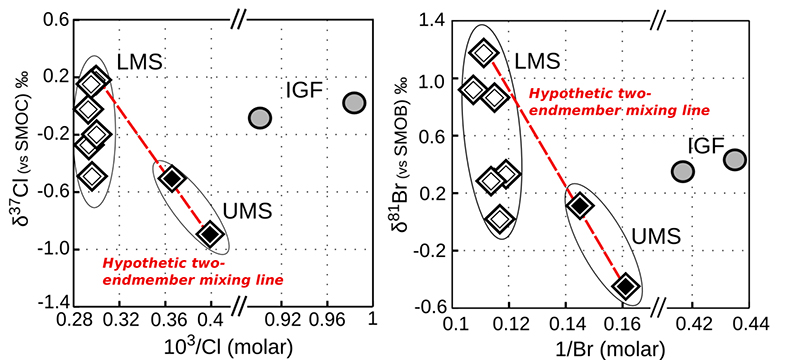
Figure S-4 White diamonds are referring to samples from the Lower Mount Simon (LMS), black diamonds are referring to the samples from the Upper Mount Simon (UMS) and grey circles are referring to IG. We reported the isotopic compositions versus the inverse of the concentrations. Here we also plotted the data for the Ironton-Galesville formation, in order to show that Ironton-Galesville brines cannot neither be associated to any possible mixing with any of the units from the Mount Simon Sandstone.


